The Jefferson City Nursing and Rehabilitation Center
Nursing Home & Memory Care · Jefferson City, MO
CMS overall rating Info The Overall CMS Rating is scored from 1 to 5 stars and combines results from health inspections, staffing levels, and quality measures. Health inspections carry the most weight. Staffing and quality scores can increase or decrease the final rating based on performance compared to state and national standards.

The Jefferson City Nursing and Rehabilitation Center

Nursing Home & Memory Care · Jefferson City, MO
CMS overall rating Info The Overall CMS Rating is scored from 1 to 5 stars and combines results from health inspections, staffing levels, and quality measures. Health inspections carry the most weight. Staffing and quality scores can increase or decrease the final rating based on performance compared to state and national standards.
Calculator: See prices in your area
The Jefferson City Nursing and Rehabilitation Center accepts Medicare, Medicaid, and private pay.

Overview of The Jefferson City Nursing and Rehabilitation Center

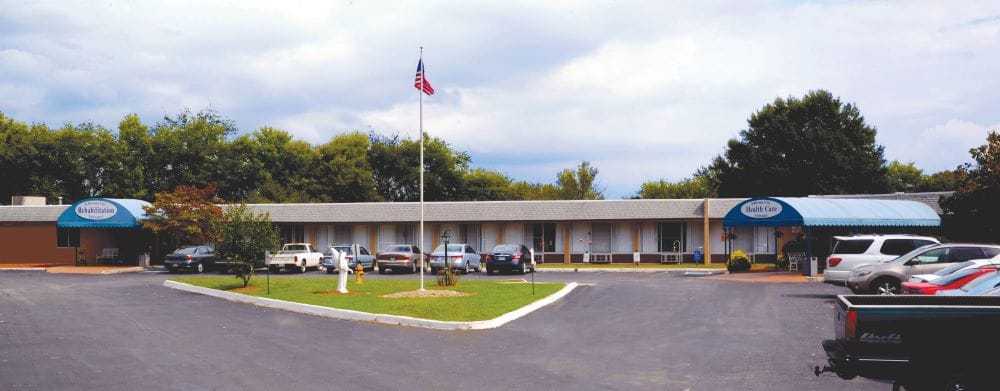
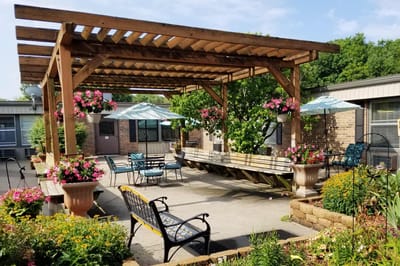
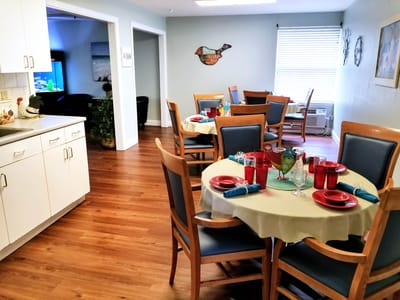
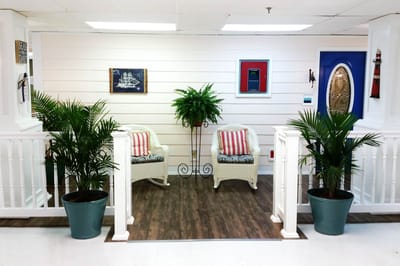
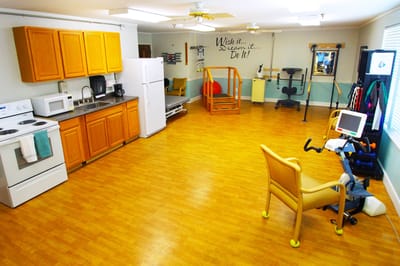
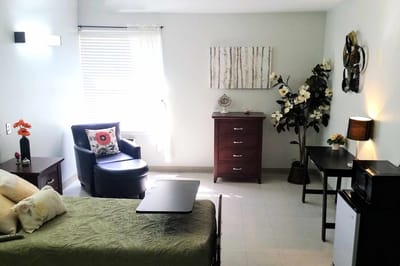
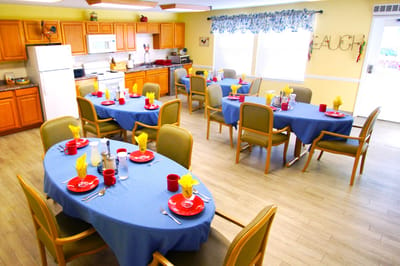
The Jefferson City Nursing and Rehabilitation Center stands as a beacon of excellence, delivering outstanding services that span from therapy to specialized memory care units. With a commitment to rapid recovery, their state-of-the-art suites offer a space for rejuvenation and healing, all within a vibrant and invigorating atmosphere. The memory care center boasts a secure environment with 28 dedicated beds, placing a strong emphasis on a family-oriented approach. This is evident not only in their family-style dining but also in the thoughtfully designed inclusive courtyard and serene outdoor spaces, providing a sense of comfort and togetherness.
A hallmark of the center is its unwavering dedication to cognitive stimulation for seniors, ensuring each day is filled with engaging activities that promote mental acuity and overall well-being. Beyond this, a comprehensive range of services is offered, including IV therapy, respiratory care, pain management, and even a beauty salon, reflecting their holistic approach to care. The vibrant community is characterized by its bold and contrasting colors, symbolizing a celebration of life in all its hues. Nestled in the heart of Jefferson City, this center stands as a testament to compassionate and quality care.

(573) 635-3131

Quality ratings

Measured by Centers for Medicare & Medicaid Services (CMS)

Overall rating Info The Overall CMS Rating combines results from health inspections, staffing levels and quality measures. Health inspections carry the most weight. Staffing and quality scores can increase or decrease the final rating based on performance compared to state and national standards.
▼ 24.0% Below MO avg. ▼ 24.0% Below MO avg.Click the badge to see the full State ranking.Click here to see the full State ranking.
Health Inspection Info Based on the results of the facility's three most recent standard inspections and any complaint investigations. CMS reviews the number, scope, and severity of deficiencies, with more recent findings weighted more heavily.
▼ 31.0% Below MO avg. ▼ 31.0% Below MO avg.Click the badge to see the full State ranking.Click here to see the full State ranking.
Staffing Info Measures average nursing staff hours per resident per day, including Registered Nurses (RNs) and total nursing staff. Ratings are adjusted based on the level of care residents require and are compared to state and national benchmarks.
▼ 7.4% Below MO avg. ▼ 7.4% Below MO avg.Click the badge to see the full State ranking.Click here to see the full State ranking.
Quality Measures Info Based on clinical and physical health indicators reported to CMS, such as hospital readmissions, falls, pressure ulcers, and improvements in mobility. These measures reflect how well residents' health needs are being managed.
▼ 28.3% Below MO avg. ▼ 28.3% Below MO avg.Click the badge to see the full State ranking.Click here to see the full State ranking.

Staffing hours breakdown

Info Daily nursing hours per resident by staff type, reported to CMS. Higher is generally better — compare this facility to state and national averages to see where staffing stands.

Hours per resident per day — compared to Missouri state averages

Total nursing care / resident Info This home is ranked 66th out of 276 homes in Missouri. Total adjusted nursing hours per resident per day, combining RN, LPN, and aide time. CMS adjusts this for case-mix so facilities can be fairly compared.
4h 17m per day
Rank #66 / 276Nurse hours — State benchmarkedThis home is ranked 66th out of 276 homes in Missouri. Shows adjusted nurse hours per resident per day benchmarked to the Missouri average, with a ranking across 276 Missouri SNFs. More hours mean more direct care. The national average is about 3.5 hrs; below 3.0 is a red flag.Click the rank badge to see the full State ranking.Click here to see the full State ranking.
This facility Missouri avg (3h 48m per day)
vs Missouri avg
+13%

2 of 6 metrics below state avg

Standout metric Physical Therapist is +100% above state avg
Staff type Hours / Day / Resident vs state avg
Registered Nurse (RN) Info RNs hold the highest nursing license and can assess residents, interpret test results, and direct care plans. More RN hours per day often signals stronger clinical oversight and faster response to health changes. 25m per day ▼ 11% State avg: 28m per day · National avg: 41m per day
LPN / LVN Info Licensed Practical Nurses (LPNs) or Licensed Vocational Nurses (LVNs) deliver routine hands-on care — medication administration, wound dressing, and monitoring vital signs. They work under RN supervision and make up a large share of daily bedside care. 1h 4m per day ▲ 56% State avg: 41m per day · National avg: 52m per day
Nurse Aide Info Certified Nurse Aides (CNAs) provide the most direct day-to-day assistance: bathing, dressing, feeding, and mobility. Nurse aide hours are typically the largest staffing category and directly affect residents' quality of life. 2h 32m per day ▲ 9% State avg: 2h 20m per day · National avg: 2h 21m per day
Weekend Total Nursing Info Combined nursing hours (RN + LPN + Nurse Aide) per resident per day on weekends. Staffing often drops on weekends — this figure reveals whether the facility maintains adequate coverage outside of weekday hours. 3h 1m per day ■ Avg State avg: 3h 3m per day · National avg: 3h 26m per day
Physical Therapist Info Hours per resident per day provided by licensed Physical Therapists (PTs) or PT Assistants. PT services help residents recover mobility after injury or illness and are especially important for post-acute (short-stay) rehabilitation. 4m per day ▲ 100% State avg: 2m per day · National avg: 4m per day
Weekend RN Info Registered nurse hours specifically on weekends. Facilities sometimes reduce RN presence on Saturdays and Sundays — a low weekend RN figure compared to weekday hours can indicate reduced clinical oversight when most administrative staff are absent. 13m per day ▼ 35% State avg: 20m per day · National avg: 29m per day

Types of Care at The Jefferson City Nursing and Rehabilitation Center

Memory Care Nursing Home

Capacity and availability

This home usually has availability

Occupancy lower than 85% suggests more openings may be available.

Higher occupancy than the Missouri average: 66.6%
Occupancy rate 67.5% Rank #165 / 283Occupancy rate — State benchmarkedThis home is ranked 165th out of 283 homes in Missouri. Shows this facility's occupancy rate versus the Missouri average, with its Statewide rank out of 283. Higher occupancy signals strong local demand and financial stability.Click the rank badge to see the full State ranking.Click here to see the full State ranking.
Avg. Length of Stay 264 days
Occupancy rate
67.5% Rank #165 / 283Occupancy rate — State benchmarkedThis home is ranked 165th out of 283 homes in Missouri. Shows this facility's occupancy rate versus the Missouri average, with its Statewide rank out of 283. Higher occupancy signals strong local demand and financial stability.Click the rank badge to see the full State ranking.Click here to see the full State ranking.
Avg. Length of Stay
264 days
Years in operation
21 years in operation Rank #52 / 93Years in operation — State benchmarkedThis home is ranked 52nd out of 93 homes in Missouri. Shows how long this facility has been in operation compared to other Missouri SNFs. Longer operating histories may benefit residents, families, and staff.Click the rank badge to see the full State ranking.Click here to see the full State ranking.
A longer operating history, which may indicate experience navigating regulations and delivering ongoing care.
Walk Score
Walk Score: 33 / 100 Rank #369 / 562Walk Score — State benchmarkedThis home is ranked 369th out of 562 homes in Missouri. Shows how walkable this facility's neighborhood is compared to the average Walk Score across Missouri SNFs. Higher scores benefit residents, families, and staff.Click the rank badge to see the full State ranking.Click here to see the full State ranking.
Somewhat walkable. A few nearby services may be reachable on foot, but most trips require transportation.
BBB Rating
BBB Rating: A+ (Not Accredited)
An independent rating from the Better Business Bureau based on factors such as complaint history, transparency, and business practices.
How BBB ratings work

License Details

CMS Certification Number265530

Staffing

Key information about the people who lead and staff this community.

Leadership

ContactRick Doerhoff, Executive Director

Contact The Jefferson City Nursing and Rehabilitation Center

Inspection History

In Missouri, the Department of Health and Senior Services, Division of Regulation and Licensure performs the inspections and unannounced surveys required for all long-term care providers.

Since 2022 · 4 years of data 34 deficiencies

Inspection Scorecard Info This scorecard compares key inspection, citation, and complaint metrics at this facility against the Missouri state average. Metrics rated ≥15% worse than average are highlighted in red; those ≥15% better are highlighted in green.

Since 2022 vs. Missouri state average
Overall vs. MO average 0 Worse No metrics in this bucket. 2 Better Metrics better than Missouri average:
• Total deficiencies (3% below)
• Deficiencies per year (3% below)
Latest Inspection April 28, 2025 Complaint Investigation

Deficiencies Info Deficiencies are formal regulatory issues recorded during state inspections.

This Facility MO Average vs. MO Avg
Total deficiencies Info Formal regulatory issues recorded by inspectors across all inspection types. 34 35 This facility has 3% fewer total deficiencies than a typical Missouri nursing home (34 vs. MO avg 35).↓ 3% better
Deficiencies per year Info Average deficiencies per year since 2022. 8.5 8.8 This facility has 3% fewer deficiencies per year than a typical Missouri nursing home (8.5 vs. MO avg 8.8).↓ 3% better

Inspection Reports Summary Info An editor-reviewed summary of the themes and findings across this facility's recent inspection reports.

The most recent inspection on April 28, 2025, identified a deficiency related to staff opening residents’ mail without their presence, which was substantiated during the complaint investigation. Earlier inspections showed a pattern of deficiencies involving nursing staff adequacy, documentation of care, resident dignity, environmental maintenance, food safety, and infection control. Prior complaint investigations noted issues with resident oversight, notification of family after incidents, and dignified care, with one immediate jeopardy related to infection control that was later resolved. Enforcement actions such as fines or license suspensions were not listed in the available reports. The facility’s inspection history shows ongoing challenges in staffing, documentation, and maintaining a safe, respectful environment, with no clear trend of sustained improvement or worsening.

Read the full inspection reports for this facility, including detailed findings and corrective actions.

Show Inspection Reports

Health Inspection History

Inspections since 2022
Total health inspections 9

Missouri average 6.6


Last Health inspection on Apr 2025

Total health citations
31 Rank #146 / 281Health citations — State benchmarkedThis home is ranked 146th out of 281 homes in Missouri. Shows this facility's total health deficiency citations benchmarked to the Missouri State average, with a ranking across all 281 MO SNFs. Lower citation counts earn a better rank.Click the rank badge to see the full State ranking.Click here to see the full State ranking.

Missouri average 36.5

Citations per inspection
3.44 Rank #46 / 281Citations per inspection — State benchmarkedThis home is ranked 46th out of 281 homes in Missouri. Shows average deficiency citations per CMS inspection for this facility versus the Missouri mean across 281 SNFs with citation data. Lower is better.Click the rank badge to see the full State ranking.Click here to see the full State ranking.

Missouri average 5.67


Health citations are formal notices following inspections when they fail to comply with safety and care standards.

21 of 31 citations resulted from standard inspections; and 10 of 31 resulted from complaint investigations.

Breakdown of citation severity (last 4 years)
Critical Health citations
2
186% worse than Missouri average

Missouri average: 0.7


Serious Health citations
1 Rank #1 / 130Serious citations (G–I) — State benchmarkedThis home is ranked 1st out of 130 homes in Missouri. Shows G–I scope serious health citations for this facility versus other Missouri SNFs. Lower counts rank better.Click the rank badge to see the full State ranking.Click here to see the full State ranking.
In line with Missouri average

Missouri average: 1

2 critical citations Missouri average: 0.7

1 serious citation Missouri average: 1

28 moderate citations Missouri average: 33.6

0 minor citations Missouri average: 1.2
Citations history (last 4 years)
Resident Rights moderate citation Apr 28, 2025
Corrected

Nursing Services moderate citation Mar 04, 2025
Corrected

Care Planning moderate citation Mar 04, 2025
Corrected

Nutrition moderate citation Dec 19, 2024
Corrected

Staffing Data

Reporting period: October 1 – December 31, 2025 (Q4 2025). Source: CMS Payroll-Based Journal report.

Total staff 126
Employees 115
Contractors 11
Staff to resident ratio 1.48:1
13% worse than Missouri average
Missouri average ratio: 1.69:1 Missouri average ratio: 1.69:1See full Missouri ranking
Avg staff/day 44
Average shift 8 hours
0% compared with Missouri average
Missouri average: 8.1 hours Missouri average shift: 8.1 hoursSee full Missouri ranking
Total staff hours (quarter) 32,233

Nursing staff breakdown

Q4 2025 · Oct 1 – Dec 31 More info This data comes from the CMS Payroll-Based Journal report covering October 1 – December 31, 2025.
Registered Nurse

Manages medical care and health needs.

RN Staff 7
Average shift length Info Average shift length. Calculated as total hours divided by days worked and average staff per day. 8.2 hours

No contractors work on this role.

Licensed Practical Nurse

Assists with medical care and medications.

LPN Staff 18
Average shift length Info Average shift length. Calculated as total hours divided by days worked and average staff per day. 8.2 hours

No contractors work on this role.

Certified Nursing Assistant

Helps with daily care and mobility.

CNA Staff 40
Average shift length Info Average shift length. Calculated as total hours divided by days worked and average staff per day. 8.1 hours

No contractors work on this role.

Contractor staffing

Q4 2025 · Oct 1 – Dec 31 More info This data comes from the CMS Payroll-Based Journal report covering October 1 – December 31, 2025.

Total hours from contractors

5.4%

1,726 contractor hours this quarter

Therapeutic Recreation Specialist: 3 Physical Therapy Aide: 2 Clinical Nurse Specialist: 2 Physical Therapy Assistant: 1 Respiratory Therapy Technician: 1 Qualified Social Worker: 1 Occupational Therapy Assistant: 1

Staff by category

Q4 2025 · Oct 1 – Dec 31 More info This data comes from the CMS Payroll-Based Journal report covering October 1 – December 31, 2025.
Certified Nursing Assistant 40 0 40 13,144 92 100% 8.1
Licensed Practical Nurse 18 0 18 5,609 92 100% 8.2
Physical Therapist 14 0 14 2,561 91 99% 7.9
Medication Aide/Technician 10 0 10 2,414 91 99% 8.8
Registered Nurse 7 0 7 2,379 91 99% 8.2
RN Director of Nursing 3 0 3 921 63 68% 8.9
Administrator 2 0 2 552 63 68% 8.8
Therapeutic Recreation Specialist 0 3 3 533 43 47% 6.3
Physical Therapy Aide 3 2 5 524 68 74% 6.2
Other Dietary Services Staff 4 0 4 494 41 45% 7.2
Nurse Practitioner 1 0 1 478 58 63% 8.2
Speech Language Pathologist 4 0 4 465 24 26% 6.9
Qualified Social Worker 1 1 2 441 59 64% 7.5
Physical Therapy Assistant 1 1 2 424 65 71% 6.5
Respiratory Therapy Technician 1 1 2 422 66 72% 6.4
Dietitian 2 0 2 330 40 43% 8.3
Dental Services Staff 1 0 1 273 36 39% 7.6
Occupational Therapy Aide 1 0 1 175 25 27% 7
Clinical Nurse Specialist 1 2 3 71 9 10% 7.9
Mental Health Service Worker 1 0 1 15 2 2% 7.6
Occupational Therapy Assistant 0 1 1 6 2 2% 3
40 Certified Nursing Assistant
% of Days 100%
18 Licensed Practical Nurse
% of Days 100%
14 Physical Therapist
% of Days 99%
10 Medication Aide/Technician
% of Days 99%
7 Registered Nurse
% of Days 99%
3 RN Director of Nursing
% of Days 68%
2 Administrator
% of Days 68%
3 Therapeutic Recreation Specialist
% of Days 47%
5 Physical Therapy Aide
% of Days 74%
4 Other Dietary Services Staff
% of Days 45%
1 Nurse Practitioner
% of Days 63%
4 Speech Language Pathologist
% of Days 26%
2 Qualified Social Worker
% of Days 64%
2 Physical Therapy Assistant
% of Days 71%
2 Respiratory Therapy Technician
% of Days 72%
2 Dietitian
% of Days 43%
1 Dental Services Staff
% of Days 39%
1 Occupational Therapy Aide
% of Days 27%
3 Clinical Nurse Specialist
% of Days 10%
1 Mental Health Service Worker
% of Days 2%
1 Occupational Therapy Assistant
% of Days 2%

Penalties and fines

Includes penalties issued in 2023

Federal penalties imposed by CMS for regulatory violations, including civil money penalties (fines) and denials of payment for new Medicare/Medicaid admissions.

Source: CMS Penalties Database (Data as of Jan 2026)

Total fines amount $27K Rank #208 / 283Federal fines — State benchmarkedThis home is ranked 208th out of 283 homes in Missouri. Shows this facility's cumulative CMS federal fine dollars versus the Missouri average among facilities with fines, and where it ranks among 283 skilled nursing facilities in the pool. Lower total dollars mean a better rank.Click the rank badge to see the full State ranking.Click here to see the full State ranking.
63% lower than Missouri average

Missouri average: $73K

Number of fines 2
18% fewer fines than Missouri average

Missouri average: 2.4

Payment Denials Info Serious action where Medicare and/or Medicaid temporarily stops payments for new residents until issues are fixed. 0
100% fewer payment denials than Missouri average

Missouri average: 0.7

Fines amount comparison
This facility $27K
Missouri average $73K
Penalty History

Penalties are imposed by CMS for violations of federal nursing home regulations.

1 penalty in the past 3 years

Sep 29, 2023 · $14K

Civil Money Penalty Info Fines imposed for noncompliance, which can be assessed per day or per instance of violation. Sep 29, 2023
$14K

Last updated: Jan 2026

Quality of care over time

These measures show how residents usually do over time at this home, based on health outcomes and preventive care.

High-risk clinical events score Info A composite score based on pressure ulcers, falls with injury, weight loss, walking ability decline, and activities of daily living decline. 13.4
22% worse than Missouri average

Missouri average: 10.9

Functional decline score Info A composite score based on activities of daily living decline, walking ability decline, and incontinence. 21.4
10% worse than Missouri average

Missouri average: 19.5

Long-stay resident measures
Significantly below average Missouri avg: 2.7 Info CMS star rating based on long-stay quality measure performance. 5 stars = significantly above average, 1 star = significantly below average.
Need for Help with Daily Activities Increased Info Percent of long-stay residents whose need for help with daily activities has increased 18.8%
5% better than Missouri average

Missouri average: 19.8%

Walking Ability Worsened Info Percent of long-stay residents whose ability to move independently worsened 27.6%
34% worse than Missouri average

Missouri average: 20.6%

Low Risk Residents with Bowel/Bladder Incontinence Info Percent of low risk long-stay residents who lose control of their bowels or bladder 17.8%
In line with Missouri average

Missouri average: 18.1%

Falls with Major Injury Info Percent of long-stay residents experiencing one or more falls with major injury 5.2%
29% worse than Missouri average

Missouri average: 4.0%

High Risk Residents with Pressure Ulcers Info Percent of long-stay high risk residents with pressure ulcers 11.6%
130% worse than Missouri average

Missouri average: 5.0%

Urinary Tract Infection Info Percent of long-stay residents with a urinary tract infection 2.7%
In line with Missouri average

Missouri average: 2.7%

Lost Too Much Weight Info Percent of long-stay residents who lose too much weight 3.7%
34% better than Missouri average

Missouri average: 5.6%

Depressive Symptoms Info Percent of long-stay residents who have depressive symptoms 0.4%
97% better than Missouri average

Missouri average: 12.8%

Antipsychotic Use Info Percent of long-stay residents who received an antipsychotic medication 17.0%
23% better than Missouri average

Missouri average: 22.0%

Pneumococcal Vaccine Info Percent of long-stay residents assessed and appropriately given the pneumococcal vaccine 83.1%
In line with Missouri average

Missouri average: 85.2%

Influenza Vaccine Info Percent of long-stay residents assessed and appropriately given the seasonal influenza vaccine 96.5%
6% better than Missouri average

Missouri average: 90.9%

Hospitalizations per 1,000 days Info Number of hospitalizations per 1,000 long-stay resident days. 1.54
26% better than Missouri average

Missouri average: 2.08

ED visits per 1,000 days Info Number of outpatient emergency department visits per 1,000 long-stay resident days. 1.93
18% better than Missouri average

Missouri average: 2.35

Short-stay resident measures
Above average Missouri avg: 2.1 Info CMS star rating based on short-stay quality measure performance. 5 stars = much above average, 1 star = much below average.
Pneumococcal Vaccine Info Percent of short-stay residents assessed and appropriately given the pneumococcal vaccine 26.6%
60% worse than Missouri average

Missouri average: 66.6%

Antipsychotic medication increase Info Percent of short-stay residents who newly received an antipsychotic medication 6.7%
201% worse than Missouri average

Missouri average: 2.2%

Influenza Vaccine Info Percent of short-stay residents assessed and appropriately given the seasonal influenza vaccine 40.4%
36% worse than Missouri average

Missouri average: 63.5%

Re-hospitalized after SNF stay Info Percentage of short-stay residents who were re-hospitalized after their nursing home admission. 17.5%
31% better than Missouri average

Missouri average: 25.3%

Emergency department visits Info Percentage of short-stay residents who had an outpatient emergency department visit. 6.4%
52% better than Missouri average

Missouri average: 13.4%

Falls with major injury Info Percentage of SNF residents who experience falls with major injury during their stay. 3.6%
364% worse than Missouri average

Missouri average: 0.8%

Ability to care for self at discharge Info Percentage of residents at or above expected ability to care for themselves at discharge. 63.6%
19% better than Missouri average

Missouri average: 53.7%

Successful return to home or community Info Rate of successful return to home or community from a skilled nursing facility. 43.5%
14% worse than Missouri average

Missouri average: 50.6%

Breakdown by payment type

Medicare

25% of new residents, usually for short-term rehab.

Typical stay 3 - 4 months

Private pay

65% of new residents, often for short stays.

Typical stay 3 months

Medicaid

10% of new residents, often for long-term daily care.

Typical stay 4 - 5 years

Facility Characteristics

Source: CMS Long-Term Care Facility Characteristics (Data as of Jan 2026)

Total residents 85
Medicare
9
10.6% of residents
Medicaid
65
76.5% of residents
Private pay or other
11
12.9% of residents
Programs & Services
Residents Group

Residents meet regularly to discuss policies, care quality, and activities

Active Resident Council

Organized group of residents that meets regularly to discuss facility policies, quality of life, and activities.

Finances and operations

Privately-owned community
Home revenue
$8.3M
Operating loss
-$1.1M
Privately-owned community
Home revenue
$8.3M Rank #97 / 286Revenue — State benchmarkedThis home is ranked 97th out of 286 homes in Missouri. Shows this facility's annual revenue compared to the Missouri SNF average. Higher revenue generally means more resources for staffing and capital — read alongside Payroll %.Click the rank badge to see the full State ranking.Click here to see the full State ranking.
Operating loss
-$1.1M
Payroll costs Info The portion of the home's budget spent on staff, including nurses, caregivers, and other employees who support care and operations. Rank #66 / 286Payroll — State benchmarkedThis home is ranked 66th out of 286 homes in Missouri. Shows total annual staff payroll benchmarked to the Missouri average. Higher payroll investment relative to peers often signals better staffing and less reliance on cheaper contract labor.Click the rank badge to see the full State ranking.Click here to see the full State ranking.
$5.7M
68.5% of revenue Rank #39 / 286Payroll % — State benchmarkedThis home is ranked 39th out of 286 homes in Missouri. Shows payroll as a percentage of revenue versus the Missouri average. Well-run Missouri SNFs typically land around 60–71% — the top third Statewide. Below 25% may signal understaffing or heavy agency use — read with Staffing ratings.Click the rank badge to see the full State ranking.Click here to see the full State ranking.
Other operating costs Info All remaining costs needed to run the home, such as food, utilities, building maintenance, supplies and administrative expenses.
$3.8M
Total costs $9.4M

Who this home usually serves

TYPE OF STAY

Primarily short stays

Residents typically stay for brief periods, with frequent admissions and discharges throughout the year.

Places of interest near The Jefferson City Nursing and Rehabilitation Center

Address 1.6 miles from city center Info Estimated distance in miles from Jefferson City's city center to The Jefferson City Nursing and Rehabilitation Center's address, calculated via Google Maps. — 0.47 miles to nearest hospital (OB/GYN Clinic-Jefferson City)

Calculate Travel Distance to The Jefferson City Nursing and Rehabilitation Center

Add your location

Address

Financial Assistance for
Nursing Home in Missouri

The Jefferson City Nursing and Rehabilitation Center is located in Jefferson City, Missouri.
Here are the financial assistance programs available to residents in Missouri.

Get Financial aid guidance

Aged and Disabled Waiver

Missouri Medicaid A&D Waiver

Age 65+ or disabled
General Missouri resident, Medicaid- eligible, nursing home-level care need.
Income Limits (2025) ~$2,829/month 300% FBR, individual
Asset Limits $2,000 (individual), $3,000 (couple).
MO

Rural access prioritized.

Benefits
Personal care (5-7 hours/day) Respite (240 hours/year) Adult day care (~$65/day) Home health services

Missouri Supplemental Nursing Care (SNC)

MO SNC

Age 65+
General Missouri resident, in approved facility.
Income Limits ~$1,215/month individual
Asset Limits $2,000 individual
MO

Supplements SSI; facility-based only.

Benefits
Monthly cash payment (~$156-$292/month) for care costs

Structured Family Caregiving Waiver (SFCW)

Missouri Structured Family Caregiving Waiver

Age 65+
General Missouri resident, MO HealthNet-eligible, NFLOC, dementia diagnosis, live with caregiver.
Income Limits (2025) ~$2,901/month (300% FBR, individual); QIT required.
Asset Limits $5,909.25 (individual), $11,818.45 (couple).
MO

Caregiver must be family; small program size.

Benefits
Cash stipend ($1,000-$1,500/month) to family caregiver Respite Training Supplies ($500/year)

MO HealthNet Aged, Blind, and Disabled (ABD)

Missouri MO HealthNet ABD

Age 65+ or disabled
General Missouri resident, MO HealthNet-eligible, needs help with 1+ ADL.
Income Limits (2025) ~$1,690/month (individual, projected); spenddown allowed.
Asset Limits $5,909.25 (individual), $11,818.45 (couple).
MO

Less intensive than waivers; statewide access.

Benefits
Personal care (2-4 hours/day) Homemaker services Limited respite Medical equipment

Medicare Savings Program (MSP)

Missouri Medicare Savings Program

Age 65+ or disabled
General Missouri resident, Medicare Part A/B.
Income Limits (2025) ~$2,510/month (QMB), ~$3,380/month (SLMB), ~$3,598/month (QI)—individual.
Asset Limits $9,430 (individual), $14,130 (couple).
MO

Three tiers; no waitlist; includes Extra Help for Part D.

Benefits
Covers Part B premiums ($174.70/month) Deductibles ($240/year) Copays (~20%)

Missouri Caregiver Program (Customized Caregiver Training & Relief)

Missouri Caregiver Program

Age
General Caregivers of 60+ with dementia, Missouri resident, functional needs (2+ ADLs).
Income Limits (2025) No strict cap; prioritizes low-income ~$24,980/year individual
Asset Limits Not assessed; need-based.
MO

Administered via AAAs and Alzheimer’s Association; rural focus.

Benefits
Respite (4-6 hours/week) Training Assistive tech ($500/year) Supplies

VA Aid and Attendance (A&A) and Housebound Benefits

Missouri VA Aid and Attendance/Housebound

Age 65+ or disabled veteran/spouse
General Missouri resident, wartime service, need for ADL help (A&A) or homebound.
Income Limits (2025) Net income < ~$1,984/month (veteran with dependent, A&A); pension offsets income.
Asset Limits ~$155,356 net worth limit
MO

High veteran demand in rural/urban areas.

Benefits
Cash (~$1,433-$2,642/month veteran, ~$951-$1,318 spouse) for care costs (e.g., in-home, assisted living)

Compare Nursing Home around Jefferson City

The information below is reported by the Missouri Department of Health and Senior Services, Division of Regulation and Licensure.

5 facilities compared · CMS & MO Dept. of Health data

Filter by care type
Heisinger Bluffs
NH

Nursing Home Licensed facility providing 24/7 skilled nursing care for residents with complex, ongoing medical needs. Staffed by RNs, LPNs, and CNAs. Inspected and star-rated annually by CMS. Accepts Medicare (short-term rehab) and Medicaid (long-term care).

AL

Assisted Living A licensed, long-term care setting for seniors or individuals with disabilities who need help with daily activities — like bathing, dressing, and medication management — but not 24-hour skilled nursing. Offers housing, meals, and around-the-clock support while aiming to maximize resident independence.

Jefferson City 111 80.5% +21% 3.36 +42% -10% $24.0k 17 5.7 - 59 - 32 Hb Operations Holdco LLC $5.4M $3.7M 68.1% 265794
StoneBridge Senior Living Oak Tree
NH

Nursing Home Licensed facility providing 24/7 skilled nursing care for residents with complex, ongoing medical needs. Staffed by RNs, LPNs, and CNAs. Inspected and star-rated annually by CMS. Accepts Medicare (short-term rehab) and Medicaid (long-term care).

AL

Assisted Living A licensed, long-term care setting for seniors or individuals with disabilities who need help with daily activities — like bathing, dressing, and medication management — but not 24-hour skilled nursing. Offers housing, meals, and around-the-clock support while aiming to maximize resident independence.

MC

Memory Care Secured, specialized care for people living with Alzheimer's or dementia. Staff trained in cognitive impairment, with higher staff-to-resident ratios and an environment designed to reduce confusion and wandering risk.

Jefferson City 42 42.9% -36% - -60% - $0 21 3.5 1 29 - 27 Ricky Doerhoff $5.0M $2.3M 46.9% 265819
Jefferson City Manor
NH

Nursing Home Licensed facility providing 24/7 skilled nursing care for residents with complex, ongoing medical needs. Staffed by RNs, LPNs, and CNAs. Inspected and star-rated annually by CMS. Accepts Medicare (short-term rehab) and Medicaid (long-term care).

AL

Assisted Living A licensed, long-term care setting for seniors or individuals with disabilities who need help with daily activities — like bathing, dressing, and medication management — but not 24-hour skilled nursing. Offers housing, meals, and around-the-clock support while aiming to maximize resident independence.

Jefferson City 102 70.2% +5% 3.53 -22% -5% $8.3k 34 3.4 2 61 - 4 Cynthia Juckette $13.2M $4.2M 31.9% 265285
Stonebridge Adams Street
NH

Nursing Home Licensed facility providing 24/7 skilled nursing care for residents with complex, ongoing medical needs. Staffed by RNs, LPNs, and CNAs. Inspected and star-rated annually by CMS. Accepts Medicare (short-term rehab) and Medicaid (long-term care).

AL

Assisted Living A licensed, long-term care setting for seniors or individuals with disabilities who need help with daily activities — like bathing, dressing, and medication management — but not 24-hour skilled nursing. Offers housing, meals, and around-the-clock support while aiming to maximize resident independence.

Jefferson City (Woodcrest) 120 44.9% -33% 3.67 +33% -2% $38.7k 37 4.6 1 49 - 54 Ruth Volkart $5.1M $2.8M 55.1% 265810
The Jefferson City Nursing and Rehabilitation Center
NH

Nursing Home Licensed facility providing 24/7 skilled nursing care for residents with complex, ongoing medical needs. Staffed by RNs, LPNs, and CNAs. Inspected and star-rated annually by CMS. Accepts Medicare (short-term rehab) and Medicaid (long-term care).

AL

Assisted Living A licensed, long-term care setting for seniors or individuals with disabilities who need help with daily activities — like bathing, dressing, and medication management — but not 24-hour skilled nursing. Offers housing, meals, and around-the-clock support while aiming to maximize resident independence.

Jefferson City 120 72.4% +9% 4.28 -27% +14% $27.3k 31 3.4 3 80 A+ 33 Victoria Gilbert $8.3M $5.7M 68.5% 265530

Frequently Asked Questions about The Jefferson City Nursing and Rehabilitation Center

Is The Jefferson City Nursing and Rehabilitation Center in a walkable area?

The Jefferson City Nursing and Rehabilitation Center has a walk score of 33. Somewhat walkable. A few nearby services may be reachable on foot, but most trips require transportation.

What is the phone number of The Jefferson City Nursing and Rehabilitation Center?

(573) 635-3131 will put you in contact with the team at The Jefferson City Nursing and Rehabilitation Center.

Is The Jefferson City Nursing and Rehabilitation Center Medicare or Medicaid certified?

Yes — The Jefferson City Nursing and Rehabilitation Center is a CMS-certified provider of Medicare and Medicaid.

Guides for Better Senior Living

Care Cost Calculator: See Prices in Your Area

Nursing Home Data Explorer

Don’t Wait Too Long: 7 Red Flag Signs Your Parent Needs Assisted Living Now

The True Cost of Assisted Living in 2025 – And How Families Are Paying For It

Understanding Senior Living Costs: Pricing Models, Discounts & Financial Assistance

Explore Open Rooms
1 Contact details
2 What type of senior care service are you looking for?
3 What budget do you have in mind for senior care?
4 How soon do you need to find care?
5 Additional details

Thank you for your interest!

Our team will be in touch shortly to help with next steps.