The Palms at Sebring
Nursing Home, Assisted Living, Independent Living, Memory Care, Nursing Care & Respite Care · Sebring, FL
CMS overall rating Info CMS (the Centers for Medicare & Medicaid Services) is the federal agency that rates nursing home quality. Its Overall Rating runs from 1 to 5 stars, combining health inspections, staffing, and quality measures, with inspections weighted most heavily.

The Palms at Sebring

Nursing Home, Assisted Living, Independent Living, Memory Care, Nursing Care & Respite Care · Sebring, FL
CMS overall rating Info CMS (the Centers for Medicare & Medicaid Services) is the federal agency that rates nursing home quality. Its Overall Rating runs from 1 to 5 stars, combining health inspections, staffing, and quality measures, with inspections weighted most heavily.
Calculator: See prices in your area
The Palms at Sebring accepts Insurance and/or HMO, Medicaid, Medicare, and private pay.

Overview of The Palms at Sebring

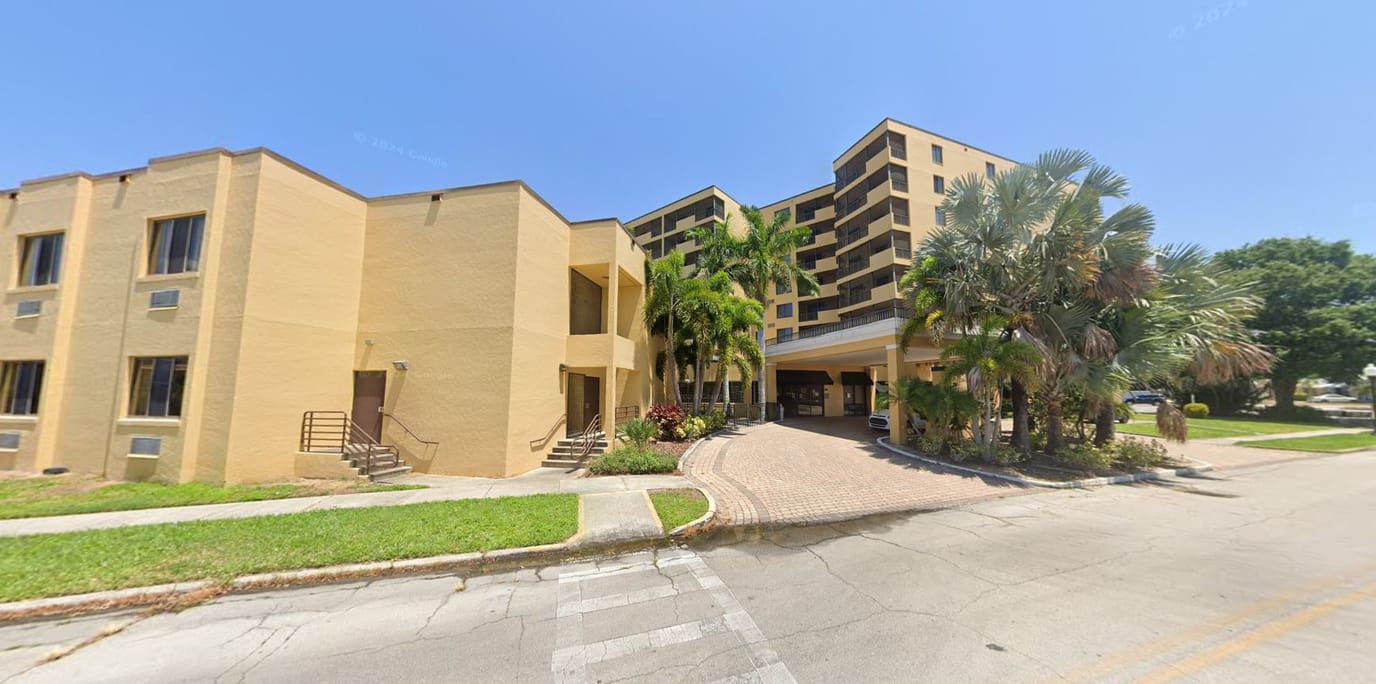
Every day is an opportunity for wellness and meaningful experiences at The Palms at Sebring, a dynamic senior living community in Sebring, FL, offering independent living, assisted living, memory care, skilled care, and short-term care. Age in place in a stunning location and well-designed apartments that accommodate various lifestyles and needs, including spacious studios, one-bedroom, and two-bedroom apartments. Providing multiple levels of care, the community warrants a smooth transition should residents’ care needs evolve. Whether you need 24-hour nursing care, comprehensive therapies, or assistance with daily living activities, you are guaranteed to find all the help you need.

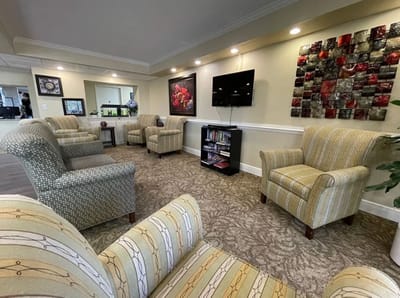
Enjoy a vibrant lifestyle with a robust daily schedule filled with resident-centered activities, daily outings, scheduled trips, and social hours. From birthday parties and movies to musical programs, outings, and other special events, residents will never run out of things to do and explore. Residents enjoy freshly made breakfast, lunch, and dinner without the hassles of cooking and cleaning, providing a joyful dining experience. At The Palms at Sebring, residents enjoy a positive and uplifting atmosphere with access to everything they need for a fulfilling and enriching lifestyle.

Quality ratings

Measured by Centers for Medicare & Medicaid Services (CMS)

Overall rating Info The Overall CMS Rating combines results from health inspections, staffing levels and quality measures. Health inspections carry the most weight. Staffing and quality scores can increase or decrease the final rating based on performance compared to state and national standards.
▼ 37.0% Below FL avg. ▼ 37.0% Below FL avg.FL average: 3.2Click the badge to see the full State ranking.Click here to see the full State ranking.
Health Inspection Info Based on the results of the facility's three most recent standard inspections and any complaint investigations. CMS reviews the number, scope, and severity of deficiencies, with more recent findings weighted more heavily.
▼ 64.4% Below FL avg. ▼ 64.4% Below FL avg.FL average: 2.8Click the badge to see the full State ranking.Click here to see the full State ranking.
Staffing Info Measures average nursing staff hours per resident per day, including Registered Nurses (RNs) and total nursing staff. Ratings are adjusted based on the level of care residents require and are compared to state and national benchmarks.
▼ 40.9% Below FL avg. ▼ 40.9% Below FL avg.FL average: 3.4Click the badge to see the full State ranking.Click here to see the full State ranking.
Quality Measures Info Based on clinical and physical health indicators reported to CMS, such as hospital readmissions, falls, pressure ulcers, and improvements in mobility. These measures reflect how well residents' health needs are being managed.
▲ 23.2% Above FL avg. ▲ 23.2% Above FL avg.FL average: 4.1Click the badge to see the full State ranking.Click here to see the full State ranking.

Staffing hours breakdown

Info Daily nursing hours per resident by staff type, reported to CMS. Higher is generally better — compare this facility to state and national averages to see where staffing stands.

Hours per resident per day — compared to Florida state averages

Total nursing care / resident Info This home is ranked 250th out of 253 homes in Florida for nurse hours. Total adjusted nursing hours per resident per day, combining RN, LPN, and aide time. CMS adjusts this for case-mix so facilities can be fairly compared.
3h 14m per day
Rank #250 / 253Nurse hours — State benchmarkedThis home is ranked 250th out of 253 homes in Florida. Shows adjusted nurse hours per resident per day benchmarked to the Florida average, with a ranking across 253 Florida facilities. More hours mean more direct care. The national average is about 3.5 hrs; below 3.0 is a red flag.Rankings are based only on facilities in Florida that report data for that category. Facilities without available data are excluded from the ranking.Click the rank badge to see the full State ranking.Click here to see the full State ranking.
This facility Florida avg (4h 2m per day)
vs Florida avg
-20%

4 of 6 metrics below state avg

Standout metric Physical Therapist is +40% above state avg
Staff typeHours / Day / Residentvs state avg
Registered Nurse (RN) Info RNs hold the highest nursing license and can assess residents, interpret test results, and direct care plans. More RN hours per day often signals stronger clinical oversight and faster response to health changes. 26m per day ▼ 41% State avg: 44m per day · National avg: 41m per day
LPN / LVN Info Licensed Practical Nurses (LPNs) or Licensed Vocational Nurses (LVNs) deliver routine hands-on care — medication administration, wound dressing, and monitoring vital signs. They work under RN supervision and make up a large share of daily bedside care. 59m per day ▲ 27% State avg: 47m per day · National avg: 52m per day
Nurse Aide Info Certified Nurse Aides (CNAs) provide the most direct day-to-day assistance: bathing, dressing, feeding, and mobility. Nurse aide hours are typically the largest staffing category and directly affect residents' quality of life. 2h 12m per day ▼ 6% State avg: 2h 20m per day · National avg: 2h 21m per day
Weekend Total Nursing Info Combined nursing hours (RN + LPN + Nurse Aide) per resident per day on weekends. Staffing often drops on weekends — this figure reveals whether the facility maintains adequate coverage outside of weekday hours. 3h 16m per day ▼ 7% State avg: 3h 31m per day · National avg: 3h 26m per day
Physical Therapist Info Hours per resident per day provided by licensed Physical Therapists (PTs) or PT Assistants. PT services help residents recover mobility after injury or illness and are especially important for post-acute (short-stay) rehabilitation. 7m per day ▲ 40% State avg: 5m per day · National avg: 4m per day
Weekend RN Info Registered nurse hours specifically on weekends. Facilities sometimes reduce RN presence on Saturdays and Sundays — a low weekend RN figure compared to weekday hours can indicate reduced clinical oversight when most administrative staff are absent. 18m per day ▼ 43% State avg: 32m per day · National avg: 29m per day

Capacity and availability

Avg. Length of Stay
100 days
Bed community size
141-bed community Rank #169 / 1074Bed count — State benchmarkedThis home is ranked 169th out of 1074 homes in Florida. Shows this facility's certified or reported bed count compared to other Florida facilities. Larger communities may offer more amenities, programs, and on-site services for residents and families.Rankings are based only on facilities in Florida that report data for that category. Facilities without available data are excluded from the ranking.Click the rank badge to see the full State ranking.Click here to see the full State ranking.
A larger shared setting that may offer more common spaces and organized community services.
Walk Score
Walk Score: 63 / 100 Rank #309 / 1486Walk Score — State benchmarkedThis home is ranked 309th out of 1486 homes in Florida. Shows how walkable this facility's neighborhood is compared to the average Walk Score across Florida facilities. Higher scores benefit residents, families, and staff.Rankings are based only on facilities in Florida that report data for that category. Facilities without available data are excluded from the ranking.Click the rank badge to see the full State ranking.Click here to see the full State ranking.
Moderately walkable. Some errands can be accomplished on foot, with a mix of nearby amenities.

About this community

License Details

Facility TypeAssisted Living Facility
StatusLicensed
IssuanceNovember 12, 2024
ExpirationJune 17, 2026 Expired
CountyHighlands
License Number4693
CMS Certification Number105037

Ownership & Operating Entity

The Palms at Sebring is legally operated by Pine Street Alf Operations Llc, and administered by Ashley Amundsen.

Profit StatusFor-profit

Type Of Units

Private
141 units
Total beds
141 units

Staffing

Key information about the people who lead and staff this community.

Languages Spoken

Creole English German Spanish

Leadership

ContactMs. Betty Thomas, Finance Director

Additional Policies & Features

Continuing Care Retirement Community (CCRC)

Contact The Palms at Sebring

Inspection History

In Florida, the Agency for Health Care Administration (AHCA) is the primary authority that conducts unannounced inspections and completes official health quality reports for all healthcare facilities.

Since 2021 · 5 years of data 50 citations 34 inspections 3 fines $7.5K fined
Inspection Score Info A composite 0–100 score combining this facility's inspections, citations, complaints, and enforcement actions relative to the Florida state average. The score below shows how many points this facility sits above or below the typical Florida nursing home score (the benchmark); higher is better.

6 points below the Florida average for nursing homes (83/100)

Rank #626 / 876 in Florida Inspection Score — State benchmarked This home is ranked 626th out of 876 homes in Florida. Shows this facility's inspection score compared to the Florida average among 876 comparable communities in the ranking pool. Rankings are based only on facilities in Florida that report data for that category. Facilities without available data are excluded from the ranking. Inspection score: 77 out of 100. Letter grade C+. 6 points below the Florida average for nursing homes (83/100)

Inspection Scorecard Info This scorecard compares key inspection, citation, and complaint metrics at this facility against the Florida state average. Metrics rated ≥15% worse than average are highlighted in red; those ≥15% better are highlighted in green.

Since 2021 vs. Florida state average
Overall vs. FL average 6 Worse Metrics worse than Florida average:
• Total citations (52% above)
• Citations per year (52% above)
• Citations per inspection (15% above)
• Total inspections (31% above)
• Inspections with citations (38% above)
• Inspection citation rate (5% above)
0 Better No metrics in this bucket.
Latest Inspection November 3, 2025 Complaint

Citations Info Citations are formal regulatory issues recorded during state inspections.

This FacilityFL Averagevs. FL Avg
Total citations Info Formal regulatory issues recorded by inspectors across all inspection types. 5033 This facility has 52% more total citations than a typical Florida nursing home (50 vs. FL avg 33).↑ 52% worse Rank #731 / 919 Total citations — State benchmarked This home is ranked 731st out of 919 homes in Florida. Shows this facility's total citations compared to the Florida average among 919 comparable communities in the ranking pool. Rankings are based only on facilities in Florida that report data for that category. Facilities without available data are excluded from the ranking.
Citations per year Info Average citations per year since 2021. 106.6 This facility has 52% more citations per year than a typical Florida nursing home (10 vs. FL avg 6.6).↑ 52% worse
Citations per inspection Info Average citations per inspection. 1.51.3 This facility has 15% more citations per inspection than a typical Florida nursing home (1.5 vs. FL avg 1.3).↑ 15% worse Rank #695 / 919 Citations per inspection — State benchmarked This home is ranked 695th out of 919 homes in Florida. Shows this facility's citations per inspection compared to the Florida average among 919 comparable communities in the ranking pool. Rankings are based only on facilities in Florida that report data for that category. Facilities without available data are excluded from the ranking.

Inspections Info State inspections evaluate whether the facility meets health and safety standards.

This FacilityFL Averagevs. FL Avg
Total inspections Info Combined count of all routine and focused inspections. Excludes complaint investigations. 3426 This facility has 31% more total inspections than a typical Florida nursing home (34 vs. FL avg 26).↑ 31% worse
Inspections with citations Info Inspections that resulted in at least one regulatory citation. 2216 This facility has 38% more inspections with citations than a typical Florida nursing home (22 vs. FL avg 16).↑ 38% worse
Inspection citation rate Info Percentage of inspections that resulted in at least one citation. 65%62% This facility has 3 percentage points higher inspection citation rate than a typical Florida nursing home (65% vs. FL avg 62%).↑ 3% worse Rank #600 / 919 Inspection citation rate — State benchmarked This home is ranked 600th out of 919 homes in Florida. Shows this facility's % of inspections with citations compared to the Florida average among 919 comparable communities in the ranking pool. Rankings are based only on facilities in Florida that report data for that category. Facilities without available data are excluded from the ranking.

Inspection Reports Summary Info An editor-reviewed summary of the themes and findings across this facility's recent inspection reports.

  • November 3, 2025 complaint investigation found one Class 3 deficiency for incomplete medication records.
  • February 25, 2025 routine inspection cited 17 deficiencies including failure to assist with eating, wound care, pain management, advance directives, and timely condition notifications.
  • October 29, 2024 annual inspection cited 11 Class 3 deficiencies related to staffing, staff training, records, and background screening compliance.

Health Inspection History

Inspections since 2021
Total health inspections 6

Florida average 4.3


Last Health inspection on Oct 2025

Total health citations
34 Rank #225 / 252Health citations — State benchmarkedThis home is ranked 225th out of 252 homes in Florida. Shows this facility's total health deficiency citations benchmarked to the Florida State average, with a ranking across all 252 FL facilities. Lower citation counts earn a better rank.Rankings are based only on facilities in Florida that report data for that category. Facilities without available data are excluded from the ranking.Click the rank badge to see the full State ranking.Click here to see the full State ranking.

Florida average 19.7

Citations per inspection
5.67 Rank #194 / 252Citations per inspection — State benchmarkedThis home is ranked 194th out of 252 homes in Florida. Shows average deficiency citations per CMS inspection for this facility versus the Florida mean across 252 facilities with citation data. Lower is better.Rankings are based only on facilities in Florida that report data for that category. Facilities without available data are excluded from the ranking.Click the rank badge to see the full State ranking.Click here to see the full State ranking.

Florida average 4.48


Health citations are formal notices following inspections when they fail to comply with safety and care standards.

27 of 34 citations resulted from standard inspections; 5 of 34 resulted from complaint investigations; and 2 of 34 came from combined inspections (standard and complaint).

Breakdown of citation severity (last 5 years)
Critical health citations
0
100% better than Florida average

Florida average: 0.8


Serious health citations
0
100% better than Florida average

Florida average: 0.4

0 critical citations Florida average: 0.8

0 serious citations Florida average: 0.4

34 moderate citations Florida average: 18.4

0 minor citations Florida average: 0.2
Citations history (last 5 years)
Resident Rights moderate citation Oct 20, 2025

Infection Control moderate citation Feb 25, 2025
Corrected

Nutrition moderate citation Feb 25, 2025
Corrected

Pharmacy moderate citation Feb 25, 2025
Corrected

Staffing Data

Reporting period: October 1 – December 31, 2025 (Q4 2025). Source: CMS Payroll-Based Journal report.

Total staff 211
Employees 211
Contractors 0
Staff to resident ratio 1.94 : 1
31% more staff per resident than Florida average
Florida average ratio: 1.47 : 1 Florida average ratio: 1.47 : 1See full Florida ranking
Avg staff/day 80
Average shift 7.3 hours
8% worse than Florida average
Florida average: 7.9 hours Florida average shift: 7.9 hoursSee full Florida ranking
Total staff hours (quarter) 53,789

Nursing staff breakdown

Q4 2025 · Oct 1 – Dec 31 More info This data comes from the CMS Payroll-Based Journal report covering October 1 – December 31, 2025.
Registered Nurse

Manages medical care and health needs.

RN Staff Info All 19 RN Staff are full-time employees. No contractors work on this role. 19
Average shift length Info Average shift length. Calculated as total hours divided by days worked and average staff per day. 9.1 hours
Licensed Practical Nurse

Assists with medical care and medications.

LPN Staff Info All 37 LPN Staff are full-time employees. No contractors work on this role. 37
Average shift length Info Average shift length. Calculated as total hours divided by days worked and average staff per day. 8.8 hours
Certified Nursing Assistant

Helps with daily care and mobility.

CNA Staff Info All 82 CNA Staff are full-time employees. No contractors work on this role. 82
Average shift length Info Average shift length. Calculated as total hours divided by days worked and average staff per day. 7.3 hours

Contractor staffing

Q4 2025 · Oct 1 – Dec 31 More info This data comes from the CMS Payroll-Based Journal report covering October 1 – December 31, 2025.
Total hours from contractors 0% — all staff are direct employees this quarter

Staff by category

Q4 2025 · Oct 1 – Dec 31 More info This data comes from the CMS Payroll-Based Journal report covering October 1 – December 31, 2025.
Certified Nursing Assistant8208221,68392100%7.3
Licensed Practical Nurse370379,25592100%8.8
Physical Therapist300308,85292100%6.6
Registered Nurse190193,0679199%9.1
Physical Therapy Aide100102,38792100%6
Other Dietary Services Staff4041,4759199%7.7
Respiratory Therapy Technician4041,1508491%6.6
Physical Therapy Assistant6061,0328491%4.8
Mental Health Service Worker2021,0016874%7.9
Speech Language Pathologist3038447480%5.6
Clinical Nurse Specialist3037276065%7.8
RN Director of Nursing6065406470%6.3
Dietitian1015206672%7.9
Administrator1015126470%8
Nurse Practitioner1014806065%8
Qualified Social Worker2022656166%3.3
82 Certified Nursing Assistant
% of Days 100%
37 Licensed Practical Nurse
% of Days 100%
30 Physical Therapist
% of Days 100%
19 Registered Nurse
% of Days 99%
10 Physical Therapy Aide
% of Days 100%
4 Other Dietary Services Staff
% of Days 99%
4 Respiratory Therapy Technician
% of Days 91%
6 Physical Therapy Assistant
% of Days 91%
2 Mental Health Service Worker
% of Days 74%
3 Speech Language Pathologist
% of Days 80%
3 Clinical Nurse Specialist
% of Days 65%
6 RN Director of Nursing
% of Days 70%
1 Dietitian
% of Days 72%
1 Administrator
% of Days 70%
1 Nurse Practitioner
% of Days 65%
2 Qualified Social Worker
% of Days 66%

Penalties and fines

Federal penalties imposed by CMS for regulatory violations, including civil money penalties (fines) and denials of payment for new Medicare/Medicaid admissions.

Source: CMS Penalties Database

No penalties in the past 3 years

No civil money penalties or payment denials were reported in the last 3 years.

Quality of care over time

These measures show how residents usually do over time at this home, based on health outcomes and preventive care.

High-risk clinical events score Info A composite score based on pressure ulcers, falls with injury, weight loss, walking ability decline, and activities of daily living decline. 6.9
7% better than Florida average

Florida average: 7.4

Functional decline score Info A composite score based on activities of daily living decline, walking ability decline, and incontinence. 12.6
In line with Florida average

Florida average: 12.4

Long-stay resident measures
Significantly above average Florida avg: 4.5 Info CMS star rating based on long-stay quality measure performance. 5 stars = significantly above average, 1 star = significantly below average.
Need for Help with Daily Activities Increased Info Percent of long-stay residents whose need for help with daily activities has increased 5.9%
44% better than Florida average

Florida average: 10.5%

Walking Ability Worsened Info Percent of long-stay residents whose ability to move independently worsened 9.2%
29% better than Florida average

Florida average: 12.9%

Low Risk Residents with Bowel/Bladder Incontinence Info Percent of low risk long-stay residents who lose control of their bowels or bladder 22.8%
68% worse than Florida average

Florida average: 13.5%

Falls with Major Injury Info Percent of long-stay residents experiencing one or more falls with major injury 5.9%
125% worse than Florida average

Florida average: 2.6%

High Risk Residents with Pressure Ulcers Info Percent of long-stay high risk residents with pressure ulcers 10.3%
92% worse than Florida average

Florida average: 5.4%

Urinary Tract Infection Info Percent of long-stay residents with a urinary tract infection 0.0%
100% better than Florida average

Florida average: 0.9%

Lost Too Much Weight Info Percent of long-stay residents who lose too much weight 3.2%
46% better than Florida average

Florida average: 6.0%

Depressive Symptoms Info Percent of long-stay residents who have depressive symptoms 53.3%
1493% worse than Florida average

Florida average: 3.3%

Antipsychotic Use Info Percent of long-stay residents who received an antipsychotic medication 5.7%
29% better than Florida average

Florida average: 8.0%

Pneumococcal Vaccine Info Percent of long-stay residents assessed and appropriately given the pneumococcal vaccine 100.0%
In line with Florida average

Florida average: 97.7%

Influenza Vaccine Info Percent of long-stay residents assessed and appropriately given the seasonal influenza vaccine 100.0%
In line with Florida average

Florida average: 99.2%

Hospitalizations per 1,000 days Info Number of hospitalizations per 1,000 long-stay resident days. 1.45
31% better than Florida average

Florida average: 2.10

ED visits per 1,000 days Info Number of outpatient emergency department visits per 1,000 long-stay resident days. 1.12
5% better than Florida average

Florida average: 1.18

Short-stay resident measures
Significantly above average Florida avg: 3.1 Info CMS star rating based on short-stay quality measure performance. 5 stars = much above average, 1 star = much below average.
Pneumococcal Vaccine Info Percent of short-stay residents assessed and appropriately given the pneumococcal vaccine 98.4%
5% better than Florida average

Florida average: 94.0%

Antipsychotic medication increase Info Percent of short-stay residents who newly received an antipsychotic medication 0.6%
58% better than Florida average

Florida average: 1.5%

Influenza Vaccine Info Percent of short-stay residents assessed and appropriately given the seasonal influenza vaccine 97.0%
In line with Florida average

Florida average: 94.7%

Re-hospitalized after SNF stay Info Percentage of short-stay residents who were re-hospitalized after their nursing home admission. 21.8%
17% better than Florida average

Florida average: 26.2%

Emergency department visits Info Percentage of short-stay residents who had an outpatient emergency department visit. 8.5%
9% better than Florida average

Florida average: 9.3%

Falls with major injury Info Percentage of SNF residents who experience falls with major injury during their stay. 0.9%
12% worse than Florida average

Florida average: 0.8%

Ability to care for self at discharge Info Percentage of residents at or above expected ability to care for themselves at discharge. 63.8%
19% better than Florida average

Florida average: 53.7%

Successful return to home or community Info Rate of successful return to home or community from a skilled nursing facility. 51.5%
In line with Florida average

Florida average: 50.6%

Breakdown by payment type

Medicare

41% of new residents, usually for short-term rehab.

Typical stay 1 months

Private pay

54% of new residents, often for short stays.

Typical stay 1 - 2 months

Medicaid

5% of new residents, often for long-term daily care.

Typical stay 3 years

Facility Characteristics

Source: CMS Long-Term Care Facility Characteristics (Data as of Jan 2026)

Total residents 109
Medicare
42
38.5% of residents
Medicaid
49
45% of residents
Private pay or other
18
16.5% of residents
Programs & Services
Residents Group

Residents meet regularly to discuss policies, care quality, and activities

CCRC

Part of a Continuing Care Retirement Community offering multiple care levels

Active Resident Council

Organized group of residents that meets regularly to discuss facility policies, quality of life, and activities.

Finances and operations

Based on CMS SNF Cost Report for fiscal year ending in 06/2024.

For-profit
Individual
Net patient revenue Info Net patient revenue — what the home actually collects for resident care, after contractual allowances, bad debt and discounts are subtracted from its gross charges (CMS cost report, Worksheet G-3). It covers resident care only; money the home earns from other sources is shown separately as "Other income."
$13.4M
Net patient income Info Net patient income: net patient revenue minus the home's total operating expenses. A positive figure means it earns more from resident care than it spends to deliver it; a negative figure means the opposite. It excludes non-operating "other income."
-$4.5M
For-profit Individual
Net patient revenue Info Net patient revenue — what the home actually collects for resident care, after contractual allowances, bad debt and discounts are subtracted from its gross charges (CMS cost report, Worksheet G-3). It covers resident care only; money the home earns from other sources is shown separately as "Other income."
$13.4M Rank #193 / 257Revenue — State benchmarkedThis home is ranked 193rd out of 257 homes in Florida. Shows this facility's annual revenue compared to the Florida average. Higher revenue generally means more resources for staffing and capital — read alongside Payroll %.Rankings are based only on facilities in Florida that report data for that category. Facilities without available data are excluded from the ranking.Click the rank badge to see the full State ranking.Click here to see the full State ranking.
Net patient income Info Net patient income: net patient revenue minus the home's total operating expenses. A positive figure means it earns more from resident care than it spends to deliver it; a negative figure means the opposite. It excludes non-operating "other income."
-$4.5M
Other income Info Money the home earns outside of resident care — such as investments, grants, rentals and other non-operating sources (CMS cost report, Worksheet G-3). It is tracked separately from net patient revenue: it is not part of that figure, and it is not included in net patient income.
$128.7K
Payroll costs Info Staff salaries plus wage-related costs — benefits such as payroll taxes, health insurance and retirement — from the home's own accounting records (CMS cost report, Worksheet A). Contract or agency labor is counted separately, under other operating costs. Rank #129 / 257Payroll — State benchmarkedThis home is ranked 129th out of 257 homes in Florida. Shows total annual staff payroll benchmarked to the Florida average. Higher payroll investment relative to peers often signals better staffing and less reliance on cheaper contract labor.Rankings are based only on facilities in Florida that report data for that category. Facilities without available data are excluded from the ranking.Click the rank badge to see the full State ranking.Click here to see the full State ranking.
$7.3M 54.4% of net patient revenue Info Payroll as a share of revenue: staff salaries and wage-related benefits divided by net patient revenue. A higher figure means more of each revenue dollar goes to staff pay. Rank #10 / 257Payroll % — State benchmarkedThis home is ranked 10th out of 257 homes in Florida. Shows payroll as a percentage of revenue versus the Florida average. Well-run Florida facilities typically land around 49–56% — the top third Statewide. Below 25% may signal understaffing or heavy agency use — read with Staffing ratings.Rankings are based only on facilities in Florida that report data for that category. Facilities without available data are excluded from the ranking.Click the rank badge to see the full State ranking.Click here to see the full State ranking.
Other operating costs Info Everything it costs to run the home apart from payroll — food, utilities, supplies, maintenance, contract labor and administration. Calculated as total operating expense minus payroll (staff salaries and wage-related benefits).
$10.6M
Total costs Info The home's total operating expense for the year — all the costs of running it, salaries included (CMS cost report, Worksheet G-3).
$17.8M

What does this home offer?

Housing options icon

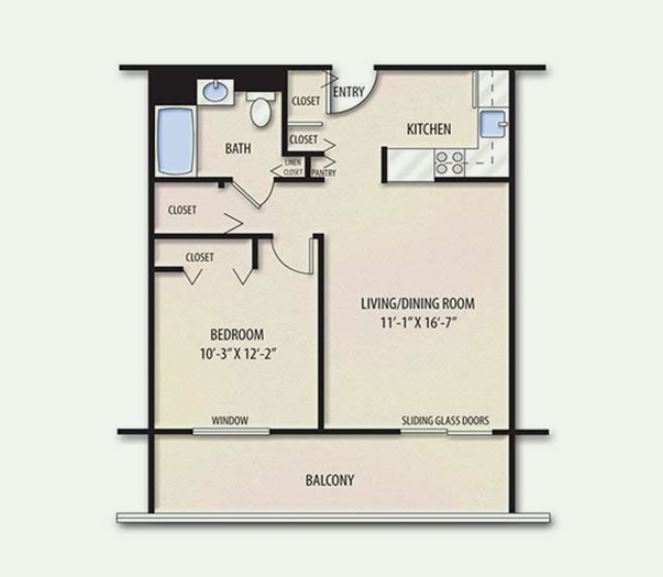
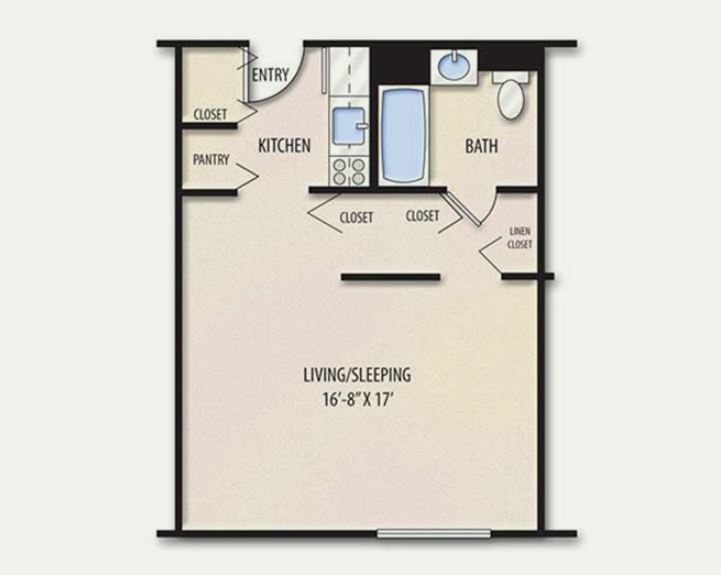
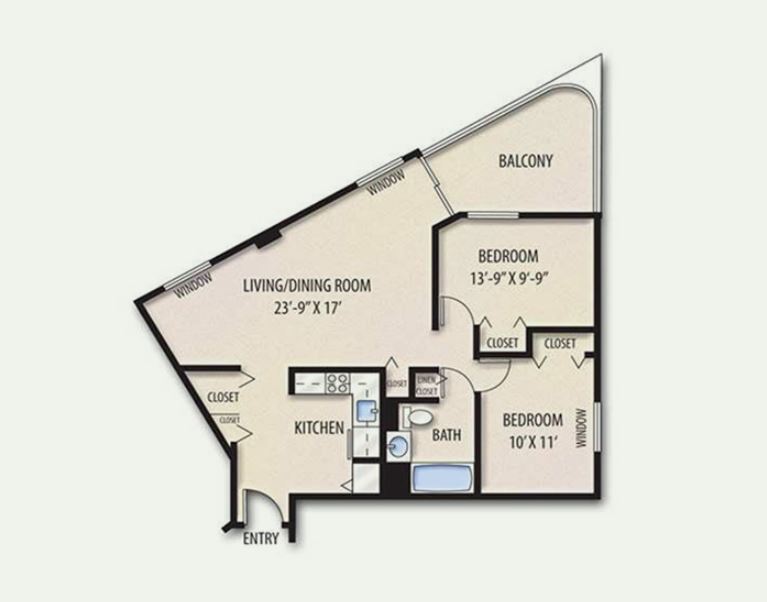
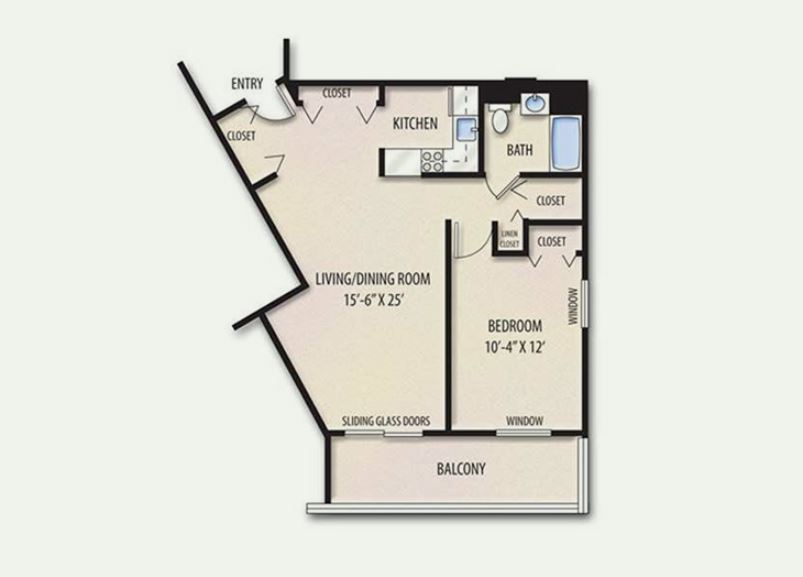
Housing Options: Studio / 1 Bed / 2 Bed

Building type icon
Building type icon

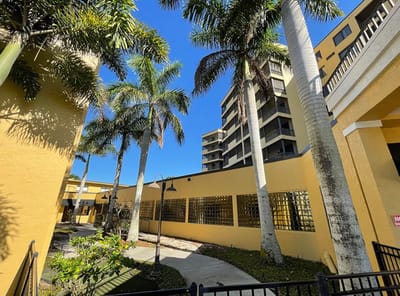
Building Type: Mid-rise

Transportation services icon

Transportation Services

Who this home usually serves

TYPE OF STAY

Mix of rehab and long-term care

This home supports both short-term rehab and long-term care, with residents staying for a wide range of durations.

Most new residents arrive under private pay (54% of admissions), and a typical private pay stay runs around 1 - 2 months.

Admissions
391 total

Coverage residents most often arrive under.

Medicare 41%
Private pay 54%
Medicaid 5%
Discharges
350 total

Coverage residents most often leave under.

Medicare 39%
Private pay 54%
Medicaid 7%

Activities in this home

Living Spaces & Floor Plans for The Palms at Sebring

Places of interest near The Palms at Sebring

Address 0.3 miles from city center Info Estimated distance in miles from Sebring's city center to The Palms at Sebring's address, calculated via Google Maps.

Calculate Travel Distance to The Palms at Sebring

Add your location

Address

Compare Nursing Homes around Sebring

The information below is reported by the Florida Agency for Health Care Administration (AHCA).

3 facilities compared · CMS & FL Dept. of Health data

Vivo Healthcare Sebring
NH
HC
MC
NC
PC
RC
Sebring
104
Facility 104
FL AVG 89
Rank #419 / 1074
65.3%
Facility 65.3%
FL AVG 84.3%
Rank #238 / 258
-23%
3.93
Facility 3.93
FL AVG 4.04
Rank #126 / 253
-46%-3%
$0
Facility $0
FL AVG $78.9k
Rank #1 / 258
-
28
Facility 28
FL AVG 19.7
Rank #198 / 252
4.7
Facility 4.7
FL AVG 4.5
Rank #150 / 252
-82-
51
Facility 51
FL AVG 40
Rank #503 / 1486
Sebring Holdco LLC
$2.7M
Facility $2.7M
FL AVG $15.7M
Rank #254 / 257
$1.6M
Facility $1.6M
FL AVG $6.1M
Rank #256 / 257
61.1%
Facility 61.1%
FL AVG 39.8%
Rank #191 / 257
105352
Lake Placid Health and Rehabilitation Center
NH
MC
RC
Lake Placid
180
Facility 180
FL AVG 89
Rank #56 / 1074
74.6%
Facility 74.6%
FL AVG 84.3%
Rank #209 / 258
-11%
4.51
Facility 4.51
FL AVG 4.04
Rank #57 / 253
-30%+12%
$0
Facility $0
FL AVG $78.9k
Rank #1 / 258
-
34
Facility 34
FL AVG 19.7
Rank #225 / 252
5.7
Facility 5.7
FL AVG 4.5
Rank #194 / 252
1132-
8
Facility 8
FL AVG 40
Rank #1301 / 1486
Lake Placid Operations Holdings LLC
$15.8M
Facility $15.8M
FL AVG $15.7M
Rank #144 / 257
$5.8M
Facility $5.8M
FL AVG $6.1M
Rank #162 / 257
37.1%
Facility 37.1%
FL AVG 39.8%
Rank #163 / 257
105455
The Palms at Sebring
NH
AL
IL
MC
NC
RC
Sebring
141
Facility 141
FL AVG 89
Rank #169 / 1074
--
3.24
Facility 3.24
FL AVG 4.04
Rank #250 / 253
-25%-20%
$0
Facility $0
FL AVG $78.9k
Rank #1 / 258
77
Facility 77
FL AVG 83
Rank #626 / 876
34
Facility 34
FL AVG 19.7
Rank #225 / 252
5.7
Facility 5.7
FL AVG 4.5
Rank #194 / 252
-14-
63
Facility 63
FL AVG 40
Rank #309 / 1486
Senior Living Support Services Inc
$13.4M
Facility $13.4M
FL AVG $15.7M
Rank #193 / 257
$7.3M
Facility $7.3M
FL AVG $6.1M
Rank #129 / 257
54.4%
Facility 54.4%
FL AVG 39.8%
Rank #10 / 257
105037

Financial Assistance for
Nursing Home in Florida

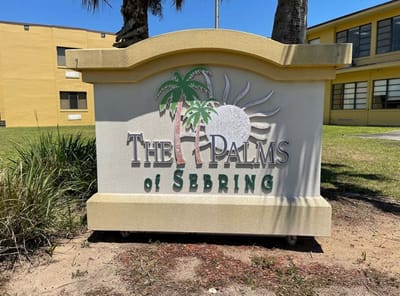
The Palms at Sebring is located in Sebring, Florida.
Here are the financial assistance programs available to residents in Florida.

Get Financial aid guidance

Long-Term Care Waiver

Florida Medicaid LTC Waiver

Age 65+ or 21+ disabled
General Florida resident, Medicaid- eligible, nursing home-level care need.
Income Limits (2025) ~$2,829/month 300% FBR, individual
Asset Limits $2,000 (individual), $3,000 (couple).
FL

High demand; waitlists common.

Benefits
In-home care (6-8 hours/day) Assisted living Respite (240 hours/year) Case management

Community Care for the Elderly (CCE)

Florida CCE

Age 60+
General Florida resident, at risk of nursing home.
Income Limits ~$2,000/month varies
Asset Limits $5,000 individual
FL

Limited funding; regional variation.

Benefits
Homemaker services (3-5 hours/week) Adult day care (~$60/day) Respite (up to 10 days/year)

Home Care for the Elderly (HCE)

Florida Home Care for the Elderly

Age 60+
General Florida resident, at risk of nursing home placement; caregiver must be approved.
Income Limits (2025) ~$2,829/month individual, aligned with Medicaid thresholds
Asset Limits ~$2,000 (individual); varies by case manager discretion.
FL

Limited funding (~3,500 served annually); prioritizes low-income frail seniors.

Benefits
Basic subsidy (~$160/month) for housing/medical costs; special subsidies for supplies/services (e.g., incontinence supplies, ~$50-$200/month)

Program of All-Inclusive Care for the Elderly (PACE)

Florida Medicaid PACE

Age 55+
General Florida resident, nursing home-level care need, safe with PACE support.
Income Limits (2025) ~$2,829/month 300% FBR
Asset Limits $2,000 (individual), $3,000 (couple).
FL

Limited to specific counties (e.g., Hillsborough, Miami-Dade); ~10 sites statewide.

Benefits
Personal care (5-7 hours/day) Medical care Meals Transportation Therapy

Optional State Supplementation (OSS)

Florida Optional State Supplementation

Age 65+ or disabled
General Florida resident, living in approved facility, receiving SSI or low-income.
Income Limits (2025) ~$1,004/month individual, including SSI
Asset Limits $2,000 (individual), $3,000 (couple).
FL

Limited to specific facility types; ~$78.40/month max supplement.

Benefits
Cash payment (~$78.40/month) for room/board or personal needs in facilities

Frequently Asked Questions about The Palms at Sebring

What languages are spoken at The Palms at Sebring?

The team at The Palms at Sebring speaks Creole, English, German, and Spanish.

Who is the owner of The Palms at Sebring?

The Palms at Sebring is legally operated by Pine Street Alf Operations Llc, and administered by Ashley Amundsen.

Is The Palms at Sebring in a walkable area?

The Palms at Sebring has a walk score of 63. Moderately walkable. Some errands can be accomplished on foot, with a mix of nearby amenities.

What is the license number of The Palms at Sebring?

According to FL state health department records, The Palms at Sebring's license number is 4693.

When does The Palms at Sebring's license expire?

According to FL state health department records, The Palms at Sebring's license expires on June 17, 2026.

What is the occupancy rate at The Palms at Sebring?

The Palms at Sebring's occupancy is 82.5%.

What payment types does The Palms at Sebring accept?

The Palms at Sebring accepts Insurance and/or HMO and Medicaid.

Guides for Better Senior Living

Care Cost Calculator: See Prices in Your Area

Nursing Home Data Explorer

Don’t Wait Too Long: 7 Red Flag Signs Your Parent Needs Assisted Living Now

The True Cost of Assisted Living in 2025 – And How Families Are Paying For It

Understanding Senior Living Costs: Pricing Models, Discounts & Financial Assistance