


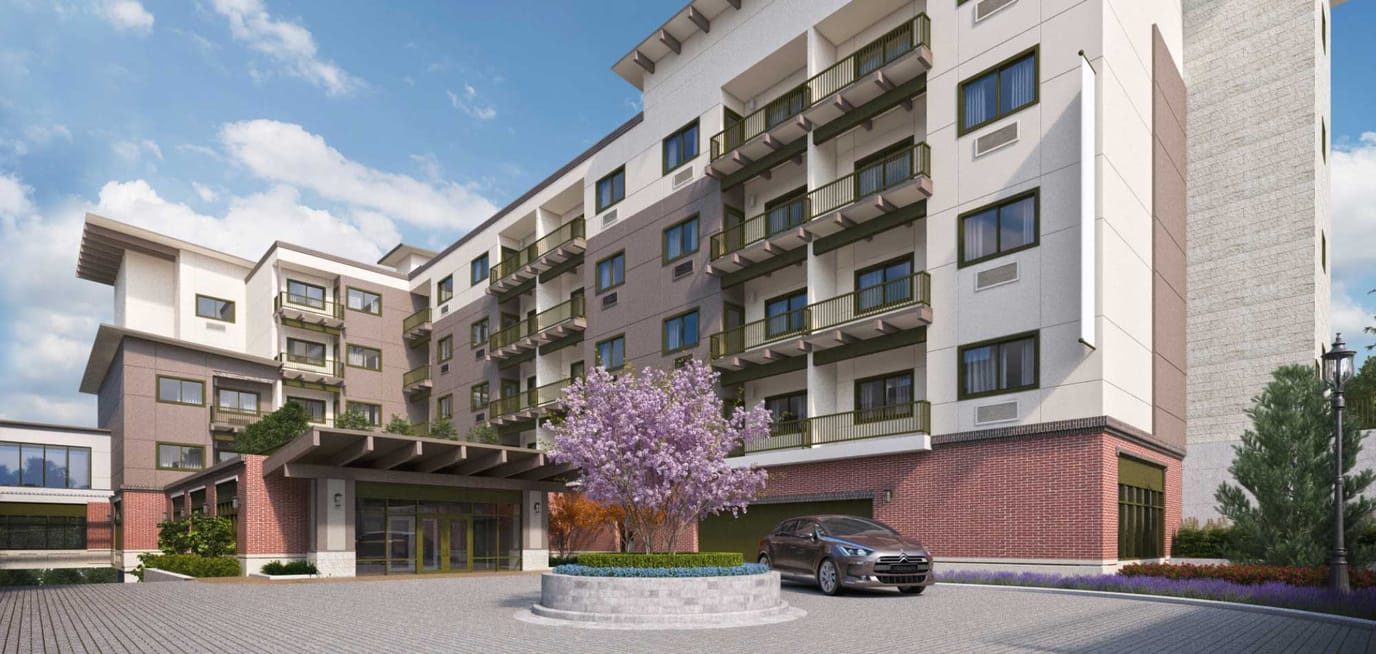
The Park at Belle Harbour Assisted Living Community
Assisted Living, Nursing Home & Independent Living · Bellevue, WA


The Park at Belle Harbour Assisted Living Community
Assisted Living, Nursing Home & Independent Living · Bellevue, WA
The Park at Belle Harbour Assisted Living Community accepts Medicaid.
The Park at Belle Harbour undoubtedly provides the highest care for assisted living seniors in Bellevue. Management makes it a point that seniors are given the freedom and choice given to each resident and ensures that they attend to the unique needs of each individual with kindness and compassion. The premier assisted senior living community is enriched by world-class hospitality and service.
As a Koelsch senior living home, expect luxury and comfort at The Park as the driving forces of the community. Its premier all-inclusive features include ALDs, medication management, transfer assistance, housekeeping, and laundry services tailored to their unique needs.
100-bed community Rank #91 / 355Bed count — State benchmarkedThis home is ranked 91st out of 355 homes in Washington for bed count. Shows this facility's certified or reported bed count compared to other Washington facilities. Larger communities may offer more amenities, programs, and on-site services for residents and families.Facilities with the same value for a metric share the same rank. Rankings are based only on facilities in Washington that report data for that category. Facilities without available data are excluded from the ranking.Click the rank badge to see the full State ranking.Click here to see the full State ranking.
A larger shared setting that may offer more common spaces and organized community services.
Walk Score: 38 / 100 Rank #419 / 626Walk Score — State benchmarkedThis home is ranked 419th out of 626 homes in Washington for walk score. Shows how walkable this facility's neighborhood is compared to the average walk score across Washington facilities. Higher scores benefit residents, families, and staff.Facilities with the same value for a metric share the same rank. Rankings are based only on facilities in Washington that report data for that category. Facilities without available data are excluded from the ranking.Click the rank badge to see the full State ranking.Click here to see the full State ranking.
Somewhat walkable. A few nearby services may be reachable on foot, but most trips require transportation.
About this community
Facility TypeBoarding Home
StatusOperating
ExpirationJuly 31, 2026 Expires in 14 days
CountyKing
License Number2703
Staffing
Key information about the people who lead and staff this community.
ContactPollard, Cynthia (per state records, record updated Jul 2026)
Inspection History
In Washington, the Department of Social and Health Services, Residential Care Services conducts unannounced inspections and issues reports on the quality of care in all licensed settings.
Since 2025 · 1 year of data
2 inspections
Inspection Scorecard
 This scorecard compares key inspection, deficiency, and complaint metrics at this facility against the Washington state average. Metrics rated ≥15% worse than average are highlighted in red; those ≥15% better are highlighted in green.
Since 2025 vs. Washington state average
Overall vs. WA average
0 Worse
No metrics in this bucket.
0 Better
No metrics in this bucket.
Inspections
| This Facility | WA Average | vs. WA Avg |
|---|---|---|---|
|
Total inspections
| 2 | 9 | This facility has had 78% fewer total inspections than the Washington average (2 vs. WA avg 9). More inspections can mean more regulatory scrutiny rather than worse care.↓ 78% fewer |
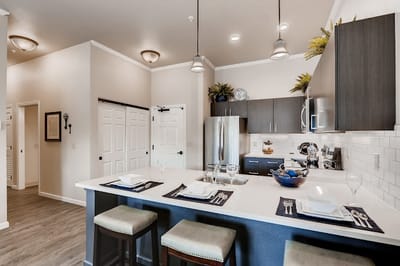
What does this home offer?
Pets Allowed
Housing Options: Studio / 1 Bed / 2 Bed
Building Type: Mid-rise
Transportation Services
Housekeeping Services
Social and Recreational Activities
Security Systems
Places of interest near The Park at Belle Harbour Assisted Living Community
![]() 2.1 miles from city center
2.1 miles from city center
![]() Estimated distance in miles from Bellevue's city center to The Park at Belle Harbour Assisted Living Community's address, calculated via Google Maps.
— 0.81 miles to nearest hospital (Kaiser Permanente Bellevue Medical Center)
Estimated distance in miles from Bellevue's city center to The Park at Belle Harbour Assisted Living Community's address, calculated via Google Maps.
— 0.81 miles to nearest hospital (Kaiser Permanente Bellevue Medical Center)
Calculate Travel Distance to The Park at Belle Harbour Assisted Living Community
Add your location
Financial Assistance for
Assisted Living in Washington
The Park at Belle Harbour Assisted Living Community is located in Bellevue, Washington State.
Here are the financial assistance programs available to residents in Washington State.
Frequently Asked Questions about The Park at Belle Harbour Assisted Living Community
What neighborhood is The Park at Belle Harbour Assisted Living Community in?
The Park at Belle Harbour Assisted Living Community is in the Wilburton neighborhood of Bellevue.
Is The Park at Belle Harbour Assisted Living Community in a walkable area?
The Park at Belle Harbour Assisted Living Community has a walk score of 38. Somewhat walkable. A few nearby services may be reachable on foot, but most trips require transportation.
What is the license number of The Park at Belle Harbour Assisted Living Community?
According to WA state health department records, The Park at Belle Harbour Assisted Living Community's license number is 2703.
When does The Park at Belle Harbour Assisted Living Community's license expire?
According to WA state health department records, The Park at Belle Harbour Assisted Living Community's license expires on July 31, 2026.
Are pets allowed at The Park at Belle Harbour Assisted Living Community?
Yes, The Park at Belle Harbour Assisted Living Community allows residents to bring their pets.
How many beds does The Park at Belle Harbour Assisted Living Community have?
The Park at Belle Harbour Assisted Living Community has 100 beds.
Are there photos of The Park at Belle Harbour Assisted Living Community?
Yes — there are 4 photos of The Park at Belle Harbour Assisted Living Community in the photo gallery on this page.
Guides for Better Senior Living
Care Cost Calculator: See Prices in Your Area
Nursing Home Data Explorer
Don’t Wait Too Long: 7 Red Flag Signs Your Parent Needs Assisted Living Now
The True Cost of Assisted Living in 2025 – And How Families Are Paying For It
Understanding Senior Living Costs: Pricing Models, Discounts & Financial Assistance
Updated on
