The Pearl of Elk Grove
Nursing Home & Respite Care · Schaumburg, IL
CMS overall rating Info The Overall CMS Rating is scored from 1 to 5 stars and combines results from health inspections, staffing levels, and quality measures. Health inspections carry the most weight. Staffing and quality scores can increase or decrease the final rating based on performance compared to state and national standards.

The Pearl of Elk Grove

Nursing Home & Respite Care · Schaumburg, IL
CMS overall rating Info The Overall CMS Rating is scored from 1 to 5 stars and combines results from health inspections, staffing levels, and quality measures. Health inspections carry the most weight. Staffing and quality scores can increase or decrease the final rating based on performance compared to state and national standards.
Calculator: See prices in your area
The Pearl of Elk Grove accepts Medicare, Medicaid, and private pay.

Overview of The Pearl of Elk Grove

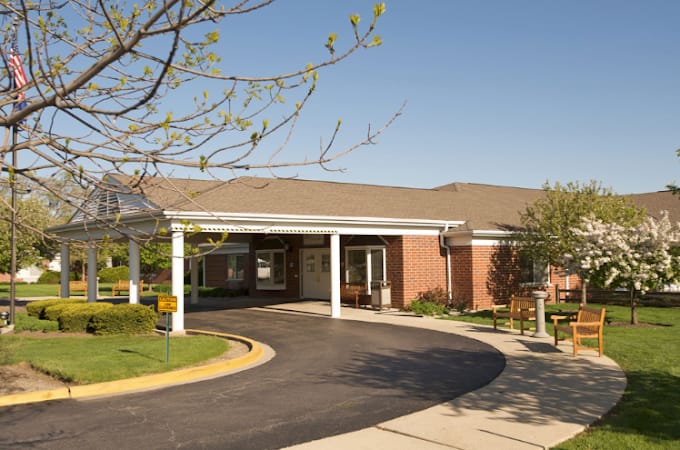
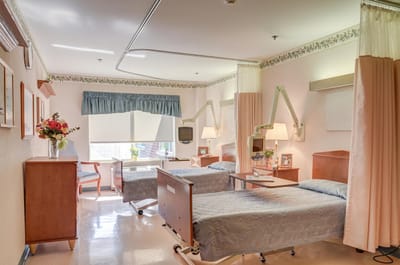
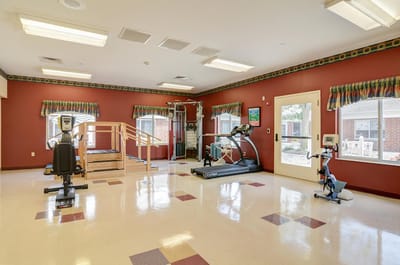
The Pearl of Elk Grove is a nursing home in Elk Grove Village, IL, offering long-term care, post-hospital care, respite care, and rehabilitation. Here, older adults can feel at home, accompanied by a nurturing and welcoming environment. With 24-hour care, restaurant-style dining, housekeeping, and laundry, residents receive the utmost attention and care to live comfortably. Along with a highly trained team, personalized care plans are also provided to help residents recover and return to their routines with ease.

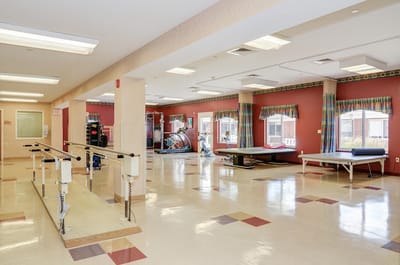
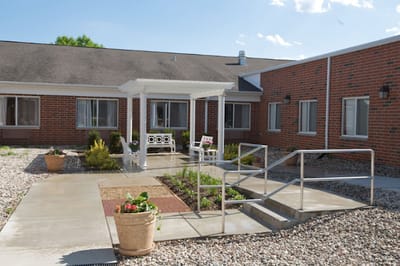
Fun events, light exercises, and games encourage residents to explore new hobbies and gain meaningful experiences. Spacious therapy gym and serene outdoors also ensure residents can rest and focus on their wellness. Surrounded by shops, a church, and restaurants in the lively residential area of Elk Grove Village, the community guarantees a convenient lifestyle. This nursing home has high standards of care, making it one of the trusted options for senior living in Illinois.

(847) 301-0550

Quality ratings

Measured by Centers for Medicare & Medicaid Services (CMS)

Overall rating Info The Overall CMS Rating combines results from health inspections, staffing levels and quality measures. Health inspections carry the most weight. Staffing and quality scores can increase or decrease the final rating based on performance compared to state and national standards.
▼ 60.3% Below IL avg. ▼ 60.3% Below IL avg.Click the badge to see the full State ranking.Click here to see the full State ranking.
Health Inspection Info Based on the results of the facility's three most recent standard inspections and any complaint investigations. CMS reviews the number, scope, and severity of deficiencies, with more recent findings weighted more heavily.
▼ 64.0% Below IL avg. ▼ 64.0% Below IL avg.Click the badge to see the full State ranking.Click here to see the full State ranking.
Staffing Info Measures average nursing staff hours per resident per day, including Registered Nurses (RNs) and total nursing staff. Ratings are adjusted based on the level of care residents require and are compared to state and national benchmarks.
▼ 6.4% Below IL avg. ▼ 6.4% Below IL avg.Click the badge to see the full State ranking.Click here to see the full State ranking.
Quality Measures Info Based on clinical and physical health indicators reported to CMS, such as hospital readmissions, falls, pressure ulcers, and improvements in mobility. These measures reflect how well residents' health needs are being managed.
▲ 42.1% Above IL avg. ▲ 42.1% Above IL avg.Click the badge to see the full State ranking.Click here to see the full State ranking.

Staffing hours breakdown

Info Daily nursing hours per resident by staff type, reported to CMS. Higher is generally better — compare this facility to state and national averages to see where staffing stands.

Hours per resident per day — compared to Illinois state averages

Total nursing care / resident Info This home is ranked 75th out of 129 homes in Illinois.

Total adjusted nursing hours per resident per day, combining RN, LPN, and aide time. CMS adjusts this for case-mix so facilities can be fairly compared.
2h 49m per day
Rank #75 / 129Nurse hours — State benchmarkedThis home is ranked 75th out of 129 homes in Illinois.Shows adjusted nurse hours per resident per day benchmarked to the Illinois average, with a ranking across 129 Illinois SNFs. More hours mean more direct care. The national average is about 3.5 hrs; below 3.0 is a red flag.Click the rank badge to see the full State ranking.Click here to see the full State ranking.
This facility Illinois avg (3h 6m per day)
vs Illinois avg
-9%
Staff typeHours / Day / Residentvs state avg
Total Nursing (Weekend) Info Combined nursing hours (RN + LPN + Nurse Aide) per resident per day on weekends. Staffing often drops on weekends — this figure reveals whether the facility maintains adequate coverage outside of weekday hours. 3h 4m per day

Capacity and availability

This home usually has availability

Occupancy lower than 85% suggests more openings may be available.

Higher occupancy than the Illinois average: 69.3%
Occupancy rate 74.6% Rank #67 / 129Occupancy rate — State benchmarkedThis home is ranked 67th out of 129 homes in Illinois.Shows this facility's occupancy rate versus the Illinois average, with its Statewide rank out of 129. Higher occupancy signals strong local demand and financial stability.Click the rank badge to see the full State ranking.Click here to see the full State ranking.
Avg. Length of Stay 141 days
Occupancy rate
74.6% Rank #67 / 129Occupancy rate — State benchmarkedThis home is ranked 67th out of 129 homes in Illinois.Shows this facility's occupancy rate versus the Illinois average, with its Statewide rank out of 129. Higher occupancy signals strong local demand and financial stability.Click the rank badge to see the full State ranking.Click here to see the full State ranking.
Avg. Length of Stay
141 days

Who this home usually serves

TYPE OF STAY

Mostly short-term rehab stays

Most residents typically stay for a few weeks or months before returning home or moving on.

Breakdown by payment type

Medicare

59% of new residents, usually for short-term rehab.

Typical stay 26 days

Private pay

6% of new residents, often for short stays.

Typical stay 1 years

Medicaid

35% of new residents, often for long-term daily care.

Typical stay 9 - 10 months

Finances and operations

Privately-owned community
Home revenue
$13.4M
Operating loss
-$759.0K
Privately-owned community
Home revenue
$13.4M Rank #77 / 127Revenue — State benchmarkedThis home is ranked 77th out of 127 homes in Illinois.Shows this facility's annual revenue compared to the Illinois SNF average. Higher revenue generally means more resources for staffing and capital — read alongside Payroll %.Click the rank badge to see the full State ranking.Click here to see the full State ranking.
Operating loss
-$759.0K
Payroll costs Info The portion of the home's budget spent on staff, including nurses, caregivers, and other employees who support care and operations. Rank #98 / 127Payroll — State benchmarkedThis home is ranked 98th out of 127 homes in Illinois.Shows total annual staff payroll benchmarked to the Illinois average. Higher payroll investment relative to peers often signals better staffing and less reliance on cheaper contract labor.Click the rank badge to see the full State ranking.Click here to see the full State ranking.
$5.6M
41.6% of revenue Rank #87 / 127Payroll % — State benchmarkedThis home is ranked 87th out of 127 homes in Illinois.Shows payroll as a percentage of revenue versus the Illinois average. Well-run Illinois SNFs typically land around 54–67% — the top third Statewide. Below 25% may signal understaffing or heavy agency use — read with Staffing ratings.Click the rank badge to see the full State ranking.Click here to see the full State ranking.
Other operating costs Info All remaining costs needed to run the home, such as food, utilities, building maintenance, supplies and administrative expenses.
$14.3M
Total costs $19.9M
Walk Score
Walk Score: 63 / 100 Rank #50 / 130Walk Score — State benchmarkedThis home is ranked 50th out of 130 homes in Illinois.Shows how walkable this facility's neighborhood is compared to the average Walk Score across Illinois SNFs. Higher scores benefit residents, families, and staff.Click the rank badge to see the full State ranking.Click here to see the full State ranking.
Moderately walkable. Some errands can be accomplished on foot, with a mix of nearby amenities.

What does this home offer?

Building type icon
Building type icon

Building Type: Single-story

On-site medical care and health services icon

On-site Medical Care and Health Services

Rehabilitative support icon

Rehabilitative Support

Types of Care at The Pearl of Elk Grove

Nursing Home Respite Care

Contact The Pearl of Elk Grove

Health Inspection History

Inspections Since 2023
Total health inspections 27

Illinois average 10.4


Last Health inspection on Jul 2025

Total health citations
80 Rank #120 / 128Health citations — State benchmarkedThis home is ranked 120th out of 128 homes in Illinois.Shows this facility's total health deficiency citations benchmarked to the Illinois State average, with a ranking across all 128 IL SNFs. Lower citation counts earn a better rank.Click the rank badge to see the full State ranking.Click here to see the full State ranking.

Illinois average 36.8

Citations per inspection
2.96 Rank #33 / 128Citations per inspection — State benchmarkedThis home is ranked 33rd out of 128 homes in Illinois.Shows average deficiency citations per CMS inspection for this facility versus the Illinois mean across 128 SNFs with citation data. Lower is better.Click the rank badge to see the full State ranking.Click here to see the full State ranking.

Illinois average 3.68


Health citations are formal notices following inspections when they fail to comply with safety and care standards.

31 of 80 citations resulted from standard inspections; and 49 of 80 resulted from complaint investigations.

Breakdown of citation severity (last 3 years)
Critical Health citations
2
186% worse than Illinois average

Illinois average: 0.7


Serious Health citations
9 Rank #87 / 100Serious citations (G–I) — State benchmarkedThis home is ranked 87th out of 100 homes in Illinois.Shows G–I scope serious health citations for this facility versus other Illinois SNFs. Lower counts rank better.Click the rank badge to see the full State ranking.Click here to see the full State ranking.
150% worse than Illinois average

Illinois average: 3.6

2 critical citations Illinois average: 0.7

9 serious citations Illinois average: 3.6

69 moderate citations Illinois average: 32

0 minor citations Illinois average: 0.5
Citations history (last 3 years)
Quality of Care moderate citation Jul 30, 2025
Corrected

Abuse/Neglect serious citation Jun 04, 2025
Corrected

Abuse/Neglect moderate citation May 08, 2025
Corrected

Pharmacy moderate citation Apr 01, 2025
Corrected

Financial Assistance for
Nursing Home in Illinois

The Pearl of Elk Grove is located in Elk Grove Village, Illinois.
Here are the financial assistance programs available to residents in Illinois.

Get Financial aid guidance

Community Care Program

Illinois CCP

Age 60+
General Illinois resident, at risk of nursing home placement.
Income Limits (2025) ~$1,215/month individual
Asset Limits $17,500 individual, excludes home, car
IL

High demand in urban areas; waitlists possible.

Benefits
In-home care (3-5 hours/day) Adult day services ($65/day) Emergency home response systems ($30/month)

Illinois Respite Program

IL Respite (via NFCSP)

Age Caregiver of someone 60+ (or with dementia)
General Illinois resident.
Income Limits No strict limit; prioritizes low-income.
Asset Limits Not applicable.
IL

Limited slots; urban/rural balance.

Benefits
In-home respite (4-6 hours/day) Adult day care (~$65/day) Short-term facility care (up to 5 days)

Supportive Living Program (SLP)

Illinois Medicaid Supportive Living Program

Age 65+ or 22-64 with disability
General Illinois resident, Medicaid-eligible, needs moderate assistance (not nursing home-level).
Income Limits (2025) ~$2,829/month (300% FBR, individual); QIT allowed.
Asset Limits $2,000 (individual), $3,000 (couple) (excludes home, car).
IL

~200 SLP sites statewide; room/board not covered.

Benefits
Personal care (5-7 hours/day, e.g., bathing, mobility) Meals Housekeeping Medication management Respite (~240 hours/year)

Persons Who Are Elderly Waiver

Illinois Medicaid Elderly Waiver

Age 65+
General Illinois resident, Medicaid-eligible, nursing home-level care need.
Income Limits (2025) ~$2,829/month 300% FBR, individual
Asset Limits $2,000 (individual), $3,000 (couple).
IL

Part of HealthChoice Illinois; consumer-directed options available.

Benefits
Personal care (5-7 hours/day, e.g., dressing, eating) Homemaker Adult day care (~$60/day) Respite (240 hours/year) Home mods ($1,000 avg.)

Medicare Savings Program (MSP)

Illinois Medicare Savings Program

Age 65+ or disabled
General Illinois resident, Medicare Part A/B.
Income Limits (2025) ~$2,510/month (QMB), ~$3,380/month (SLMB), ~$3,598/month (QI)—individual.
Asset Limits $9,430 (individual), $14,130 (couple).
IL

Three tiers; no waitlist.

Benefits
Covers Part B premiums ($174.70/month) Deductibles ($240/year) Copays (~20%)

Optional State Supplementation (OSS)

Illinois Optional State Supplementation

Age 65+ or disabled
General Illinois resident, in approved facility, SSI recipient or low-income.
Income Limits (2025) ~$1,004/month including SSI
Asset Limits $2,000 (individual), $3,000 (couple).
IL

~$50-$500/month based on facility type.

Benefits
Cash (~$50-$500/month) for room/board in personal care homes or SLFs

VA Aid and Attendance (A&A) and Housebound Benefits

Illinois VA Aid and Attendance/Housebound

Age 65+ or disabled veteran/spouse
General Illinois resident, wartime service, need for ADL help (A&A) or homebound.
Income Limits (2025) Net income < ~$1,984/month (veteran with dependent, A&A); pension offsets income.
Asset Limits ~$155,356 net worth limit
IL

High veteran demand in urban/rural areas.

Benefits
Cash (~$1,433-$2,642/month veteran, ~$951-$1,318 spouse) for care costs (e.g., in-home, assisted living)

Places of interest near The Pearl of Elk Grove

Address 5.6 miles from city center Info Estimated distance in miles from Elk Grove Village's city center to The Pearl of Elk Grove's address, calculated via Google Maps.

Calculate Travel Distance to The Pearl of Elk Grove

Add your location

Address

Staffing Data

Reporting period: April 1 – June 30, 2025 (Q2 2025). Source: CMS Payroll-Based Journal report.

Total staff 425
Employees 126
Contractors 299
Staff to resident ratio 2.93:1
54% better than Illinois average
Illinois average ratio: 1.90:1 Illinois average ratio: 1.90:1See full Illinois ranking
Avg staff/day 74
Average shift 7.6 hours
0% compared with Illinois average
Illinois average: 7.6 hours Illinois average shift: 7.6 hoursSee full Illinois ranking
Total staff hours (quarter) 51,081

Nursing staff breakdown

Q2 2025 · Apr 1 – Jun 30 More info This data comes from the CMS Payroll-Based Journal report covering April 1 – June 30, 2025.
Registered Nurse

Manages medical care and health needs.

Total count 70
Average shift length Info Average shift length. Calculated as total hours divided by days worked and average staff per day. 7.8 hours

This role is partially covered by contractors.

Licensed Practical Nurse

Assists with medical care and medications.

Total count 76
Average shift length Info Average shift length. Calculated as total hours divided by days worked and average staff per day. 7.9 hours

This role is partially covered by contractors.

Certified Nursing Assistant

Helps with daily care and mobility.

Total count 246
Average shift length Info Average shift length. Calculated as total hours divided by days worked and average staff per day. 7.6 hours

This role is partially covered by contractors.

Contractor staffing

Q2 2025 · Apr 1 – Jun 30 More info This data comes from the CMS Payroll-Based Journal report covering April 1 – June 30, 2025.

Total hours from contractors

19.3%

9,866 contractor hours this quarter

Certified Nursing Assistant: 176 Licensed Practical Nurse: 58 Registered Nurse: 43 Physical Therapy Aide: 6 Speech Language Pathologist: 5 Physical Therapy Assistant: 4 Respiratory Therapy Technician: 3 Qualified Social Worker: 3 Clinical Nurse Specialist: 1

Staff by category

Q2 2025 · Apr 1 – Jun 30 More info This data comes from the CMS Payroll-Based Journal report covering April 1 – June 30, 2025.
Certified Nursing Assistant7017624624,91591100%7.6
Registered Nurse27437010,73791100%7.8
Licensed Practical Nurse1858768,20091100%7.9
Other Dietary Services Staff4041,52991100%8.1
Mental Health Service Worker2029206774%7.2
Respiratory Therapy Technician0338067886%6.7
Physical Therapy Assistant0445358189%5.5
Clinical Nurse Specialist1124966268%7.8
Speech Language Pathologist0554776369%6.7
Administrator1014736369%7.5
Nurse Practitioner1014395965%7.4
RN Director of Nursing1014285763%7.5
Physical Therapy Aide0664256571%5.5
Dietitian1013985358%7.5
Qualified Social Worker0333064752%6.4
246 Certified Nursing Assistant
% of Days 100%
70 Registered Nurse
% of Days 100%
76 Licensed Practical Nurse
% of Days 100%
4 Other Dietary Services Staff
% of Days 100%
2 Mental Health Service Worker
% of Days 74%
3 Respiratory Therapy Technician
% of Days 86%
4 Physical Therapy Assistant
% of Days 89%
2 Clinical Nurse Specialist
% of Days 68%
5 Speech Language Pathologist
% of Days 69%
1 Administrator
% of Days 69%
1 Nurse Practitioner
% of Days 65%
1 RN Director of Nursing
% of Days 63%
6 Physical Therapy Aide
% of Days 71%
1 Dietitian
% of Days 58%
3 Qualified Social Worker
% of Days 52%

Facility Characteristics

Source: CMS Long-Term Care Facility Characteristics (Data as of Jan 2026)

Total residents 145
Medicare
9
6.2% of residents
Medicaid
99
68.3% of residents
Private pay or other
37
25.5% of residents
Programs & Services
Residents Group

Residents meet regularly to discuss policies, care quality, and activities

Active Resident Council

Organized group of residents that meets regularly to discuss facility policies, quality of life, and activities.

Quality of care over time

These measures show how residents usually do over time at this home, based on health outcomes and preventive care.

High-risk clinical events score Info A composite score based on pressure ulcers, falls with injury, weight loss, walking ability decline, and activities of daily living decline. 6.5
33% better than Illinois average

Illinois average: 9.7

Functional decline score Info A composite score based on activities of daily living decline, walking ability decline, and incontinence. 12.3
34% better than Illinois average

Illinois average: 18.6

Long-stay resident measures
Need for Help with Daily Activities Increased Info Percent of long-stay residents whose need for help with daily activities has increased 8.1%
48% better than Illinois average

Illinois average: 15.5%

Walking Ability Worsened Info Percent of long-stay residents whose ability to move independently worsened 9.9%
46% better than Illinois average

Illinois average: 18.4%

Low Risk Residents with Bowel/Bladder Incontinence Info Percent of low risk long-stay residents who lose control of their bowels or bladder 18.8%
13% better than Illinois average

Illinois average: 21.6%

Falls with Major Injury Info Percent of long-stay residents experiencing one or more falls with major injury 2.3%
33% better than Illinois average

Illinois average: 3.4%

High Risk Residents with Pressure Ulcers Info Percent of long-stay high risk residents with pressure ulcers 5.3%
In line with Illinois average

Illinois average: 5.3%

Urinary Tract Infection Info Percent of long-stay residents with a urinary tract infection 1.0%
46% better than Illinois average

Illinois average: 1.8%

Lost Too Much Weight Info Percent of long-stay residents who lose too much weight 7.0%
7% worse than Illinois average

Illinois average: 6.5%

Depressive Symptoms Info Percent of long-stay residents who have depressive symptoms 90.2%
88% worse than Illinois average

Illinois average: 48.1%

Antipsychotic Use Info Percent of long-stay residents who received an antipsychotic medication 20.3%
In line with Illinois average

Illinois average: 20.2%

Pneumococcal Vaccine Info Percent of long-stay residents assessed and appropriately given the pneumococcal vaccine 92.3%
In line with Illinois average

Illinois average: 89.2%

Influenza Vaccine Info Percent of long-stay residents assessed and appropriately given the seasonal influenza vaccine 92.7%
In line with Illinois average

Illinois average: 91.6%

Short-stay resident measures
Pneumococcal Vaccine Info Percent of short-stay residents assessed and appropriately given the pneumococcal vaccine 56.8%
17% worse than Illinois average

Illinois average: 68.3%

Antipsychotic medication increase Info Percent of short-stay residents who newly received an antipsychotic medication 2.1%
11% better than Illinois average

Illinois average: 2.3%

Influenza Vaccine Info Percent of short-stay residents assessed and appropriately given the seasonal influenza vaccine 49.2%
22% worse than Illinois average

Illinois average: 63.0%

Penalties and fines

Federal penalties imposed by CMS for regulatory violations, including civil money penalties (fines) and denials of payment for new Medicare/Medicaid admissions.

Source: CMS Penalties Database (Data as of Jan 2026)

Total fines amount $159K Rank #101 / 129Federal fines — State benchmarkedThis home is ranked 101st out of 129 homes in Illinois.Shows this facility's cumulative CMS federal fine dollars versus the Illinois average among facilities with fines, and where it ranks among 129 skilled nursing facilities in the pool. Lower total dollars mean a better rank.Click the rank badge to see the full State ranking.Click here to see the full State ranking.
11% higher than Illinois average

Illinois average: $143K

Number of fines 7
136% more fines than Illinois average

Illinois average: 3.0

Payment Denials Info Serious action where Medicare and/or Medicaid temporarily stops payments for new residents until issues are fixed. 1
6% fewer payment denials than Illinois average

Illinois average: 1.1

Fines amount comparison
This facility $159K
Illinois average $143K
Penalty History

Penalties are imposed by CMS for violations of federal nursing home regulations.

8 penalties in the past 3 years

Multiple penalties were reported in the last 3 years.

Civil Money Penalty Info Fines imposed for noncompliance, which can be assessed per day or per instance of violation. Jun 4, 2025
$29K
Civil Money Penalty Info Fines imposed for noncompliance, which can be assessed per day or per instance of violation. Sep 26, 2024
$59K
Civil Money Penalty Info Fines imposed for noncompliance, which can be assessed per day or per instance of violation. Jul 11, 2024
$14K
Payment Denial Info Serious action where Medicare and/or Medicaid temporarily stops payments for new residents until issues are fixed. Jul 11, 2024
20 days

Last updated: Jan 2026

Compare Nursing Home around Schaumburg

The information below is reported by the Illinois Department of Public Health, Office of Health Care Regulation.

3 facilities compared · CMS & IL Dept. of Health data

Filter by care type
Encore Village of Schaumburg
NH

Nursing Home Licensed facility providing 24/7 skilled nursing care for residents with complex, ongoing medical needs. Staffed by RNs, LPNs, and CNAs. Inspected and star-rated annually by CMS. Accepts Medicare (short-term rehab) and Medicaid (long-term care).

AL

Assisted Living A licensed, long-term care setting for seniors or individuals with disabilities who need help with daily activities — like bathing, dressing, and medication management — but not 24-hour skilled nursing. Offers housing, meals, and around-the-clock support while aiming to maximize resident independence.

IL

Independent Living Lifestyle-focused communities for older adults offering dining, activities, and transportation with minimal personal care. Best for active, independent seniors who want community without medical support.

MC

Memory Care Secured, specialized care for people living with Alzheimer's or dementia. Staff trained in cognitive impairment, with higher staff-to-resident ratios and an environment designed to reduce confusion and wandering risk.

Schaumburg109 55.4% -20%3.46 +22%+12%$25.5k282.62114A+ 58 Il Ccrc, LLC$96.9M$18.2M18.8%145341
Bella Terra Schaumburg
NH

Nursing Home Licensed facility providing 24/7 skilled nursing care for residents with complex, ongoing medical needs. Staffed by RNs, LPNs, and CNAs. Inspected and star-rated annually by CMS. Accepts Medicare (short-term rehab) and Medicaid (long-term care).

MC

Memory Care Secured, specialized care for people living with Alzheimer's or dementia. Staff trained in cognitive impairment, with higher staff-to-resident ratios and an environment designed to reduce confusion and wandering risk.

Schaumburg214 73.2% +6%2.79 +49%-10%$164.3k416.84155- 66 Jason Lee$31.1M$11.1M35.7%145678
The Pearl of Elk Grove
NH

Nursing Home Licensed facility providing 24/7 skilled nursing care for residents with complex, ongoing medical needs. Staffed by RNs, LPNs, and CNAs. Inspected and star-rated annually by CMS. Accepts Medicare (short-term rehab) and Medicaid (long-term care).

RC

Respite Care Short-term temporary care — days to weeks — to give family caregivers a break. Full care provided during the stay. Often used after hospitalization or to trial a facility before a permanent placement decision.

Elk Grove Village190 74.6% +8%2.82 +17%-9%$130.1k803.011146- 63 Elk Grove Holding Company, LLC$13.4M$5.6M41.6%145689

Guides for Better Senior Living

Care Cost Calculator: See Prices in Your Area

Nursing Home Data Explorer

Don’t Wait Too Long: 7 Red Flag Signs Your Parent Needs Assisted Living Now

The True Cost of Assisted Living in 2025 – And How Families Are Paying For It

Understanding Senior Living Costs: Pricing Models, Discounts & Financial Assistance

Frequently Asked Questions about The Pearl of Elk Grove

Is The Pearl of Elk Grove in a walkable area?

The Pearl of Elk Grove has a walk score of 63. Moderately walkable. Some errands can be accomplished on foot, with a mix of nearby amenities.

What is the occupancy rate at The Pearl of Elk Grove?

The Pearl of Elk Grove's occupancy is 74.6%.

What is the address of The Pearl of Elk Grove?

The Pearl of Elk Grove is located at 1920 Nerge Rd, Elk Grove Village, IL 60007.

What is the phone number of The Pearl of Elk Grove?

(847) 301-0550 will put you in contact with the team at The Pearl of Elk Grove.

Is The Pearl of Elk Grove Medicare or Medicaid certified?

Yes — The Pearl of Elk Grove is a CMS-certified provider of Medicare and Medicaid.

Explore Open Rooms
1 Contact details
2 What type of senior care service are you looking for?
3 What budget do you have in mind for senior care?
4 How soon do you need to find care?
5 Additional details

Thank you for your interest!

Our team will be in touch shortly to help with next steps.