


Total staff
546
Employees
452
Contractors
94
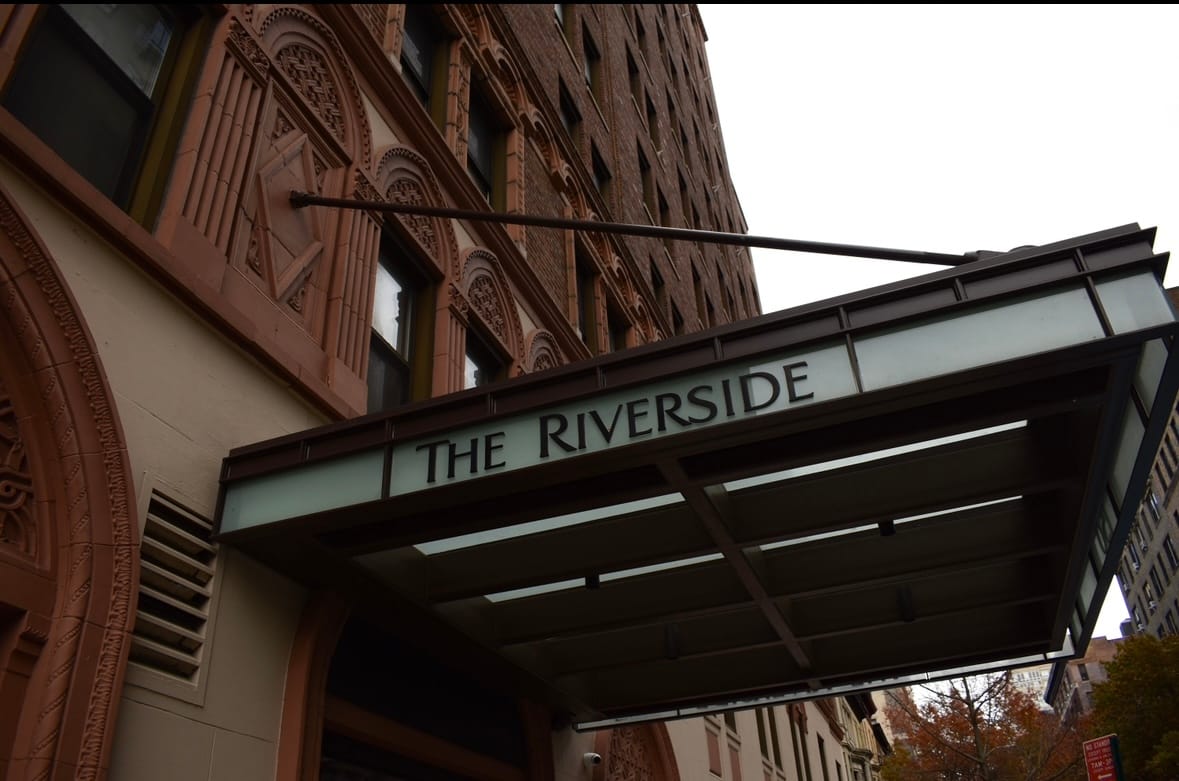
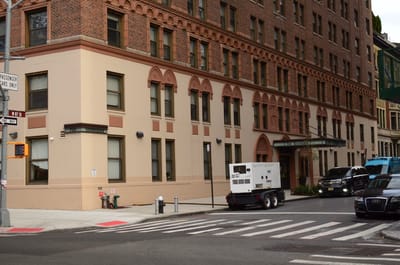
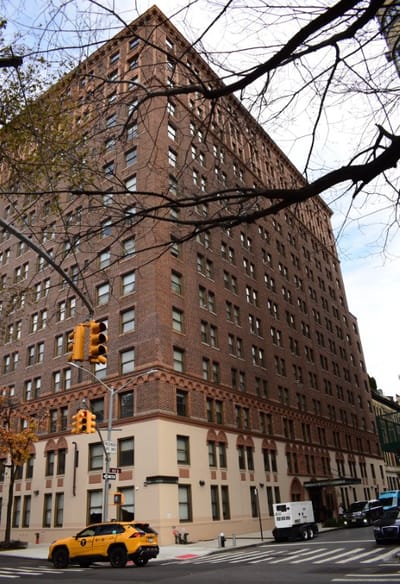
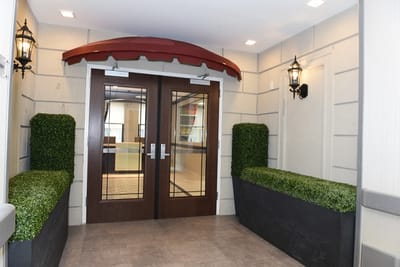

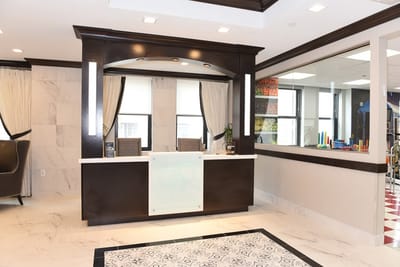
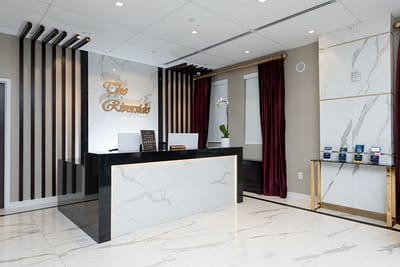


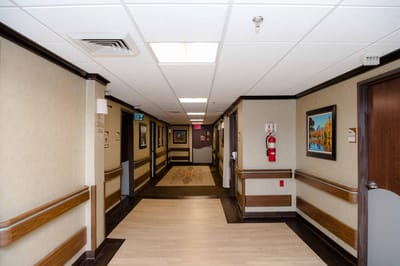
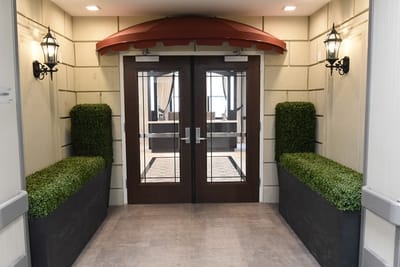

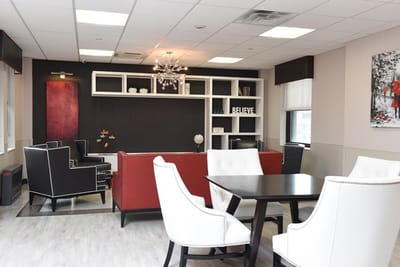


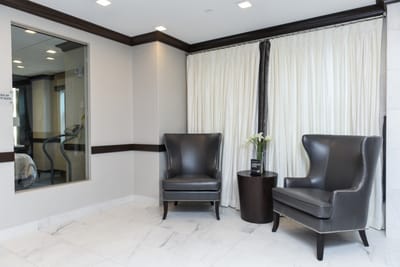
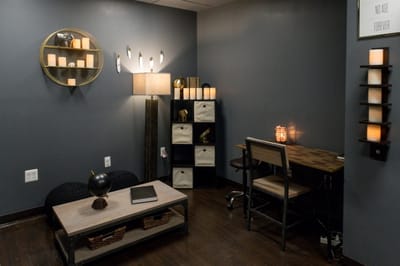
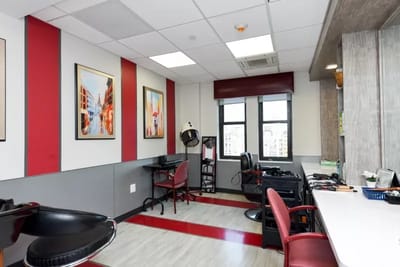
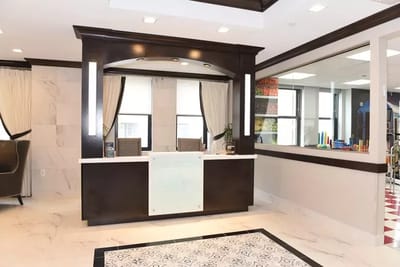
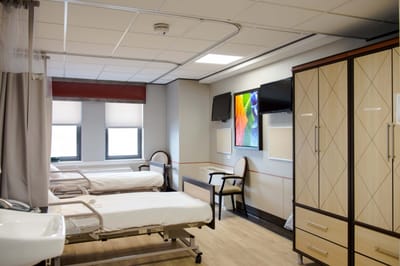
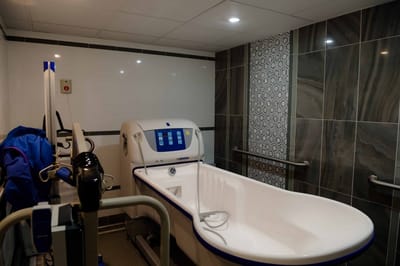
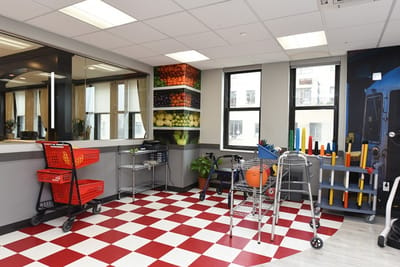
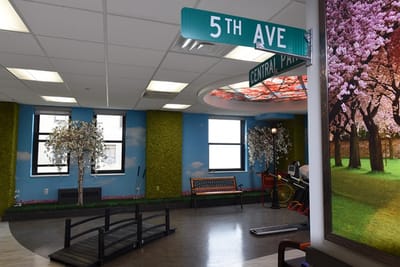
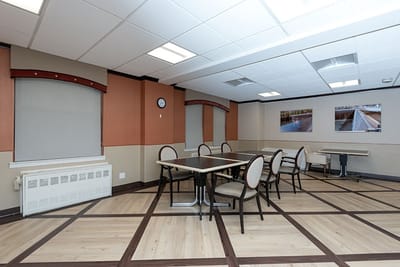
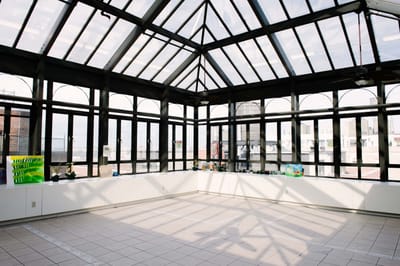
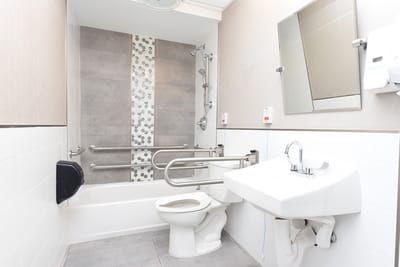


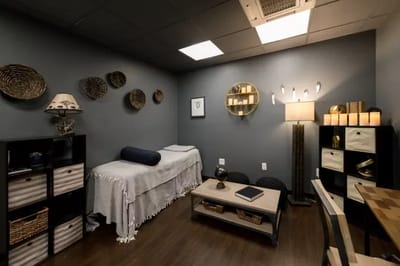
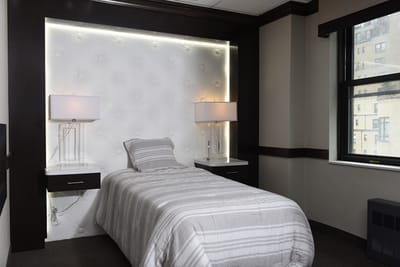

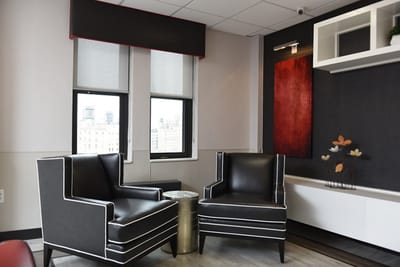


The Riverside Premier Rehabilitation and Healing Center is a luxurious nursing home in New York, NY, that focuses on rehabilitation and long-term care. The community promotes a supportive and nurturing environment, ensuring older adults can find the care they need. Concierge services, chef-prepared dining, and specialized care programs are also offered for residents’ convenience. Through a progressive rehabilitation approach, the community ensures older adults experience an immersive rehabilitation that aims to help them recover quickly.
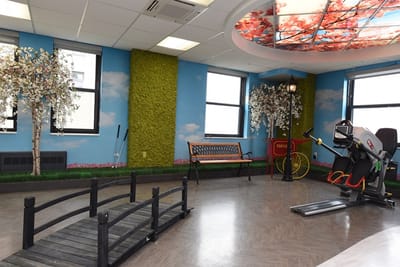
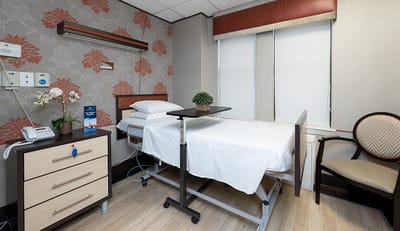
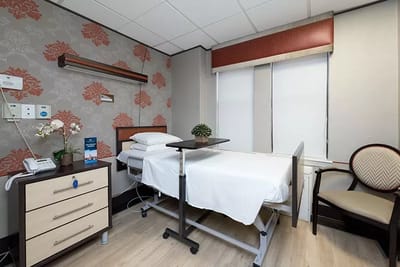
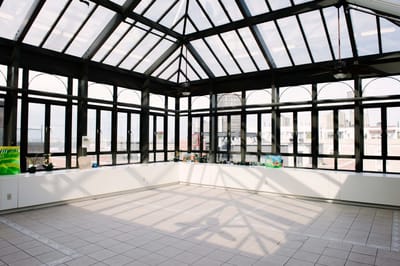
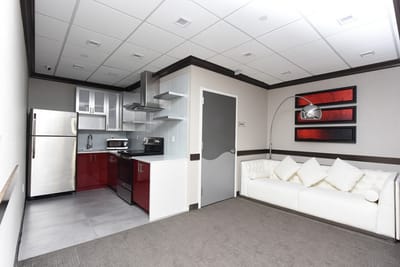
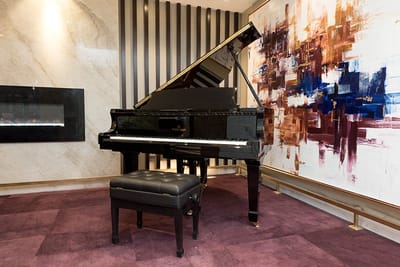
With books, beauty services, and computers available, residents have more options to spend their days. Cozy and secure living spaces and lively gathering areas also provide residents with places to lounge and rest. Overlooking the beautiful Hudson River and surrounded by serene green spaces, the community ensures residents can keep their peace of mind during their stay. As one of the finest options in rehabilitation in New York, this nursing home follows exceptional standards of care to help older adults live to their potential.
| Staff type | Hours / Day / Resident | vs state avg |
|---|---|---|
|
Registered Nurse (RN)
| 28m per day | ▼ 33% State avg: 42m per day · National avg: 41m per day |
|
LPN / LVN
| 31m per day | ▼ 33% State avg: 46m per day · National avg: 52m per day |
|
Nurse Aide
| 1h 55m per day | ▼ 12% State avg: 2h 11m per day · National avg: 2h 21m per day |
|
Weekend Total Nursing
| 2h 38m per day | ▼ 17% State avg: 3h 10m per day · National avg: 3h 26m per day |
|
Physical Therapist
| 8m per day | ▲ 14% State avg: 7m per day · National avg: 4m per day |
|
Weekend RN
| 17m per day | ▼ 39% State avg: 28m per day · National avg: 29m per day |
Reporting period: October 1 – December 31, 2025 (Q4 2025). Source: CMS Payroll-Based Journal report.
Manages medical care and health needs.
Assists with medical care and medications.
Helps with daily care and mobility.
Total hours from contractors
32,788 contractor hours this quarter
| Certified Nursing Assistant | 278 | 1 | 279 | 86,960 | 92 | 100% | 6.6 |
| Licensed Practical Nurse | 64 | 4 | 68 | 23,270 | 92 | 100% | 7.4 |
| Registered Nurse | 48 | 7 | 55 | 16,319 | 92 | 100% | 7.7 |
| Physical Therapy Assistant | 0 | 28 | 28 | 10,538 | 92 | 100% | 7.7 |
| Speech Language Pathologist | 0 | 18 | 18 | 6,591 | 68 | 74% | 7.7 |
| Respiratory Therapy Technician | 0 | 20 | 20 | 6,007 | 84 | 91% | 7.4 |
| Mental Health Service Worker | 10 | 1 | 11 | 4,756 | 78 | 85% | 8 |
| Clinical Nurse Specialist | 12 | 0 | 12 | 4,433 | 90 | 98% | 7.5 |
| Occupational Therapy Aide | 13 | 0 | 13 | 3,629 | 92 | 100% | 7.1 |
| Other Dietary Services Staff | 11 | 0 | 11 | 3,618 | 92 | 100% | 6.8 |
| Physical Therapy Aide | 0 | 9 | 9 | 2,644 | 69 | 75% | 7.6 |
| Qualified Activities Professional | 5 | 0 | 5 | 2,161 | 92 | 100% | 7.6 |
| Qualified Social Worker | 0 | 6 | 6 | 1,921 | 68 | 74% | 7.4 |
| Dietitian | 4 | 0 | 4 | 1,487 | 84 | 91% | 7.4 |
| Dental Services Staff | 3 | 0 | 3 | 888 | 76 | 83% | 7 |
| Administrator | 1 | 0 | 1 | 528 | 66 | 72% | 8 |
| Nurse Practitioner | 1 | 0 | 1 | 424 | 53 | 58% | 8 |
| Other Social Services Staff | 2 | 0 | 2 | 223 | 39 | 42% | 5.7 |
Federal penalties imposed by CMS for regulatory violations, including civil money penalties (fines) and denials of payment for new Medicare/Medicaid admissions.
Source: CMS Penalties Database
No penalties in the past 3 years
No civil money penalties or payment denials were reported in the last 3 years.
These measures show how residents usually do over time at this home, based on health outcomes and preventive care.
New York average: 9.8
New York average: 18.1
New York average: 16.4%
New York average: 16.6%
New York average: 21.4%
New York average: 3.0%
New York average: 7.2%
New York average: 1.4%
New York average: 6.1%
New York average: 18.1%
New York average: 12.6%
New York average: 91.4%
New York average: 95.2%
New York average: 1.71
New York average: 1.35
New York average: 76.6%
New York average: 1.3%
New York average: 78.8%
New York average: 20.6%
New York average: 9.7%
New York average: 0.8%
New York average: 53.7%
New York average: 50.6%
Quality measures are calculated from Minimum Data Set (MDS) assessments. For most measures, lower percentages indicate better care quality.
45% of new residents, usually for short-term rehab.
45% of new residents, often for short stays.
10% of new residents, often for long-term daily care.
Source: CMS Long-Term Care Facility Characteristics (Data as of Jan 2026)
Residents meet regularly to discuss policies, care quality, and activities
Family members meet regularly to discuss policies, care quality, and activities
Organized group of family members that meets regularly to discuss facility policies, resident care, and activities.
Organized group of residents that meets regularly to discuss facility policies, quality of life, and activities.
Data sourced from CMS Long-Term Care Facility Characteristics quarterly report. Payer mix reflects the current resident census by primary payment source.
Historical financial and operational data for The Riverside Premier Rehabilitation and Healing Center from 2011–2023, based on CMS SNF Cost Reports.
Key figures below are for fiscal year ending in 12/2023.
Based on CMS SNF Cost Report for fiscal year ending in 12/2023.
This home supports both short-term rehab and long-term care, with residents staying for a wide range of durations.
New residents most often arrive under Medicare (45% of admissions), and a typical Medicare stay runs around 1 - 2 months.
Coverage residents most often arrive under.
Coverage residents most often leave under.
Daniel Muskin MA, LNHA serves as the Administrator at The Riverside Premier Rehabilitation and Healing Center. He leads the team with a focus on the holistic well-being of patients, ensuring a positive mindset alongside physical healing. His leadership is central to maintaining a supportive and professional environment dedicated to patient care.
![]() 5.6 miles from city center
5.6 miles from city center
![]() Estimated distance in miles from New York's city center to The Riverside Premier Rehabilitation and Healing Center's address, calculated via Google Maps.
— 0.91 miles to nearest hospital (HMH Palisades Medical Center)
Estimated distance in miles from New York's city center to The Riverside Premier Rehabilitation and Healing Center's address, calculated via Google Maps.
— 0.91 miles to nearest hospital (HMH Palisades Medical Center)
Add your location
Info below is compiled from CMS reports & the NY State Dept. of Health (NYSDOH), senior community websites & trusted data sources such as Walk Score & BBB.
Communities are listed from highest to lowest based on our ranking methodology.
| Amsterdam Nursing Home | NH SNF | New York (Manhattan) | 409
Facility
409
NY AVG
160
Rank
#23 / 739 |
98.0%
Facility
98.0%
NY AVG
87.1
Rank
#59 / 410 | +12% | 3.25
Facility
3.25
NY AVG
3.58
Rank
#204 / 394 | +5% | -9% | $0
Facility
$0
NY AVG
$67.6k
Rank
#1 / 402 | 78
Facility
78
NY AVG
83
Rank
#395 / 608 | 14
Facility
14
NY AVG
18.5
Rank
#147 / 401 | 7.0
Facility
7.0
NY AVG
5.1
Rank
#329 / 401 | - | 401 | A+ |
93
Facility
93
NY AVG
63
Rank
#191 / 1169 | Judith Fenster | $81.1MFiscal year ending 12/2023
Facility
$81.1MFiscal year ending 12/2023
NY AVG
$32.0M
Rank
#19 / 388 | $30.1MFiscal year ending 12/2023
Facility
$30.1MFiscal year ending 12/2023
NY AVG
$10.7M
Rank
#25 / 388 | 37.1%Fiscal year ending 12/2023
Facility
37.1%Fiscal year ending 12/2023
NY AVG
37%
Rank
#239 / 388 | 335570 | ||||
| Upper East Side Rehabilitation and Nursing Center | NH PC SNF | New York (Manhattan) | 499
Facility
499
NY AVG
160
Rank
#14 / 739 |
92.0%
Facility
92.0%
NY AVG
87.1
Rank
#252 / 410 | +6% | 2.74
Facility
2.74
NY AVG
3.58
Rank
#340 / 394 | +85% | -23% | $0
Facility
$0
NY AVG
$67.6k
Rank
#1 / 402 | 87
Facility
87
NY AVG
83
Rank
#227 / 608 | 9
Facility
9
NY AVG
18.5
Rank
#57 / 401 | 3.0
Facility
3.0
NY AVG
5.1
Rank
#59 / 401 | - | 459 | - |
97
Facility
97
NY AVG
63
Rank
#80 / 1169 | Celma Dumaguing | $88.6MFiscal year ending 12/2023
Facility
$88.6MFiscal year ending 12/2023
NY AVG
$32.0M
Rank
#20 / 388 | $30.0MFiscal year ending 12/2023
Facility
$30.0MFiscal year ending 12/2023
NY AVG
$10.7M
Rank
#52 / 388 | 33.9%Fiscal year ending 12/2023
Facility
33.9%Fiscal year ending 12/2023
NY AVG
37%
Rank
#370 / 388 | 335232 | ||||
| Fort Tryon Center for Rehabilitation and Nursing | NH SNF | New York (Manhattan) | 205
Facility
205
NY AVG
160
Rank
#156 / 739 |
98.0%
Facility
98.0%
NY AVG
87.1
Rank
#59 / 410 | +12% | 3.63
Facility
3.63
NY AVG
3.58
Rank
#133 / 394 | +4% | +1% | $0
Facility
$0
NY AVG
$67.6k
Rank
#1 / 402 | 81
Facility
81
NY AVG
83
Rank
#351 / 608 | 9
Facility
9
NY AVG
18.5
Rank
#57 / 401 | 3.0
Facility
3.0
NY AVG
5.1
Rank
#59 / 401 | - | 201 | - |
88
Facility
88
NY AVG
63
Rank
#317 / 1169 | Shelly Nakdimen | $32.8MFiscal year ending 12/2023
Facility
$32.8MFiscal year ending 12/2023
NY AVG
$32.0M
Rank
#183 / 388 | $10.7MFiscal year ending 12/2023
Facility
$10.7MFiscal year ending 12/2023
NY AVG
$10.7M
Rank
#202 / 388 | 32.6%Fiscal year ending 12/2023
Facility
32.6%Fiscal year ending 12/2023
NY AVG
37%
Rank
#293 / 388 | 335257 | ||||
| ArchCare at Mary Manning Walsh Nursing Home & Rehabilitation Center | NH MC RC SNF | New York (Manhattan) | 360
Facility
360
NY AVG
160
Rank
#34 / 739 |
91.1%
Facility
91.1%
NY AVG
87.1
Rank
#266 / 410 | +5% | 3.22
Facility
3.22
NY AVG
3.58
Rank
#204 / 394 | +81% | -10% | $0
Facility
$0
NY AVG
$67.6k
Rank
#1 / 402 | 78
Facility
78
NY AVG
83
Rank
#395 / 608 | 14
Facility
14
NY AVG
18.5
Rank
#147 / 401 | 3.5
Facility
3.5
NY AVG
5.1
Rank
#98 / 401 | - | 328 | - |
98
Facility
98
NY AVG
63
Rank
#46 / 1169 | Catholic Healthcare Systems | $68.5MFiscal year ending 12/2023
Facility
$68.5MFiscal year ending 12/2023
NY AVG
$32.0M
Rank
#4 / 388 | $33.9MFiscal year ending 12/2023
Facility
$33.9MFiscal year ending 12/2023
NY AVG
$10.7M
Rank
#20 / 388 | 49.5%Fiscal year ending 12/2023
Facility
49.5%Fiscal year ending 12/2023
NY AVG
37%
Rank
#371 / 388 | 335050 | ||||
| The Riverside Premier Rehabilitation and Healing Center | NH PC SNF | New York (Manhattan) | 520
Facility
520
NY AVG
160
Rank
#10 / 739 |
94.7%
Facility
94.7%
NY AVG
87.1
Rank
#193 / 410 | +9% | 2.58
Facility
2.58
NY AVG
3.58
Rank
#366 / 394 | -20% | -28% | $0
Facility
$0
NY AVG
$67.6k
Rank
#1 / 402 | - | 16
Facility
16
NY AVG
18.5
Rank
#185 / 401 | 5.3
Facility
5.3
NY AVG
5.1
Rank
#242 / 401 | - | 492 | - |
60
Facility
60
NY AVG
63
Rank
#693 / 1169 | 150 Riverside Management Group LLC | $92.6MFiscal year ending 12/2023
Facility
$92.6MFiscal year ending 12/2023
NY AVG
$32.0M
Rank
#9 / 388 | $34.9MFiscal year ending 12/2023
Facility
$34.9MFiscal year ending 12/2023
NY AVG
$10.7M
Rank
#19 / 388 | 37.7%Fiscal year ending 12/2023
Facility
37.7%Fiscal year ending 12/2023
NY AVG
37%
Rank
#304 / 388 | 335334 |
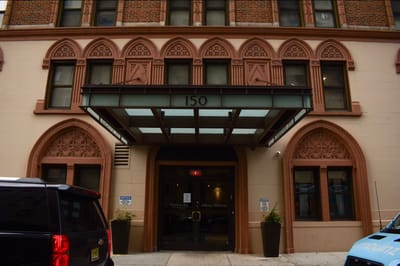
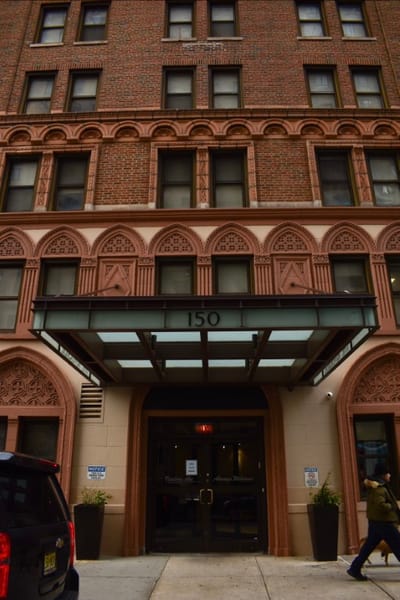
The Riverside Premier Rehabilitation and Healing Center is located in New York City, New York State.
Here are the financial assistance programs available to residents in New York City.
The Riverside Premier Rehabilitation and Healing Center is in the Manhattan neighborhood.
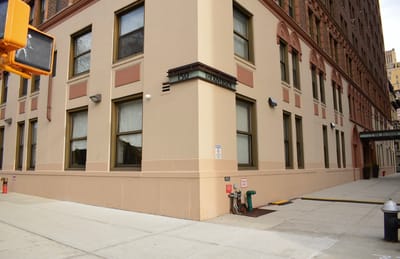
The Riverside Premier Rehabilitation and Healing Center has a walk score of 60. Moderately walkable. Some errands can be accomplished on foot, with a mix of nearby amenities.
The Riverside Premier Rehabilitation and Healing Center's occupancy is 94.1%.
No, The Riverside Premier Rehabilitation and Healing Center has a no-pet policy.
The Riverside Premier Rehabilitation and Healing Center is registered as a for-profit.
Yes — there are 78 photos of The Riverside Premier Rehabilitation and Healing Center in the photo gallery on this page.
The Riverside Premier Rehabilitation and Healing Center is located at 150 Riverside Dr, New York, NY 10024.
Care Cost Calculator: See Prices in Your Area
Nursing Home Data Explorer
Don’t Wait Too Long: 7 Red Flag Signs Your Parent Needs Assisted Living Now
The True Cost of Assisted Living in 2025 – And How Families Are Paying For It
Understanding Senior Living Costs: Pricing Models, Discounts & Financial Assistance


