The Springs of El Dorado Health & Rehabilitation
Nursing Home · El Dorado, AR
CMS overall rating Info The Overall CMS Rating is scored from 1 to 5 stars and combines results from health inspections, staffing levels, and quality measures. Health inspections carry the most weight. Staffing and quality scores can increase or decrease the final rating based on performance compared to state and national standards.

The Springs of El Dorado Health & Rehabilitation

Nursing Home · El Dorado, AR
CMS overall rating Info The Overall CMS Rating is scored from 1 to 5 stars and combines results from health inspections, staffing levels, and quality measures. Health inspections carry the most weight. Staffing and quality scores can increase or decrease the final rating based on performance compared to state and national standards.
Calculator: See prices in your area
The Springs of El Dorado Health & Rehabilitation accepts Medicare, Medicaid, and private pay.

Overview of The Springs of El Dorado Health & Rehabilitation

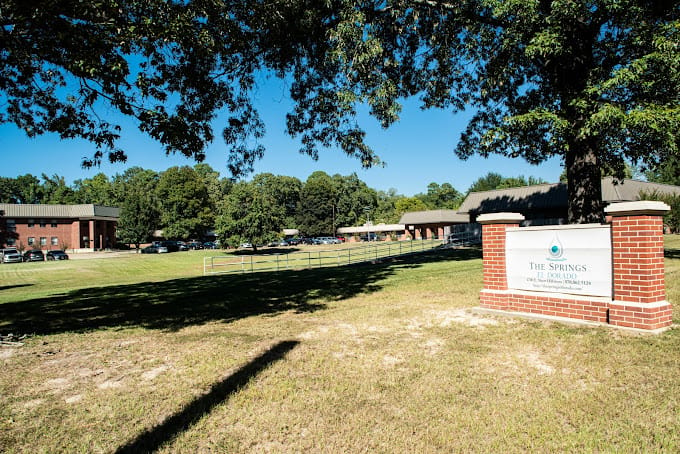
The Springs of El Dorado Health & Rehabilitation is a premier assisted living community in El Dorado, Arkansas, to provide seniors with a second home, offering peace of mind to their loved ones. Their goal is to help seniors maintain a healthy and joyful life, embracing all the adventures life has to offer. The Springs of Jonesboro staff is committed to resident-centered care and strives for excellence in quality improvement.

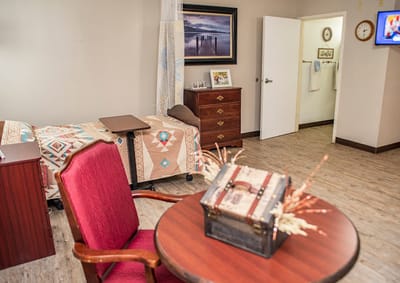
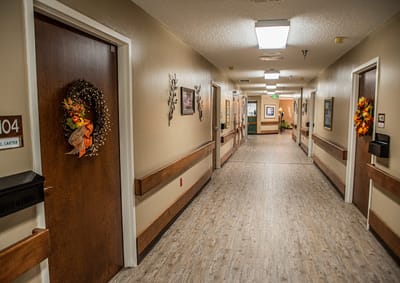
At The Springs of El Dorado Health & Rehabilitation, they believe in creating an environment where senior residents can thrive and enjoy their golden years. This assisted living community is designed with the utmost care. They offer impeccable nursing services, a top-notch staff, outstanding amenities, and specialized programs so that every resident’s health is continually prioritized.

(870) 881-4200

Quality ratings

Measured by Centers for Medicare & Medicaid Services (CMS)

Overall rating Info The Overall CMS Rating combines results from health inspections, staffing levels and quality measures. Health inspections carry the most weight. Staffing and quality scores can increase or decrease the final rating based on performance compared to state and national standards.
▲ 59.4% Above AR avg.
Health Inspection Info Based on the results of the facility's three most recent standard inspections and any complaint investigations. CMS reviews the number, scope, and severity of deficiencies, with more recent findings weighted more heavily.
▲ 38.4% Above AR avg.
Staffing Info Measures average nursing staff hours per resident per day, including Registered Nurses (RNs) and total nursing staff. Ratings are adjusted based on the level of care residents require and are compared to state and national benchmarks.
▼ 5.8% Below AR avg.
Quality Measures Info Based on clinical and physical health indicators reported to CMS, such as hospital readmissions, falls, pressure ulcers, and improvements in mobility. These measures reflect how well residents' health needs are being managed.
▲ 36.6% Above AR avg.

Staffing hours breakdown

Info Daily nursing hours per resident by staff type, reported to CMS. Higher is generally better — compare this facility to state and national averages to see where staffing stands.

Hours per resident per day — compared to Arkansas state averages

Total nursing care / resident Info This home is ranked 51st out of 164 homes in Arkansas.

Total adjusted nursing hours per resident per day, combining RN, LPN, and aide time. CMS adjusts this for case-mix so facilities can be fairly compared.
4h 47m per day
Rank #51 / 164Nurse hours — state benchmarkedThis home is ranked 51st out of 164 homes in Arkansas.Shows adjusted nurse hours per resident per day benchmarked to the Arkansas average, with a ranking across 164 Arkansas SNFs. More hours mean more direct care. The national average is about 3.5 hrs; below 3.0 is a red flag.
This facility Arkansas avg (4h 40m per day)
vs Arkansas avg
+2%

4 of 6 metrics below state avg

Standout metric Physical Therapist is +150% above state avg
Staff typeHours / dayvs state avg
Registered Nurse (RN) Info RNs hold the highest nursing license and can assess residents, interpret test results, and direct care plans. More RN hours per day often signals stronger clinical oversight and faster response to health changes. 21m per day ▼ 13% State avg: 24m per day · National avg: 41m per day
LPN / LVN Info Licensed Practical Nurses (LPNs) or Licensed Vocational Nurses (LVNs) deliver routine hands-on care — medication administration, wound dressing, and monitoring vital signs. They work under RN supervision and make up a large share of daily bedside care. 54m per day ▼ 5% State avg: 57m per day · National avg: 52m per day
Nurse Aide Info Certified Nurse Aides (CNAs) provide the most direct day-to-day assistance: bathing, dressing, feeding, and mobility. Nurse aide hours are typically the largest staffing category and directly affect residents' quality of life. 2h 39m per day ▼ 3% State avg: 2h 44m per day · National avg: 2h 21m per day
Total Nursing (Weekend) Info Combined nursing hours (RN + LPN + Nurse Aide) per resident per day on weekends. Staffing often drops on weekends — this figure reveals whether the facility maintains adequate coverage outside of weekday hours. 3h 13m per day ▼ 8% State avg: 3h 29m per day · National avg: 3h 26m per day
Physical Therapist Info Hours per resident per day provided by licensed Physical Therapists (PTs) or PT Assistants. PT services help residents recover mobility after injury or illness and are especially important for post-acute (short-stay) rehabilitation. 5m per day ▲ 150% State avg: 2m per day · National avg: 4m per day
RN (Weekend) Info Registered nurse hours specifically on weekends. Facilities sometimes reduce RN presence on Saturdays and Sundays — a low weekend RN figure compared to weekday hours can indicate reduced clinical oversight when most administrative staff are absent. 24m per day ▲ 50% State avg: 16m per day · National avg: 29m per day

Capacity and availability

This home usually has availability

Occupancy lower than 85% suggests more openings may be available.

Lower occupancy than the Arkansas average: 71.3%
Occupancy rate 58.3% Rank #120 / 166Occupancy rate — state benchmarkedThis home is ranked 120th out of 166 homes in Arkansas.Shows this facility's occupancy rate versus the Arkansas average, with its statewide rank out of 166. Higher occupancy signals strong local demand and financial stability.
Avg. Length of Stay 191 days
Occupancy rate
58.3% Rank #120 / 166Occupancy rate — state benchmarkedThis home is ranked 120th out of 166 homes in Arkansas.Shows this facility's occupancy rate versus the Arkansas average, with its statewide rank out of 166. Higher occupancy signals strong local demand and financial stability.
Avg. Length of Stay
191 days

Who this home usually serves

TYPE OF STAY

Mostly long-term care residents

Most residents stay for extended periods and receive ongoing daily care.

Breakdown by payment type

Medicare

30% of new residents, usually for short-term rehab.

Typical stay 1 - 2 months

Private pay

34% of new residents, often for short stays.

Typical stay 2 - 3 months

Medicaid

35% of new residents, often for long-term daily care.

Typical stay 1 years

Finances and operations

Privately-owned community
Home revenue
$7.6M
Profit
$331.0K
Privately-owned community
Home revenue
$7.6M Rank #117 / 161Revenue — state benchmarkedThis home is ranked 117th out of 161 homes in Arkansas.Shows this facility's annual revenue compared to the Arkansas SNF average. Higher revenue generally means more resources for staffing and capital — read alongside Payroll %.
Profit
$331.0K
Payroll costs Info The portion of the home's budget spent on staff, including nurses, caregivers, and other employees who support care and operations. Rank #112 / 161Payroll — state benchmarkedThis home is ranked 112th out of 161 homes in Arkansas.Shows total annual staff payroll benchmarked to the Arkansas average. Higher payroll investment relative to peers often signals better staffing and less reliance on cheaper contract labor.
$3.4M
45.2% of revenue Rank #70 / 161Payroll % — state benchmarkedThis home is ranked 70th out of 161 homes in Arkansas.Shows payroll as a percentage of revenue versus the Arkansas average. Well-run SNFs often land around 55–65%. Below 25% may signal understaffing or heavy agency use — read with Staffing ratings.
Other operating costs Info All remaining costs needed to run the home, such as food, utilities, building maintenance, supplies and administrative expenses.
$3.8M
Total costs $7.3M
Walk Score
Walk Score: 11 / 100 Rank #57 / 77Walk Score — state benchmarkedThis home is ranked 57th out of 77 homes in Arkansas.Shows how walkable this facility's neighborhood is compared to the average Walk Score across Arkansas SNFs. Higher scores benefit residents, families, and staff.
Car-dependent. Most errands require a car, with limited nearby walkable options.

What does this home offer?

Building type icon
Building type icon

Building Type: Single-story

Dining services icon

Dining Services

Social and recreational activities icon

Social and Recreational Activities

On-site medical care and health services icon

On-site Medical Care and Health Services

Types of Care at The Springs of El Dorado Health & Rehabilitation

Nursing Home

Contact The Springs of El Dorado Health & Rehabilitation

Health Inspection History

Inspections
Total health inspections 3

Arkansas average 4.2


Last Health inspection on May 2025

Total health citations
20 Rank #77 / 169Health citations — state benchmarkedThis home is ranked 77th out of 169 homes in Arkansas.Shows this facility's total health deficiency citations benchmarked to the Arkansas state average, with a ranking across all 169 AR SNFs. Lower citation counts earn a better rank.

Arkansas average 21.8

Citations per inspection
6.67 Rank #136 / 169Citations per inspection — state benchmarkedThis home is ranked 136th out of 169 homes in Arkansas.Shows average deficiency citations per CMS inspection for this facility versus the Arkansas mean across 169 SNFs with citation data. Lower is better.

Arkansas average 5.32


Health citations are formal notices following inspections when they fail to comply with safety and care standards.

17 of 20 citations resulted from standard inspections; 1 of 20 resulted from complaint investigations; and 2 of 20 came from combined inspections (standard and complaint).

Breakdown of citation severity (last 4 years)
Critical Health citations More info
1
150% worse than Arkansas average

Arkansas average: 0.4


Serious Health citations More info 0
100% better than Arkansas average

Arkansas average: 0.2

1 critical citation More info Arkansas average: 0.4

0 serious citations More info Arkansas average: 0.2

19 moderate citations More info Arkansas average: 20.9

0 minor citations More info Arkansas average: 0.4
Citations history (last 4 years)
Nutrition moderate citation Info Issues related to food quality, meal service, and resident's nutritional needs. May 01, 2025
Corrected

Resident Rights moderate citation Info Issues related to resident's rights, including dignity, privacy, and the ability to make decisions about their care. May 01, 2025
Corrected

Infection Control moderate citation Info Issues related to preventing and controlling infections, including hygiene practices and safety protocols. Mar 01, 2024
Corrected

Nutrition moderate citation Info Issues related to food quality, meal service, and resident's nutritional needs. Mar 01, 2024
Corrected

Financial Assistance for
Nursing Home in Arkansas

The Springs of El Dorado Health & Rehabilitation is located in El Dorado, Arkansas.
Here are the financial assistance programs available to residents in Arkansas.

Get Financial aid guidance

ARChoices

Arkansas Medicaid ARChoices

Age 65+ or 21+ with disability
General Arkansas resident, Medicaid- eligible, nursing home-level care need.
Income Limits (2025) ~$2,829/month 300% FBR, individual
Asset Limits $2,000 (individual), $3,000 (couple).
AR

Rural focus; possible waitlists.

Benefits
Personal care (5-7 hours/day) Meals ($7/meal) Respite care (240 hours/year) Adult day services ($60/day)

Choices in Living Resource Center

Arkansas Choices in Living

Age 60+
General Arkansas resident.
Income Limits No strict limit; prioritizes low-income.
Asset Limits Not applicable.
AR

Limited direct funding; mostly referral-based.

Benefits
Care coordination Limited respite (up to 5 days/year) Transportation assistance (~5 trips/month)

Living Choices Assisted Living Waiver

Arkansas Medicaid Living Choices Assisted Living Waiver

Age 65+
General Arkansas resident, requires nursing home-level care, lives in a Level II assisted living facility.
Income Limits (2025) ~$2,829/month 300% FBR, individual
Asset Limits $2,000 (individual), $3,000 (couple); spousal rules apply.
AR

Limited provider network; excludes Level I facilities (no nursing services).

Benefits
Personal care (~5 hours/day) Medication management Nursing Activities Transportation

Program of All-Inclusive Care for the Elderly (PACE)

Arkansas Medicaid PACE

Age 55+
General Arkansas resident, nursing home-level care, safe with PACE support.
Income Limits (2025) ~$2,829/month 300% FBR
Asset Limits $2,000 (individual), $3,000 (couple).
AR

Limited geographic availability.

Benefits
Primary/preventive care Personal care (5-7 hours/day) Meals Transportation Therapy

Arkansas State Plan Personal Care

Arkansas Medicaid Personal Care Program

Age
General Any age, Arkansas resident, needs ADL/IADL help, Medicaid-eligible.
Income Limits (2025) ~$1,004/month individual
Asset Limits $9,660 (individual), $14,470 (couple).
AR

No nursing home-level care requirement.

Benefits
Personal care (~4-6 hours/day) Homemaker services (e.g., meal prep)

Places of interest near The Springs of El Dorado Health & Rehabilitation

Address 1.3 miles from city center Info Estimated distance in miles from El Dorado's city center to The Springs of El Dorado Health & Rehabilitation's address, calculated via Google Maps. — 1.72 miles to nearest hospital (DaVita South Arkansas Dialysis)

Calculate Travel Distance to The Springs of El Dorado Health & Rehabilitation

Add your location

Address

Staffing Data (Q2 2025)

This data corresponds to Q2 2025 and is based on CMS Payroll-Based Journal.

Total staff 123
Employees 115
Contractors 8
Staff to resident ratio 1.48:1
8% worse than Arkansas average

Arkansas average ratio: 1.61:1

Avg staff/day 44
Average shift 7.8 hours
0% compared with Arkansas average

Arkansas average: 8 hours

Total staff hours (quarter) 31,238

Nursing staff breakdown

Registered Nurse

Manages medical care and health needs.

Total count 8
Average shift length Info Average shift length. Calculated as total hours divided by days worked and average staff per day. 7.2 hours

No contractors work on this role.

Licensed Practical Nurse

Assists with medical care and medications.

Total count 20
Average shift length Info Average shift length. Calculated as total hours divided by days worked and average staff per day. 8 hours

No contractors work on this role.

Certified Nursing Assistant

Helps with daily care and mobility.

Total count 62
Average shift length Info Average shift length. Calculated as total hours divided by days worked and average staff per day. 8.1 hours

No contractors work on this role.

Contractor staffing

Total hours from contractors

1.4%

446 contractor hours this quarter

Respiratory Therapy Technician: 1 Speech Language Pathologist: 1 Qualified Social Worker: 1 Physical Therapy Assistant: 1 Physical Therapy Aide: 1 Occupational Therapy Aide: 1 Medical Director: 1 Occupational Therapy Assistant: 1

Staff by category

Certified Nursing Assistant6206217,76291100%8.1
Licensed Practical Nurse200205,37591100%8
Nurse Aide in Training9091,8487987%8
RN Director of Nursing3031,4807077%8.1
Registered Nurse8081,1519099%7.2
Dental Services Staff1015256369%8.3
Clinical Nurse Specialist1015115965%8.7
Other Dietary Services Staff1014806875%7.1
Administrator1014565763%8
Nurse Practitioner1014565763%8
Physical Therapy Aide2134016875%5.9
Respiratory Therapy Technician2133885662%5.2
Speech Language Pathologist1121792426%7.5
Qualified Social Worker213963336%2.9
Physical Therapy Assistant112602426%2.5
Occupational Therapy Assistant0113167%5.2
Occupational Therapy Aide011291112%2.6
Medical Director011131011%1.3
62 Certified Nursing Assistant
% of Days 100%
20 Licensed Practical Nurse
% of Days 100%
9 Nurse Aide in Training
% of Days 87%
3 RN Director of Nursing
% of Days 77%
8 Registered Nurse
% of Days 99%
1 Dental Services Staff
% of Days 69%
1 Clinical Nurse Specialist
% of Days 65%
1 Other Dietary Services Staff
% of Days 75%
1 Administrator
% of Days 63%
1 Nurse Practitioner
% of Days 63%
3 Physical Therapy Aide
% of Days 75%
3 Respiratory Therapy Technician
% of Days 62%
2 Speech Language Pathologist
% of Days 26%
3 Qualified Social Worker
% of Days 36%
2 Physical Therapy Assistant
% of Days 26%
1 Occupational Therapy Assistant
% of Days 7%
1 Occupational Therapy Aide
% of Days 12%
1 Medical Director
% of Days 11%

Facility Characteristics

Source: CMS Long-Term Care Facility Characteristics (Data as of Jan 2026)

Total residents 83
Medicare
8
9.6% of residents
Medicaid
62
74.7% of residents
Private pay or other
13
15.7% of residents
Programs & Services
Residents Group

Residents meet regularly to discuss policies, care quality, and activities

Active Resident Council

Organized group of residents that meets regularly to discuss facility policies, quality of life, and activities.

Quality of care over time

These measures show how residents usually do over time at this home, based on health outcomes and preventive care.

High-risk clinical events score Info A composite score based on pressure ulcers, falls with injury, weight loss, walking ability decline, and activities of daily living decline. 6.9
10% better than Arkansas average

Arkansas average: 7.7

Functional decline score Info A composite score based on activities of daily living decline, walking ability decline, and incontinence. 5.2
61% better than Arkansas average

Arkansas average: 13.3

Long-stay resident measures
Significantly above average Arkansas avg: 4.2 Info CMS star rating based on long-stay quality measure performance. 5 stars = significantly above average, 1 star = significantly below average.
Need for Help with Daily Activities Increased Info Percent of long-stay residents whose need for help with daily activities has increased 4.7%
59% better than Arkansas average

Arkansas average: 11.5%

Walking Ability Worsened Info Percent of long-stay residents whose ability to move independently worsened 4.9%
63% better than Arkansas average

Arkansas average: 13.4%

Low Risk Residents with Bowel/Bladder Incontinence Info Percent of low risk long-stay residents who lose control of their bowels or bladder 6.0%
61% better than Arkansas average

Arkansas average: 15.1%

Falls with Major Injury Info Percent of long-stay residents experiencing one or more falls with major injury 10.5%
167% worse than Arkansas average

Arkansas average: 3.9%

High Risk Residents with Pressure Ulcers Info Percent of long-stay high risk residents with pressure ulcers 6.7%
41% worse than Arkansas average

Arkansas average: 4.7%

Urinary Tract Infection Info Percent of long-stay residents with a urinary tract infection 1.0%
22% better than Arkansas average

Arkansas average: 1.3%

Lost Too Much Weight Info Percent of long-stay residents who lose too much weight 7.7%
54% worse than Arkansas average

Arkansas average: 5.0%

Depressive Symptoms Info Percent of long-stay residents who have depressive symptoms 0.0%
100% better than Arkansas average

Arkansas average: 1.5%

Antipsychotic Use Info Percent of long-stay residents who received an antipsychotic medication 16.8%
61% worse than Arkansas average

Arkansas average: 10.5%

Pneumococcal Vaccine Info Percent of long-stay residents assessed and appropriately given the pneumococcal vaccine 99.7%
6% better than Arkansas average

Arkansas average: 94.4%

Influenza Vaccine Info Percent of long-stay residents assessed and appropriately given the seasonal influenza vaccine 98.7%
In line with Arkansas average

Arkansas average: 96.2%

Hospitalizations per 1,000 days Info Number of hospitalizations per 1,000 long-stay resident days. 1.02
48% better than Arkansas average

Arkansas average: 1.97

ED visits per 1,000 days Info Number of outpatient emergency department visits per 1,000 long-stay resident days. 1.36
38% better than Arkansas average

Arkansas average: 2.18

Short-stay resident measures
Above average Arkansas avg: 2.7 Info CMS star rating based on short-stay quality measure performance. 5 stars = much above average, 1 star = much below average.
Pneumococcal Vaccine Info Percent of short-stay residents assessed and appropriately given the pneumococcal vaccine 100.0%
24% better than Arkansas average

Arkansas average: 80.9%

Antipsychotic medication increase Info Percent of short-stay residents who newly received an antipsychotic medication 6.0%
294% worse than Arkansas average

Arkansas average: 1.5%

Influenza Vaccine Info Percent of short-stay residents assessed and appropriately given the seasonal influenza vaccine 95.7%
23% better than Arkansas average

Arkansas average: 77.7%

Re-hospitalized after SNF stay Info Percentage of short-stay residents who were re-hospitalized after their nursing home admission. 16.8%
33% better than Arkansas average

Arkansas average: 25.2%

Emergency department visits Info Percentage of short-stay residents who had an outpatient emergency department visit. 7.1%
49% better than Arkansas average

Arkansas average: 13.8%

Falls with major injury Info Percentage of SNF residents who experience falls with major injury during their stay. 0.0%
100% better than Arkansas average

Arkansas average: 0.8%

Ability to care for self at discharge Info Percentage of residents at or above expected ability to care for themselves at discharge. 58.3%
9% better than Arkansas average

Arkansas average: 53.7%

Penalties and fines

Federal penalties imposed by CMS for regulatory violations, including civil money penalties (fines) and denials of payment for new Medicare/Medicaid admissions.

Source: CMS Penalties Database

No penalties in the past 3 years

No civil money penalties or payment denials were reported in the last 3 years.

Guides for Better Senior Living

Care Cost Calculator: See Prices in Your Area

Nursing Home Data Explorer

Don’t Wait Too Long: 7 Red Flag Signs Your Parent Needs Assisted Living Now

The True Cost of Assisted Living in 2025 – And How Families Are Paying For It

Understanding Senior Living Costs: Pricing Models, Discounts & Financial Assistance

Frequently Asked Questions about The Springs of El Dorado Health & Rehabilitation

Is The Springs of El Dorado Health & Rehabilitation in a walkable area?

The Springs of El Dorado Health & Rehabilitation has a walk score of 11. Car-dependent. Most errands require a car, with limited nearby walkable options.

What is the phone number of The Springs of El Dorado Health & Rehabilitation?

(870) 881-4200 will put you in contact with the team at The Springs of El Dorado Health & Rehabilitation.

Is The Springs of El Dorado Health & Rehabilitation Medicare or Medicaid certified?

Yes — The Springs of El Dorado Health & Rehabilitation is a CMS-certified provider of Medicare and Medicaid.

Explore Open Rooms
1 Contact details
2 What type of senior care service are you looking for?
3 What budget do you have in mind for senior care?
4 How soon do you need to find care?
5 Additional details

Thank you for your interest!

Our team will be in touch shortly to help with next steps.