Explore Open Rooms
1 Contact details
2 What type of senior care service are you looking for?
3 What budget do you have in mind for senior care?
4 How soon do you need to find care?
5 Additional details

Thank you for your interest!

Our team will be in touch shortly to help with next steps.

Nursing Home in Hennepin County

CMS overall rating Info The Overall CMS Rating combines results from health inspections, staffing levels and quality measures. Health inspections carry the most weight. Staffing and quality scores can increase or decrease the final rating based on performance compared to state and national standards.

The Villas at Robbinsdale

Overview of The Villas at Robbinsdale

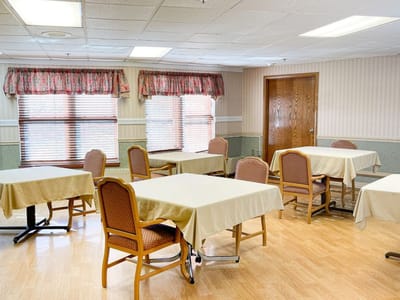
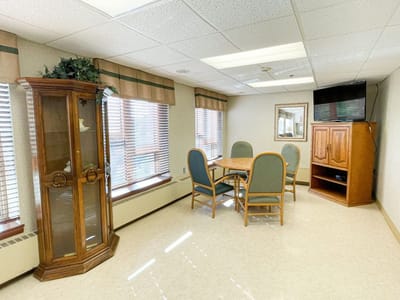
Ideally located near North Memorial Health – Robbinsdale Hospital in Robbinsdale, MN, The Villas at Robbinsdale is a dependable community that offers short-term rehabilitation and long-term care. Here, residents enjoy the highest quality of life with a compassionate and highly trained team attending to their needs around the clock. Through a holistic approach to care, residents can ease their worries and do the things they love with ease.

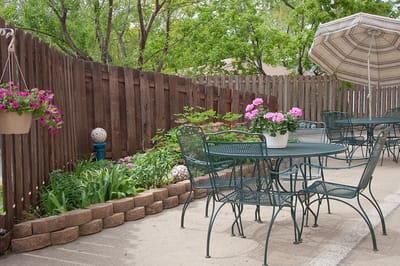
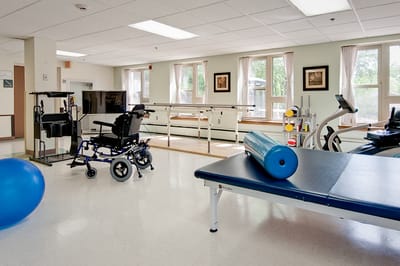
With a full calendar of engaging events and enriching activities, residents are encouraged to live actively and interact with their surroundings. Therapy services, including physical, occupational, and speech therapy, and physician services are also provided to improve residents’ living experiences. Delightful and healthy meals are also served for residents’ nutritional needs and tastes. The community is an enticing option for those looking for comprehensive care to live a blissful retirement.

(763) 230-3122

Quality ratings

Measured by Centers for Medicare & Medicaid Services (CMS)

Overall rating Info The Overall CMS Rating combines results from health inspections, staffing levels and quality measures. Health inspections carry the most weight. Staffing and quality scores can increase or decrease the final rating based on performance compared to state and national standards.
2/5
Minnesota average: 3.2/5
Health Inspection Info Based on the results of the facility's three most recent standard inspections and any complaint investigations. CMS reviews the number, scope, and severity of deficiencies, with more recent findings weighted more heavily.
2/5
Minnesota average: 2.8/5
Staffing Info Measures average nursing staff hours per resident per day, including Registered Nurses (RNs) and total nursing staff. Ratings are adjusted based on the level of care residents require and are compared to state and national benchmarks.
3/5
Minnesota average: 4.1/5
Quality Measures Info Based on clinical and physical health indicators reported to CMS, such as hospital readmissions, falls, pressure ulcers, and improvements in mobility. These measures reflect how well residents' health needs are being managed.
3/5
Minnesota average: 3.1/5

Nursing care per resident

Info This shows how many total hours of nursing staff time are available per resident each day. Higher numbers usually mean more staff support.
3h 56m per day

This home provides 17% less nursing time per resident than the Minnesota average.

Minnesota average: 4h 46m per day

Staffing hours breakdown

Info Hours of care per resident per day, broken down by staff type. Data from CMS Medicare.
Staff type Facility State avg National avg
Registered Nurse (RN) Info Registered nurse hours per resident per day. 45m per day 1h 4m per day 41m per day
Nurse Aide Info Nurse aide hours per resident per day. 1h 49m per day 2h 33m per day 2h 21m per day
Total Nursing (Weekend) Info Total number of nurse staff hours per resident per day on weekends. 3h 8m per day 3h 41m per day 3h 26m per day
Physical Therapist Info Physical therapist staff hours per resident per day. 2m per day 4m per day 4m per day
RN (Weekend) Info Registered nurse hours per resident per day on weekends. 23m per day 41m per day 29m per day

Capacity and availability

Smaller home

May offer a more intimate, personalized care environment.

Total beds 75

This home usually has limited availability

Occupancy is moderate, suggesting balanced demand.

Similar demand to the Minnesota average
Occupancy rate 88%
Residents per day (avg) 69
Occupancy rate
88%
Residents per day (avg)
69

Who this home usually serves

TYPE OF STAY

Primarily short stays

Residents typically stay for brief periods, with frequent admissions and discharges throughout the year.

Might be optimal for
Post-acute recovery Temporary care Transitional stays

Breakdown by payment type

Medicare

21% of new residents, usually for short-term rehab.

Typical stay 21 days

Private pay

64% of new residents, often for short stays.

Typical stay 1 - 2 months

Medicaid

15% of new residents, often for long-term daily care.

Typical stay 1 years

Finances and operations

Privately-owned community
Home revenue
$9.4M
Operating loss
-$449.9K
Privately-owned community
Home revenue
$9.4M
Operating loss
-$449.9K
Payroll costs Info The portion of the home's budget spent on staff, including nurses, caregivers, and other employees who support care and operations.
$3.6M
38.7% of revenue
Other operating costs Info All remaining costs needed to run the home, such as food, utilities, building maintenance, supplies and administrative expenses.
$6.2M
Total costs $9.9M

What does this home offer?

Accepts Medicaid icon

Accept Medicaid: Yes

Housing options icon

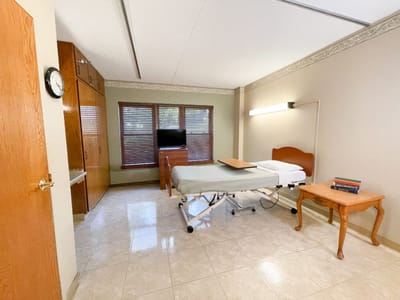
Housing Options: Semi-Private Rooms

Building type icon
Building type icon

Building Type: Mid-rise

Dining services icon

Dining Services

Transportation services icon

Transportation Services

Housekeeping icon
Housekeeping icon

Housekeeping Services

Recreational activities icon

Recreational Activities

Types of Care at The Villas at Robbinsdale

Nursing Home Assisted Living

Contact The Villas at Robbinsdale

Health Inspection History

Inspections
Total health inspections 10

Minnesota average 6


Last Health inspection on Apr 2025

Total health citations 37

Minnesota average 23.2

Citations per inspection
3.7

Minnesota average 3.76


Health citations are formal notices following inspections when they fail to comply with safety and care standards.

23 of 37 citations resulted from standard inspections; 13 of 37 resulted from complaint investigations; and 1 of 37 came from combined inspections (standard and complaint).

Breakdown of citation severity (last 3 years)
Critical Health citations More info 1
43% worse than Minnesota average

Minnesota average: 0.7


Serious Health citations More info 1
100% worse than Minnesota average

Minnesota average: 0.5

1 critical citation More info Minnesota average: 0.7

1 serious citation More info Minnesota average: 0.5

35 moderate citations More info Minnesota average: 21.2

0 minor citations More info Minnesota average: 0.8
Citations history (last 3 years)
Infection Control moderate citation Info Issues related to preventing and controlling infections, including hygiene practices and safety protocols. Apr 30, 2025
Corrected

Nutrition moderate citation Info Issues related to food quality, meal service, and resident's nutritional needs. Apr 30, 2025
Corrected

Nutrition moderate citation Info Issues related to food quality, meal service, and resident's nutritional needs. Apr 30, 2025
Corrected

Pharmacy moderate citation Info Issues related to medication management, including how drugs are stored, administered, and monitored. Apr 30, 2025
Corrected

Compare Nursing Homes around Hennepin County The information below is reported by the Minnesota Department of Health, Health Regulation Division.

5 facilities compared · CMS & MN Dept. of Health data · Updated Apr 2026

Filter by care type
The Villas at Robbinsdale
AL

Assisted Living A licensed, long-term care setting for seniors or individuals with disabilities who need help with daily activities — like bathing, dressing, and medication management — but not 24-hour skilled nursing. Offers housing, meals, and around-the-clock support while aiming to maximize resident independence.

NH

Nursing Home Licensed facility providing 24/7 skilled nursing care for residents with complex, ongoing medical needs. Staffed by RNs, LPNs, and CNAs. Inspected and star-rated annually by CMS. Accepts Medicare (short-term rehab) and Medicaid (long-term care).

Robbinsdale
75
88.0%
+10%
3.94
+52%
-17%
2
37
3.7
2
69
-
41
-
$9.1M
$3.6M
39.9%
245417
Lakehouse Healthcare and Rehabilitation Center
HC

Home Care Professional care delivered in the person's own home — from companionship and errands to skilled nursing and therapy. Allows seniors to age in place. Medicare covers skilled home health when medically necessary.

MC

Memory Care Secured, specialized care for people living with Alzheimer's or dementia. Staff trained in cognitive impairment, with higher staff-to-resident ratios and an environment designed to reduce confusion and wandering risk.

NH

Nursing Home Licensed facility providing 24/7 skilled nursing care for residents with complex, ongoing medical needs. Staffed by RNs, LPNs, and CNAs. Inspected and star-rated annually by CMS. Accepts Medicare (short-term rehab) and Medicaid (long-term care).

RC

Respite Care Short-term temporary care — days to weeks — to give family caregivers a break. Full care provided during the stay. Often used after hospitalization or to trial a facility before a permanent placement decision.

Minneapolis (Southwest Minneapolis)
260
80.9%
+2%
3.91
-25%
-18%
0
76
5.1
1
224
-
81
Lake Harriet Operator Holdings Llc
$22.1M
$8.9M
40.2%
245055
The Villas at Bryn Mawr
AL

Assisted Living A licensed, long-term care setting for seniors or individuals with disabilities who need help with daily activities — like bathing, dressing, and medication management — but not 24-hour skilled nursing. Offers housing, meals, and around-the-clock support while aiming to maximize resident independence.

NH

Nursing Home Licensed facility providing 24/7 skilled nursing care for residents with complex, ongoing medical needs. Staffed by RNs, LPNs, and CNAs. Inspected and star-rated annually by CMS. Accepts Medicare (short-term rehab) and Medicaid (long-term care).

Minneapolis (Harrison)
105
75.0%
-6%
3.73
-25%
-22%
1
58
5.3
4
104
-
55
-
$9.2M
$4.3M
46.2%
245203
Centennial Gardens for Nursing and Rehabilitation
-
NH

Nursing Home Licensed facility providing 24/7 skilled nursing care for residents with complex, ongoing medical needs. Staffed by RNs, LPNs, and CNAs. Inspected and star-rated annually by CMS. Accepts Medicare (short-term rehab) and Medicaid (long-term care).

Minneapolis (Bassett Creek)
85
-
-
-
-
-
-
-
-
0
0
0.0
0
-
-
32
-
-
-
-
-
Covenant Living of Golden Valley
-
AL

Assisted Living A licensed, long-term care setting for seniors or individuals with disabilities who need help with daily activities — like bathing, dressing, and medication management — but not 24-hour skilled nursing. Offers housing, meals, and around-the-clock support while aiming to maximize resident independence.

MC

Memory Care Secured, specialized care for people living with Alzheimer's or dementia. Staff trained in cognitive impairment, with higher staff-to-resident ratios and an environment designed to reduce confusion and wandering risk.

NH

Nursing Home Licensed facility providing 24/7 skilled nursing care for residents with complex, ongoing medical needs. Staffed by RNs, LPNs, and CNAs. Inspected and star-rated annually by CMS. Accepts Medicare (short-term rehab) and Medicaid (long-term care).

Golden Valley
-
-
-
-
-
-
-
-
-
0
0
0.0
0
-
-
48
-
-
-
-
-

Places of interest near The Villas at Robbinsdale

Address 1.7 miles from city center

Calculate Travel Distance to The Villas at Robbinsdale

Add your location

Address

Staffing Data (Q2 2025)

This data corresponds to Q2 2025 and is based on CMS Payroll-Based Journal.

Total staff 184
Employees 61
Contractors 123
Staff to resident ratio 2.71:1
22% better than Minnesota average

Minnesota average ratio: 2.22:1

Avg staff/day 37
Average shift 7.6 hours
0% compared with Minnesota average

Minnesota average: 7.5 hours

Total staff hours (quarter) 25,730
Nursing staff breakdown
Registered Nurse

Manages medical care and health needs.

Total count 38
Average shift length Info Average shift length. Calculated as total hours divided by days worked and average staff per day. 9.6 hours

This role is partially covered by contractors.

Licensed Practical Nurse

Assists with medical care and medications.

Total count 33
Average shift length Info Average shift length. Calculated as total hours divided by days worked and average staff per day. 8.5 hours

This role is partially covered by contractors.

Certified Nursing Assistant

Helps with daily care and mobility.

Total count 71
Average shift length Info Average shift length. Calculated as total hours divided by days worked and average staff per day. 7.6 hours

This role is partially covered by contractors.

Contractor staffing

Total hours from contractors

15.6%

4,009 contractor hours this quarter

Certified Nursing Assistant: 41 Registered Nurse: 33 Licensed Practical Nurse: 20 Respiratory Therapy Technician: 6 Speech Language Pathologist: 5 Feeding Assistant: 4 Diagnostic X-ray Services Staff: 3 Qualified Social Worker: 3 Other Physician: 3 Physical Therapy Assistant: 2 Physical Therapy Aide: 1 Occupational Therapy Assistant: 1 Medical Director: 1
Staff by category
Certified Nursing Assistant30417111,07291100%7.6
Licensed Practical Nurse1320334,14091100%8.5
Registered Nurse533383,5329099%9.6
Clinical Nurse Specialist7071,9837077%8.4
Dental Services Staff2029676673%8.5
Other Dietary Services Staff2029127785%7.6
Speech Language Pathologist0555036571%7
Physical Therapy Assistant0224546976%6.6
Administrator1014506066%7.5
Nurse Practitioner1013985358%7.5
Feeding Assistant0443903943%5
Physical Therapy Aide0113106369%4.9
Respiratory Therapy Technician0662015662%3.3
Qualified Social Worker0331836066%3
Other Physician0331202426%4.8
Diagnostic X-ray Services Staff033681820%3.8
Occupational Therapy Assistant0112667%4.3
Medical Director0112433%8
71 Certified Nursing Assistant
% of Days 100%
33 Licensed Practical Nurse
% of Days 100%
38 Registered Nurse
% of Days 99%
7 Clinical Nurse Specialist
% of Days 77%
2 Dental Services Staff
% of Days 73%
2 Other Dietary Services Staff
% of Days 85%
5 Speech Language Pathologist
% of Days 71%
2 Physical Therapy Assistant
% of Days 76%
1 Administrator
% of Days 66%
1 Nurse Practitioner
% of Days 58%
4 Feeding Assistant
% of Days 43%
1 Physical Therapy Aide
% of Days 69%
6 Respiratory Therapy Technician
% of Days 62%
3 Qualified Social Worker
% of Days 66%
3 Other Physician
% of Days 26%
3 Diagnostic X-ray Services Staff
% of Days 20%
1 Occupational Therapy Assistant
% of Days 7%
1 Medical Director
% of Days 3%

Facility Characteristics

Source: CMS Long-Term Care Facility Characteristics (Data as of Jan 2026)

Total census
68 residents
Residents by payment source
Medicare
5 residents (7.4%)
Medicaid
47 residents (69.1%)
Private pay or other
16 residents (23.5%)
Programs & Services
Residents' Group

Residents meet regularly to discuss policies, care quality, and activities

Family Member Group

Family members meet regularly to discuss policies, care quality, and activities

Active Family Council

Organized group of family members that meets regularly to discuss facility policies, resident care, and activities.

Active Resident Council

Organized group of residents that meets regularly to discuss facility policies, quality of life, and activities.

Quality of care over time

These measures show how residents usually do over time at this home, based on health outcomes and preventive care.

High-risk clinical events score Info A composite score based on pressure ulcers, falls with injury, weight loss, walking ability decline, and activities of daily living decline. 9.9
11% better than Minnesota average

Minnesota average: 11.1

Functional decline score Info A composite score based on activities of daily living decline, walking ability decline, and incontinence. 19.4
14% better than Minnesota average

Minnesota average: 22.6

Long-stay resident measures
Above average Minnesota avg: 2.9 Info CMS star rating based on long-stay quality measure performance. 5 stars = significantly above average, 1 star = significantly below average.
Need for Help with Daily Activities Increased Info Percent of long-stay residents whose need for help with daily activities has increased 13.3%
30% better than Minnesota average

Minnesota average: 18.9%

Walking Ability Worsened Info Percent of long-stay residents whose ability to move independently worsened 21.8%
9% better than Minnesota average

Minnesota average: 23.8%

Low Risk Residents with Bowel/Bladder Incontinence Info Percent of low risk long-stay residents who lose control of their bowels or bladder 23.2%
7% better than Minnesota average

Minnesota average: 25.0%

Falls with Major Injury Info Percent of long-stay residents experiencing one or more falls with major injury 2.6%
30% better than Minnesota average

Minnesota average: 3.7%

High Risk Residents with Pressure Ulcers Info Percent of long-stay high risk residents with pressure ulcers 3.7%
33% better than Minnesota average

Minnesota average: 5.4%

Urinary Tract Infection Info Percent of long-stay residents with a urinary tract infection 0.4%
84% better than Minnesota average

Minnesota average: 2.7%

Lost Too Much Weight Info Percent of long-stay residents who lose too much weight 8.2%
99% worse than Minnesota average

Minnesota average: 4.1%

Depressive Symptoms Info Percent of long-stay residents who have depressive symptoms 0.0%
100% better than Minnesota average

Minnesota average: 4.4%

Antipsychotic Use Info Percent of long-stay residents who received an antipsychotic medication 12.6%
27% better than Minnesota average

Minnesota average: 17.2%

Pneumococcal Vaccine Info Percent of long-stay residents assessed and appropriately given the pneumococcal vaccine 98.3%
In line with Minnesota average

Minnesota average: 97.3%

Influenza Vaccine Info Percent of long-stay residents assessed and appropriately given the seasonal influenza vaccine 98.4%
In line with Minnesota average

Minnesota average: 96.0%

Short-stay resident measures
Below average Minnesota avg: 2.7 Info CMS star rating based on short-stay quality measure performance. 5 stars = much above average, 1 star = much below average.
Pneumococcal Vaccine Info Percent of short-stay residents assessed and appropriately given the pneumococcal vaccine 96.9%
9% better than Minnesota average

Minnesota average: 88.9%

Antipsychotic medication increase Info Percent of short-stay residents who newly received an antipsychotic medication 2.9%
49% worse than Minnesota average

Minnesota average: 1.9%

Influenza Vaccine Info Percent of short-stay residents assessed and appropriately given the seasonal influenza vaccine 87.9%
6% better than Minnesota average

Minnesota average: 82.6%

Re-hospitalized after SNF stay Info Percentage of short-stay residents who were re-hospitalized after their nursing home admission. 33.5%
45% worse than Minnesota average

Minnesota average: 23.1%

Emergency department visits Info Percentage of short-stay residents who had an outpatient emergency department visit. 19.9%
42% worse than Minnesota average

Minnesota average: 14.0%

Falls with major injury Info Percentage of SNF residents who experience falls with major injury during their stay. 0.0%
100% better than Minnesota average

Minnesota average: 0.8%

Ability to care for self at discharge Info Percentage of residents at or above expected ability to care for themselves at discharge. 50.0%
7% worse than Minnesota average

Minnesota average: 53.7%

Successful return to home or community Info Rate of successful return to home or community from a skilled nursing facility. 47.0%
7% worse than Minnesota average

Minnesota average: 50.6%

Penalties and fines

Federal penalties imposed by CMS for regulatory violations, including civil money penalties (fines) and denials of payment for new Medicare/Medicaid admissions.

Source: CMS Penalties Database (Data as of Jan 2026)

Total fines amount $32K
28% lower than Minnesota average

Minnesota average: $44K

Number of fines 2
In line with Minnesota average

Minnesota average: 2.0

Payment Denials Info Serious action where Medicare and/or Medicaid temporarily stops payments for new residents until issues are fixed. 1
130% more payment denials than Minnesota average

Minnesota average: 0.4

Fines amount comparison
This facility $32K
Minnesota average $44K
Penalty History

Penalties are imposed by CMS for violations of federal nursing home regulations.

Civil Money Penalty Info Fines imposed for noncompliance, which can be assessed per day or per instance of violation. Aug 25, 2023
$16K
Payment Denial Info Serious action where Medicare and/or Medicaid temporarily stops payments for new residents until issues are fixed. Aug 25, 2023
7 days
Civil Money Penalty Info Fines imposed for noncompliance, which can be assessed per day or per instance of violation. Jun 2, 2023
$16K

Last updated: Jan 2026

Guides for Better Senior Living

Care Cost Calculator: See Prices in Your Area

Nursing Home Data Explorer

Don’t Wait Too Long: 7 Red Flag Signs Your Parent Needs Assisted Living Now

The True Cost of Assisted Living in 2025 – And How Families Are Paying For It

Understanding Senior Living Costs: Pricing Models, Discounts & Financial Assistance

Financial Aid for Minnesota Seniors

Get financial aid guidance

Elderly Waiver

Minnesota Medicaid EW

Age 65+, Minnesota resident, Medicaid-eligible, nursing home-level care need.

~$2,829/month (300% FBR, individual).

$3,000 (individual, higher than most states).

Higher asset limit; rural access focus.

Essential Community Supports (ECS)

Minnesota ECS

Age 65+, Minnesota resident, at risk of decline but not nursing home level.

~$1,732/month (individual, varies).

$3,000 (individual).

Bridges gap for those ineligible for waivers.

Alternative Care (AC) Program

Minnesota Alternative Care Program

Age 65+, Minnesota resident, NFLOC, not MA-eligible.

~$1,255-$2,829/month (100%-300% FPL); sliding scale copays.

$3,000 (individual); home equity limit $713,000.

CDCS option; statewide via counties.

Minnesota Senior Health Options (MSHO)

Minnesota Senior Health Options

Age 65+, Minnesota resident, eligible for MA and Medicare Parts A/B.

~$1,255/month (100% FPL for MA); spenddown allowed.

$3,000 (individual), $6,000 (couple).

7 health plans (e.g., UCare, HealthPartners); care coordinator assigned.

Minnesota Senior Care Plus (MSC+)

Minnesota Senior Care Plus

Age 65+, Minnesota resident, MA-eligible, not on Medicare.

~$1,255/month (100% FPL); spenddown allowed.

$3,000 (individual), $6,000 (couple).

Includes EW services; 7 health plans available.

Consumer Support Grant (CSG)

Minnesota Consumer Support Grant

Age 65+ or disabled, Minnesota resident, eligible for MA personal care but opts for grant.

~$1,255/month (MA-eligible); spenddown allowed.

$3,000 (individual).

Can hire family; statewide via counties.

Medicare Savings Program (MSP)

Minnesota Medicare Savings Program

Age 65+ or disabled, Minnesota resident, Medicare Part A/B.

~$2,510/month (QMB), ~$3,380/month (SLMB), ~$3,598/month (QI)—individual.

$9,430 (individual), $14,130 (couple).

Three tiers; no waitlist; includes Extra Help for Part D.

VA Aid and Attendance (A&A) and Housebound Benefits

Minnesota VA Aid and Attendance/Housebound

Age 65+ or disabled veteran/spouse, Minnesota resident, wartime service, need for ADL help (A&A) or homebound.

Net income < ~$1,984/month (veteran with dependent, A&A); pension offsets income.

~$155,356 (net worth limit).

High veteran demand in rural/urban areas.

Tour Icon
Planning a tour? Check our touring checklist.
Chat Icon
Thinking of living here? We can help you speak to a current resident