3030 Park by Senior Living Hospitality
Nursing Home, Assisted Living, Independent Living & Memory Care · Bridgeport, CT
CMS overall rating Info CMS (the Centers for Medicare & Medicaid Services) is the federal agency that rates nursing home quality. Its Overall Rating runs from 1 to 5 stars, combining health inspections, staffing, and quality measures, with inspections weighted most heavily.

3030 Park by Senior Living Hospitality

Nursing Home, Assisted Living, Independent Living & Memory Care · Bridgeport, CT
CMS overall rating Info CMS (the Centers for Medicare & Medicaid Services) is the federal agency that rates nursing home quality. Its Overall Rating runs from 1 to 5 stars, combining health inspections, staffing, and quality measures, with inspections weighted most heavily.
Calculator: See prices in your area
3030 Park by Senior Living Hospitality accepts Medicare and private pay.

Overview of 3030 Park by Senior Living Hospitality

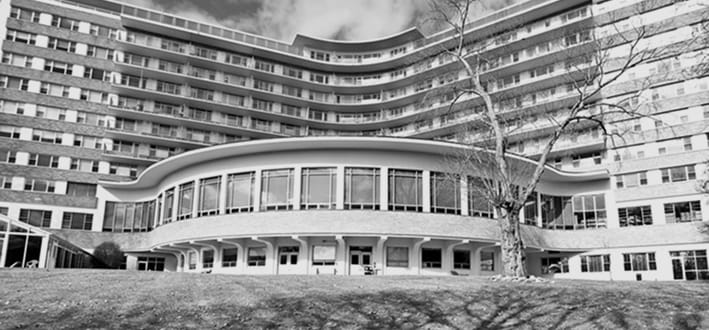
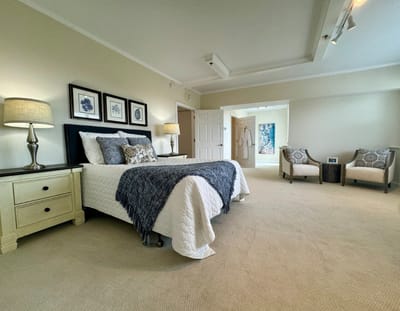
3030 Park is an upscale retirement community in Bridgeport, CT, that offers a wide range of care options, including independent living, assisted living, memory care, rehabilitation, and skilled nursing. Featuring a variety of specially designed apartments in a supportive and home-like environment, the community ensures older adults are comfortable and safe. A maintenance-free living is also guaranteed, as top-notch services like 24-hour care, restaurant-style dining, and maintenance services are provided. Through personalized care plans, residents receive high-quality care based on their needs and preferences.

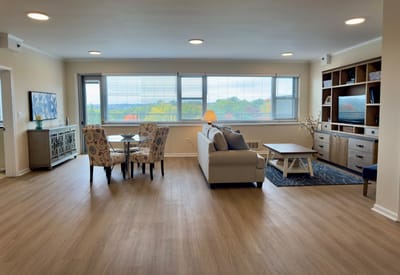
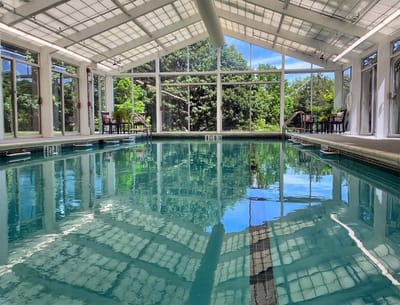
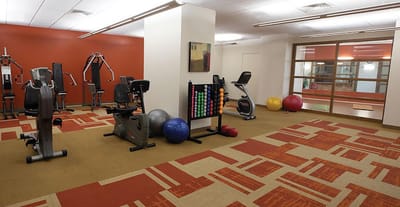
Fitness exercises, recreational activities, and social events ensure residents can explore new hobbies and gain meaningful experiences. Residents can also relax and interact with friends, with state-of-the-art amenities, including the indoor pool, lounge area, and beautiful outdoors. Public transportation and other local amenities are located nearby, making it easier for residents to travel to their appointments. This retirement community is a good option for senior living in Connecticut, as it has high standards of care and well-maintained amenities.

(203) 374-5611

Quality ratings

Measured by Centers for Medicare & Medicaid Services (CMS)

Overall rating Info The Overall CMS Rating combines results from health inspections, staffing levels and quality measures. Health inspections carry the most weight. Staffing and quality scores can increase or decrease the final rating based on performance compared to state and national standards.
▲ 64.4% Above CT avg. ▲ 64.4% Above CT avg.CT average: 3.0Click the badge to see the full State ranking.Click here to see the full State ranking.
Health Inspection Info Based on the results of the facility's three most recent standard inspections and any complaint investigations. CMS reviews the number, scope, and severity of deficiencies, with more recent findings weighted more heavily.
▲ 43.0% Above CT avg. ▲ 43.0% Above CT avg.CT average: 2.8Click the badge to see the full State ranking.Click here to see the full State ranking.
Staffing Info Measures average nursing staff hours per resident per day, including Registered Nurses (RNs) and total nursing staff. Ratings are adjusted based on the level of care residents require and are compared to state and national benchmarks.
▲ 23.3% Above CT avg. ▲ 23.3% Above CT avg.CT average: 3.2Click the badge to see the full State ranking.Click here to see the full State ranking.
Quality Measures Info Based on clinical and physical health indicators reported to CMS, such as hospital readmissions, falls, pressure ulcers, and improvements in mobility. These measures reflect how well residents' health needs are being managed.
▲ 42.1% Above CT avg. ▲ 42.1% Above CT avg.CT average: 3.5Click the badge to see the full State ranking.Click here to see the full State ranking.

Staffing hours breakdown

Info Daily nursing hours per resident by staff type, reported to CMS. Higher is generally better — compare this facility to state and national averages to see where staffing stands.

Hours per resident per day — compared to Connecticut state averages

Total nursing care / resident Info This home is ranked 7th out of 67 homes in Connecticut for nurse hours. Total adjusted nursing hours per resident per day, combining RN, LPN, and aide time. CMS adjusts this for case-mix so facilities can be fairly compared.
5h 30m per day
Rank #7 / 67Nurse hours — State benchmarkedThis home is ranked 7th out of 67 homes in Connecticut. Shows adjusted nurse hours per resident per day benchmarked to the Connecticut average, with a ranking across 67 Connecticut facilities. More hours mean more direct care. The national average is about 3.5 hrs; below 3.0 is a red flag.Ranking totals vary by category as each rank only includes facilities that report data for that metric. Homes missing that data point aren't included in the ranking.Click the rank badge to see the full State ranking.Click here to see the full State ranking.
This facility Connecticut avg (3h 58m per day)
vs Connecticut avg
+38%

0 of 6 metrics below state avg

Standout metric Registered Nurse (RN) is +198% above state avg
Staff typeHours / Day / Residentvs state avg
Registered Nurse (RN) Info RNs hold the highest nursing license and can assess residents, interpret test results, and direct care plans. More RN hours per day often signals stronger clinical oversight and faster response to health changes. 2h 4m per day ▲ 198% State avg: 42m per day · National avg: 41m per day
LPN / LVN Info Licensed Practical Nurses (LPNs) or Licensed Vocational Nurses (LVNs) deliver routine hands-on care — medication administration, wound dressing, and monitoring vital signs. They work under RN supervision and make up a large share of daily bedside care. 1h 2m per day ▲ 22% State avg: 50m per day · National avg: 52m per day
Nurse Aide Info Certified Nurse Aides (CNAs) provide the most direct day-to-day assistance: bathing, dressing, feeding, and mobility. Nurse aide hours are typically the largest staffing category and directly affect residents' quality of life. 3h 7m per day ▲ 37% State avg: 2h 16m per day · National avg: 2h 20m per day
Weekend Total Nursing Info Combined nursing hours (RN + LPN + Nurse Aide) per resident per day on weekends. Staffing often drops on weekends — this figure reveals whether the facility maintains adequate coverage outside of weekday hours. 5h 18m per day ▲ 54% State avg: 3h 26m per day · National avg: 3h 27m per day
Physical Therapist Info Hours per resident per day provided by licensed Physical Therapists (PTs) or PT Assistants. PT services help residents recover mobility after injury or illness and are especially important for post-acute (short-stay) rehabilitation. 5m per day ▲ 3% State avg: 5m per day · National avg: 4m per day
Weekend RN Info Registered nurse hours specifically on weekends. Facilities sometimes reduce RN presence on Saturdays and Sundays — a low weekend RN figure compared to weekday hours can indicate reduced clinical oversight when most administrative staff are absent. 1h 12m per day ▲ 164% State avg: 27m per day · National avg: 29m per day

Capacity and availability

This home usually has availability

Lower occupancy than the Connecticut average: 84%
Occupancy rate
78.4% Rank #60 / 72Occupancy rate — State benchmarkedThis home is ranked 60th out of 72 homes in Connecticut. Shows this facility's occupancy rate versus the Connecticut average, with its Statewide rank out of 72. Higher occupancy signals strong local demand and financial stability.Ranking totals vary by category as each rank only includes facilities that report data for that metric. Homes missing that data point aren't included in the ranking.Click the rank badge to see the full State ranking.Click here to see the full State ranking.
Avg. Length of Stay
27 days
Bed community size
23-bed community Rank #117 / 123Bed count — State benchmarkedThis home is ranked 117th out of 123 homes in Connecticut. Shows this facility's certified or reported bed count compared to other Connecticut facilities. Larger communities may offer more amenities, programs, and on-site services for residents and families.Ranking totals vary by category as each rank only includes facilities that report data for that metric. Homes missing that data point aren't included in the ranking.Click the rank badge to see the full State ranking.Click here to see the full State ranking.
A smaller, more intimate setting that may offer a quieter environment and closer staff-resident interactions.
Years in operation
18 years in operation Rank #29 / 132Years in operation — State benchmarkedThis home is ranked 29th out of 132 homes in Connecticut. Shows how long this facility has been in operation compared to other Connecticut facilities. Longer operating histories may benefit residents, families, and staff.Ranking totals vary by category as each rank only includes facilities that report data for that metric. Homes missing that data point aren't included in the ranking.Click the rank badge to see the full State ranking.Click here to see the full State ranking.
A longer operating history, which may indicate experience navigating regulations and delivering ongoing care.
Walk Score
Walk Score: 45 / 100 Rank #143 / 264Walk Score — State benchmarkedThis home is ranked 143rd out of 264 homes in Connecticut. Shows how walkable this facility's neighborhood is compared to the average Walk Score across Connecticut facilities. Higher scores benefit residents, families, and staff.Ranking totals vary by category as each rank only includes facilities that report data for that metric. Homes missing that data point aren't included in the ranking.Click the rank badge to see the full State ranking.Click here to see the full State ranking.
Somewhat walkable. A few nearby services may be reachable on foot, but most trips require transportation.

About this community

License Details

StatusActive
IssuanceJune 20, 2016
ExpirationMarch 31, 2026
License Number180

Staffing

Key information about the people who lead and staff this community.

Leadership

ContactMs. Kristin Butler, Executive Director

Therapy & Rehabilitation

2 services
Rehabilitation Services
Short-Term Rehab

Staffing & Medical

1 service
24-Hour Staffing

Memory & Specialized Care

1 service
No Alzheimer's certification

Additional Services

1 service
Rehabilitation & Skilled Nursing

Amenities & Lifestyle

Indoor Pool
Lounge Area
Movie Theater
Beautiful Outdoor Spaces
Fitness Center
Salon And Barber Services
Specific ProgramsPhysical, occupational and speech therapy

Pricing & Financial Information

IL$4,100 per month
AL$6,000 per month
MC$5,500 per month
Entry Fee$185,000

Contact 3030 Park by Senior Living Hospitality

Inspection History

In Connecticut, the Department of Public Health, Facility Licensing and Investigations Section conducts mandatory inspections and unannounced surveys to monitor the quality of care in long-term facilities.

Since 2018 · 8 years of data 1 deficiency 1 inspection

Inspection Scorecard Info This scorecard compares key inspection, citation, and complaint metrics at this facility against the Connecticut state average. Metrics rated ≥15% worse than average are highlighted in red; those ≥15% better are highlighted in green.

Since 2018 vs. Connecticut state average
Overall vs. CT average 0 Worse No metrics in this bucket. 4 Better Metrics better than Connecticut average:
• Total deficiencies (95% below)
• Deficiencies per year (96% below)
• Deficiencies per inspection (33% below)
• Total inspections (92% below)
Latest Inspection April 24, 2024

Deficiencies Info Deficiencies are formal regulatory issues recorded during state inspections.

This FacilityCT Averagevs. CT Avg
Total deficiencies Info Formal regulatory issues recorded by inspectors across all inspection types. 119 This facility has 95% fewer total deficiencies than a typical Connecticut nursing home (1 vs. CT avg 19).↓ 95% better
Deficiencies per year Info Average deficiencies per year since 2018. 0.12.4 This facility has 96% fewer deficiencies per year than a typical Connecticut nursing home (0.1 vs. CT avg 2.4).↓ 96% better
Deficiencies per inspection Info Average deficiencies per inspection. 11.5 This facility has 33% fewer deficiencies per inspection than a typical Connecticut nursing home (1 vs. CT avg 1.5).↓ 33% better

Inspections Info State inspections evaluate whether the facility meets health and safety standards.

This FacilityCT Averagevs. CT Avg
Total inspections Info Combined count of all routine and focused inspections. Excludes complaint investigations. 113 This facility has 92% fewer total inspections than a typical Connecticut nursing home (1 vs. CT avg 13).↓ 92% better

Inspection Reports Summary Info An editor-reviewed summary of the themes and findings across this facility's recent inspection reports.

  • May 15, 2018 inspection found one deficiency for failure of the assisted living supervisor to oversee vaccine administration and review documentation accuracy.
  • No complaints were substantiated during the May 15, 2018 licensing inspection.
  • Deficiency involved medication oversight, specifically incorrect vaccine administration route by a Licensed Practical Nurse without proper supervisory review.

Health Inspection History

Inspections since 2023
Total health inspections 3

Connecticut average 5.7


Last Health inspection on Feb 2025

Total health citations
15 Rank #10 / 69Health citations — State benchmarkedThis home is ranked 10th out of 69 homes in Connecticut. Shows this facility's total health deficiency citations benchmarked to the Connecticut State average, with a ranking across all 69 CT facilities. Lower citation counts earn a better rank.Ranking totals vary by category as each rank only includes facilities that report data for that metric. Homes missing that data point aren't included in the ranking.Click the rank badge to see the full State ranking.Click here to see the full State ranking.

Connecticut average 32

Citations per inspection
5 Rank #28 / 69Citations per inspection — State benchmarkedThis home is ranked 28th out of 69 homes in Connecticut. Shows average deficiency citations per CMS inspection for this facility versus the Connecticut mean across 69 facilities with citation data. Lower is better.Ranking totals vary by category as each rank only includes facilities that report data for that metric. Homes missing that data point aren't included in the ranking.Click the rank badge to see the full State ranking.Click here to see the full State ranking.

Connecticut average 5.82


Health citations are formal notices following inspections when they fail to comply with safety and care standards.

13 of 15 citations resulted from standard inspections; and 2 of 15 resulted from complaint investigations.

Breakdown of citation severity (last 3 years)
Critical health citations
0
100% better than Connecticut average

Connecticut average: 0.3


Serious health citations
1
43% worse than Connecticut average

Connecticut average: 0.7

0 critical citations Connecticut average: 0.3

1 serious citation Connecticut average: 0.7

14 moderate citations Connecticut average: 28.8

0 minor citations Connecticut average: 2.3
Citations history (last 3 years)
Infection Control moderate citation Feb 11, 2025
Corrected

Quality of Care moderate citation Feb 11, 2025
Corrected

Quality of Care moderate citation Feb 11, 2025
Corrected

Quality of Care moderate citation Feb 11, 2025
Corrected

Staffing Data

Reporting period: October 1 – December 31, 2025 (Q4 2025). Source: CMS Payroll-Based Journal report.

Total staff 80
Employees 54
Contractors 26
Staff to resident ratio 3.64 : 1
95% more staff per resident than Connecticut average
Connecticut average ratio: 1.86 : 1 Connecticut average ratio: 1.86 : 1See full Connecticut ranking
Avg staff/day 24
Average shift 6.8 hours
9% worse than Connecticut average
Connecticut average: 7.5 hours Connecticut average shift: 7.5 hoursSee full Connecticut ranking
Total staff hours (quarter) 14,938

Nursing staff breakdown

Q4 2025 · Oct 1 – Dec 31 More info This data comes from the CMS Payroll-Based Journal report covering October 1 – December 31, 2025.
Registered Nurse

Manages medical care and health needs.

RN Staff Info All 12 RN Staff are full-time employees. No contractors work on this role. 12
Average shift length Info Average shift length. Calculated as total hours divided by days worked and average staff per day. 8.8 hours
Licensed Practical Nurse

Assists with medical care and medications.

LPN Staff Info All 8 LPN Staff are full-time employees. No contractors work on this role. 8
Average shift length Info Average shift length. Calculated as total hours divided by days worked and average staff per day. 7.4 hours
Certified Nursing Assistant

Helps with daily care and mobility.

CNA Staff Info All 26 CNA Staff are full-time employees. No contractors work on this role. 26
Average shift length Info Average shift length. Calculated as total hours divided by days worked and average staff per day. 7.1 hours

Contractor staffing

Q4 2025 · Oct 1 – Dec 31 More info This data comes from the CMS Payroll-Based Journal report covering October 1 – December 31, 2025.

Total hours from contractors

10.9%

1,625 contractor hours this quarter

Speech Language Pathologist: 6 Respiratory Therapy Technician: 5 Physical Therapy Aide: 5 Occupational Therapy Assistant: 5 Qualified Social Worker: 2 Physical Therapy Assistant: 2 Medical Director: 1

Staff by category

Q4 2025 · Oct 1 – Dec 31 More info This data comes from the CMS Payroll-Based Journal report covering October 1 – December 31, 2025.
Certified Nursing Assistant260265,82492100%7.1
Registered Nurse120122,59492100%8.8
Licensed Practical Nurse8081,92492100%7.4
Mental Health Service Worker2029285863%8
Clinical Nurse Specialist2028146470%8.2
Nurse Practitioner1014565762%8
Speech Language Pathologist0664467379%5.4
Physical Therapy Assistant0224266166%5.9
Occupational Therapy Aide1013184043%8
Physical Therapy Aide0553125762%5.2
Administrator1012445560%4.4
Other Social Services Staff1012115661%3.8
Qualified Social Worker0222095964%3.5
Respiratory Therapy Technician0551555762%2.6
Medical Director011582628%2.2
Occupational Therapy Assistant055183134%0.6
26 Certified Nursing Assistant
% of Days 100%
12 Registered Nurse
% of Days 100%
8 Licensed Practical Nurse
% of Days 100%
2 Mental Health Service Worker
% of Days 63%
2 Clinical Nurse Specialist
% of Days 70%
1 Nurse Practitioner
% of Days 62%
6 Speech Language Pathologist
% of Days 79%
2 Physical Therapy Assistant
% of Days 66%
1 Occupational Therapy Aide
% of Days 43%
5 Physical Therapy Aide
% of Days 62%
1 Administrator
% of Days 60%
1 Other Social Services Staff
% of Days 61%
2 Qualified Social Worker
% of Days 64%
5 Respiratory Therapy Technician
% of Days 62%
1 Medical Director
% of Days 28%
5 Occupational Therapy Assistant
% of Days 34%

Penalties and fines

Includes penalties issued in 2024

Federal penalties imposed by CMS for regulatory violations, including civil money penalties (fines) and denials of payment for new Medicare/Medicaid admissions.

Source: CMS Penalties Database (Data as of Jan 2026)

Total fines amount $8K Rank #37 / 69Federal fines — State benchmarkedThis home is ranked 37th out of 69 homes in Connecticut. Shows this facility's cumulative CMS federal fine dollars versus the Connecticut average among facilities with fines, and where it ranks among 69 facilities in the pool. Lower total dollars mean a better rank.Ranking totals vary by category as each rank only includes facilities that report data for that metric. Homes missing that data point aren't included in the ranking.Click the rank badge to see the full State ranking.Click here to see the full State ranking.
82% lower than Connecticut average

Connecticut average: $44K

Number of fines 1
43% fewer fines than Connecticut average

Connecticut average: 1.7

Payment Denials Info Serious action where Medicare and/or Medicaid temporarily stops payments for new residents until issues are fixed. 0
100% fewer payment denials than Connecticut average

Connecticut average: 0.1

Fines amount comparison
This facility $8K
Connecticut average $44K
Penalty History

Penalties are imposed by CMS for violations of federal nursing home regulations.

1 penalty in the past 3 years

Mar 21, 2024 · $8K

Civil Money Penalty Info Fines imposed for noncompliance, which can be assessed per day or per instance of violation. Mar 21, 2024
$8K

Last updated: Jan 2026

Quality of care over time

These measures show how residents usually do over time at this home, based on health outcomes and preventive care.

High-risk clinical events score Info A composite score based on pressure ulcers, falls with injury, weight loss, walking ability decline, and activities of daily living decline. 3.1
70% better than Connecticut average

Connecticut average: 10.4

Functional decline score Info A composite score based on activities of daily living decline, walking ability decline, and incontinence. 31.7
51% worse than Connecticut average

Connecticut average: 21.1

Long-stay resident measures
Low Risk Residents with Bowel/Bladder Incontinence Info Percent of low risk long-stay residents who lose control of their bowels or bladder 31.7%
27% worse than Connecticut average

Connecticut average: 24.9%

Falls with Major Injury Info Percent of long-stay residents experiencing one or more falls with major injury 0.0%
100% better than Connecticut average

Connecticut average: 3.5%

High Risk Residents with Pressure Ulcers Info Percent of long-stay high risk residents with pressure ulcers 1.0%
79% better than Connecticut average

Connecticut average: 4.6%

Urinary Tract Infection Info Percent of long-stay residents with a urinary tract infection 4.7%
176% worse than Connecticut average

Connecticut average: 1.7%

Lost Too Much Weight Info Percent of long-stay residents who lose too much weight 8.3%
33% worse than Connecticut average

Connecticut average: 6.3%

Depressive Symptoms Info Percent of long-stay residents who have depressive symptoms 0.0%
100% better than Connecticut average

Connecticut average: 15.2%

Antipsychotic Use Info Percent of long-stay residents who received an antipsychotic medication 11.6%
32% better than Connecticut average

Connecticut average: 17.2%

Pneumococcal Vaccine Info Percent of long-stay residents assessed and appropriately given the pneumococcal vaccine 100.0%
14% better than Connecticut average

Connecticut average: 87.5%

Short-stay resident measures
Pneumococcal Vaccine Info Percent of short-stay residents assessed and appropriately given the pneumococcal vaccine 97.7%
39% better than Connecticut average

Connecticut average: 70.1%

Antipsychotic medication increase Info Percent of short-stay residents who newly received an antipsychotic medication 1.0%
34% better than Connecticut average

Connecticut average: 1.5%

Influenza Vaccine Info Percent of short-stay residents assessed and appropriately given the seasonal influenza vaccine 96.3%
38% better than Connecticut average

Connecticut average: 69.8%

Breakdown by payment type

Medicare

47% of new residents, usually for short-term rehab.

Typical stay 16 days

Private pay

53% of new residents, often for short stays.

Typical stay 5 - 6 months

Facility Characteristics

Source: CMS Long-Term Care Facility Characteristics (Data as of Jan 2026)

Total residents 22
Medicare
9
40.9% of residents
Private pay or other
13
59.1% of residents
Programs & Services
Residents Group

Residents meet regularly to discuss policies, care quality, and activities

Nurse Aide Training

State-approved Nurse Aide Training and Competency Evaluation Program on-site

CCRC

Part of a Continuing Care Retirement Community offering multiple care levels

Active Resident Council

Organized group of residents that meets regularly to discuss facility policies, quality of life, and activities.

Finances and operations

Based on CMS SNF Cost Report for fiscal year ending in 12/2023.

Voluntary non-profit community
Operated by a church.
Net patient revenue Info Net patient revenue — what the home actually collects for resident care, after contractual allowances, bad debt and discounts are subtracted from its gross charges (CMS cost report, Worksheet G-3). It covers resident care only; money the home earns from other sources is shown separately as "Other income."
$21.2M
Net patient income Info Net patient income: net patient revenue minus the home's total operating expenses. A positive figure means it earns more from resident care than it spends to deliver it; a negative figure means the opposite. It excludes non-operating "other income."
-$5.8M
Voluntary non-profit community Operated by a church.
Net patient revenue Info Net patient revenue — what the home actually collects for resident care, after contractual allowances, bad debt and discounts are subtracted from its gross charges (CMS cost report, Worksheet G-3). It covers resident care only; money the home earns from other sources is shown separately as "Other income."
$21.2M Rank #39 / 73Revenue — State benchmarkedThis home is ranked 39th out of 73 homes in Connecticut. Shows this facility's annual revenue compared to the Connecticut average. Higher revenue generally means more resources for staffing and capital — read alongside Payroll %.Ranking totals vary by category as each rank only includes facilities that report data for that metric. Homes missing that data point aren't included in the ranking.Click the rank badge to see the full State ranking.Click here to see the full State ranking.
Net patient income Info Net patient income: net patient revenue minus the home's total operating expenses. A positive figure means it earns more from resident care than it spends to deliver it; a negative figure means the opposite. It excludes non-operating "other income."
-$5.8M
Other income Info Money the home earns outside of resident care — such as investments, grants, rentals and other non-operating sources (CMS cost report, Worksheet G-3). It is tracked separately from net patient revenue: it is not part of that figure, and it is not included in net patient income.
$610.4K
Payroll costs Info Staff salaries plus wage-related costs — benefits such as payroll taxes, health insurance and retirement — from the home's own accounting records (CMS cost report, Worksheet A). Contract or agency labor is counted separately, under other operating costs. Rank #43 / 73Payroll — State benchmarkedThis home is ranked 43rd out of 73 homes in Connecticut. Shows total annual staff payroll benchmarked to the Connecticut average. Higher payroll investment relative to peers often signals better staffing and less reliance on cheaper contract labor.Ranking totals vary by category as each rank only includes facilities that report data for that metric. Homes missing that data point aren't included in the ranking.Click the rank badge to see the full State ranking.Click here to see the full State ranking.
$9.3M 43.7% of net patient revenue Info Payroll as a share of revenue: staff salaries and wage-related benefits divided by net patient revenue. A higher figure means more of each revenue dollar goes to staff pay. Rank #46 / 73Payroll % — State benchmarkedThis home is ranked 46th out of 73 homes in Connecticut. Shows payroll as a percentage of revenue versus the Connecticut average. Well-run Connecticut facilities typically land around 51–66% — the top third Statewide. Below 25% may signal understaffing or heavy agency use — read with Staffing ratings.Ranking totals vary by category as each rank only includes facilities that report data for that metric. Homes missing that data point aren't included in the ranking.Click the rank badge to see the full State ranking.Click here to see the full State ranking.
Other operating costs Info Everything it costs to run the home apart from payroll — food, utilities, supplies, maintenance, contract labor and administration. Calculated as total operating expense minus payroll (staff salaries and wage-related benefits).
$17.8M
Total costs Info The home's total operating expense for the year — all the costs of running it, salaries included (CMS cost report, Worksheet G-3).
$27.1M

What does this home offer?

Housing options icon

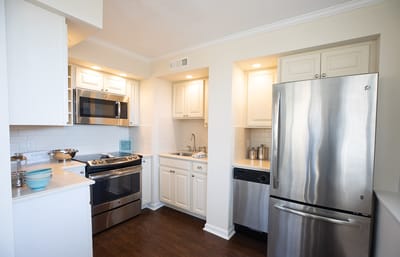
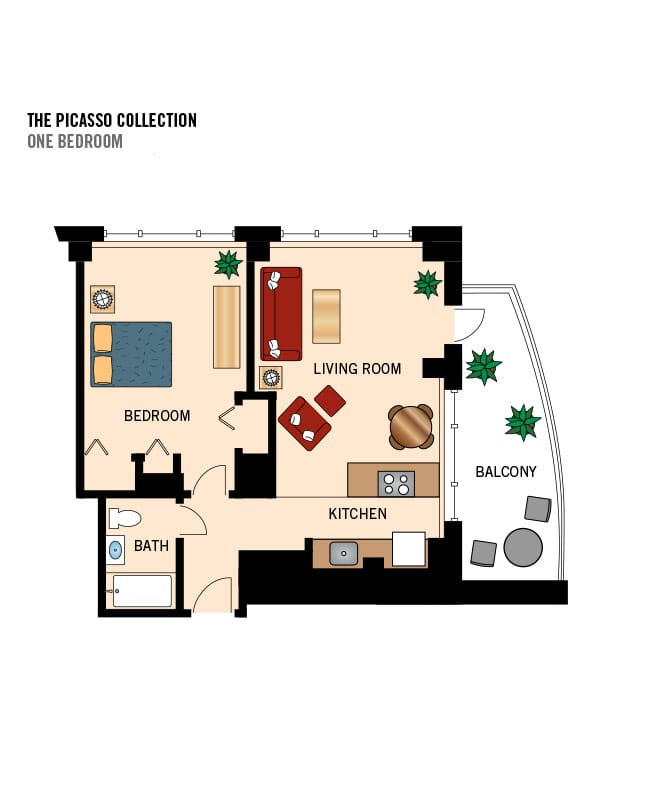
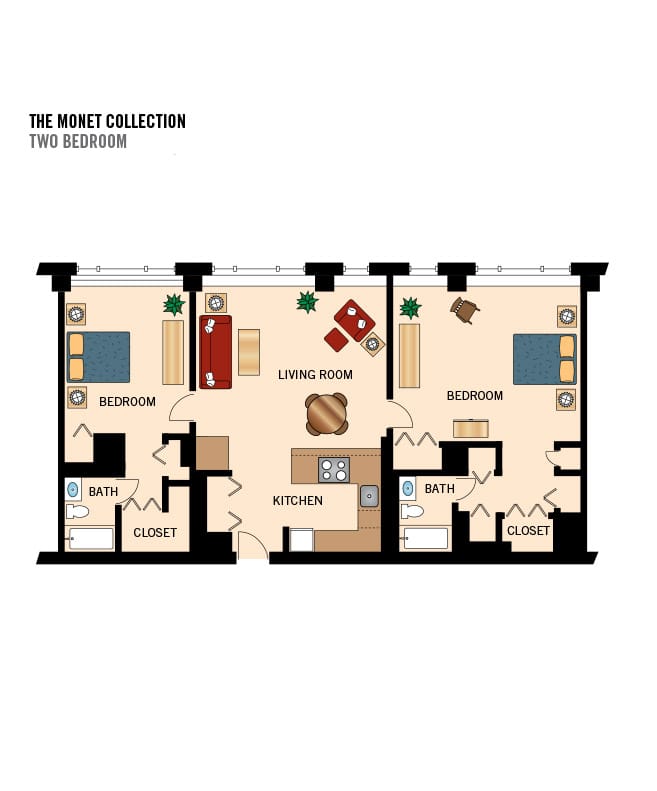
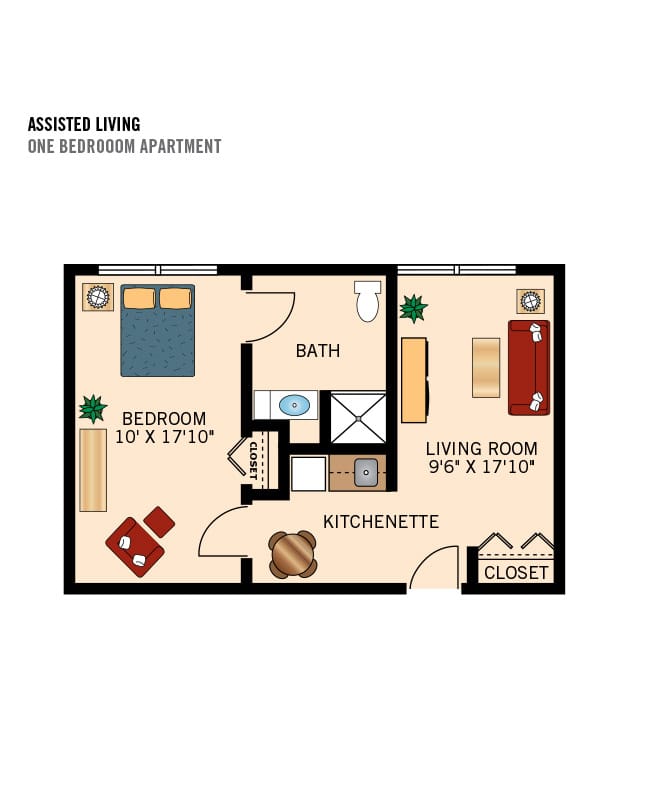
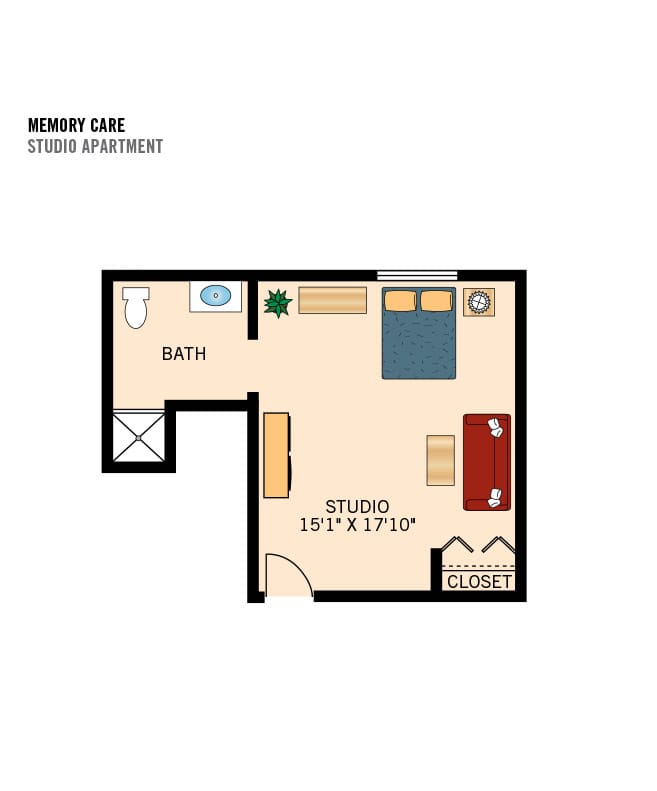
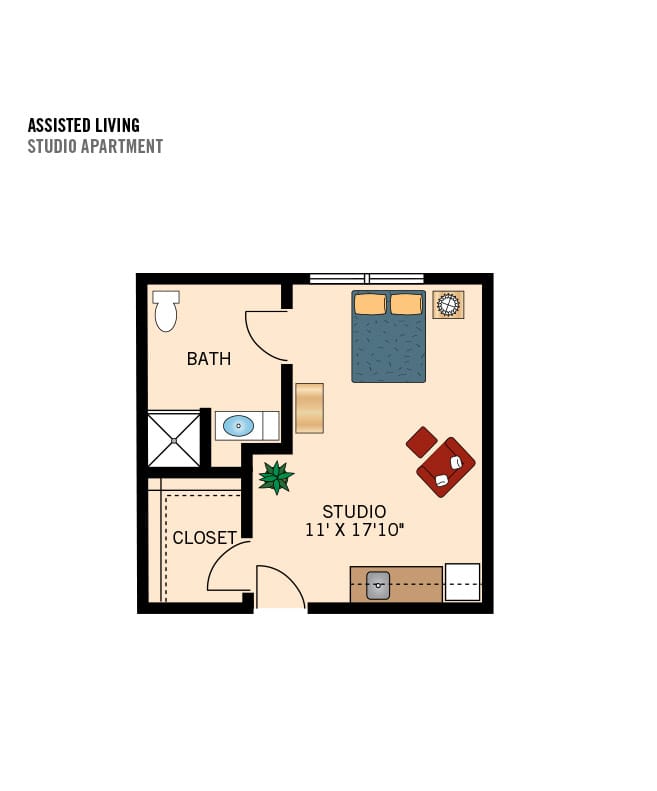
Housing Options: Studio / 1 Bed / 2 Bed

Building type icon
Building type icon

Building Type: High-rise

Beauty services icon

Beauty Services

Social and recreational activities icon

Social and Recreational Activities

Exercise program icon

Exercise Programs

Swimming pool icon
Swimming pool icon

Swimming Pool

Who this home usually serves

TYPE OF STAY

Mix of rehab and long-term care

This home supports both short-term rehab and long-term care, with residents staying for a wide range of durations.

Most new residents arrive under private pay (53% of admissions), and a typical private pay stay runs around 5 - 6 months.

Admissions
193 total

Coverage residents most often arrive under.

Medicare 47%
Private pay 53%
Discharges
227 total

Coverage residents most often leave under.

Medicare 44%
Private pay 56%

Living Spaces & Floor Plans for 3030 Park by Senior Living Hospitality

The Watermark At 3030 Park 1Br
The Watermark At 3030 Park 2Br
The Watermark At 3030 Park Al 1Br
The Watermark At 3030 Park Mc Studio
The Watermark At 3030 Park Studio
Independent Living Floor Plans
Download PDF
Independent Living Cottages Floor Plans
Download PDF
Assisted Living Floor Plans
Download PDF
Memory Care Floor Plans
Download PDF

Places of interest near 3030 Park by Senior Living Hospitality

Address 2.4 miles from city center Info Estimated distance in miles from Bridgeport's city center to 3030 Park by Senior Living Hospitality's address, calculated via Google Maps. — 2.77 miles to nearest hospital (Bridgeport Hospital)

Calculate Travel Distance to 3030 Park by Senior Living Hospitality

Add your location

Address

Compare Nursing Home around Bridgeport

The information below is reported by the Connecticut Department of Public Health, Facility Licensing and Investigations Section.

5 facilities compared · CMS & CT Dept. of Health data

3030 Park by Senior Living Hospitality
NH
AL
IL
MC
Bridgeport (Brooklawn/St. Vincent)
23
Facility 23
CT AVG 111
Rank #117 / 123
78.4%
Facility 78.4%
CT AVG 84%
Rank #60 / 72
-7%
5.50
Facility 5.50
CT AVG 3.97
Rank #7 / 67
+39%+38%
$8.0k
Facility $8.0k
CT AVG $43.8k
Rank #37 / 69
15
Facility 15
CT AVG 32.0
Rank #10 / 69
5.0
Facility 5.0
CT AVG 5.8
Rank #28 / 69
120-
45
Facility 45
CT AVG 47
Rank #143 / 264
Ct Watermark Operator LLC
$21.2M
Facility $21.2M
CT AVG $19.0M
Rank #39 / 73
$9.3M
Facility $9.3M
CT AVG $7.2M
Rank #43 / 73
43.7%
Facility 43.7%
CT AVG 42.4%
Rank #46 / 73
75440
Pomperaug Woods
NH
AL
HC
IL
MC
RC
Southbury (Southbury Historic District No. 1)
37
Facility 37
CT AVG 111
Rank #108 / 123
81.1%
Facility 81.1%
CT AVG 84%
Rank #55 / 72
-3%
5.75
Facility 5.75
CT AVG 3.97
Rank #2 / 67
+26%+45%
$20.9k
Facility $20.9k
CT AVG $43.8k
Rank #54 / 69
14
Facility 14
CT AVG 32.0
Rank #8 / 69
7.0
Facility 7.0
CT AVG 5.8
Rank #54 / 69
128-
34
Facility 34
CT AVG 47
Rank #178 / 264
Dennis Fitzgerald
$12.8M
Facility $12.8M
CT AVG $19.0M
Rank #60 / 73
$6.8M
Facility $6.8M
CT AVG $7.2M
Rank #59 / 73
53.6%
Facility 53.6%
CT AVG 42.4%
Rank #19 / 73
75318
Ludlowe Center for Health and Rehabilitation
NH
HC
MC
PC
RC
Fairfield
144
Facility 144
CT AVG 111
Rank #31 / 123
91.0%
Facility 91.0%
CT AVG 84%
Rank #30 / 72
+8%
3.25
Facility 3.25
CT AVG 3.97
Rank #60 / 67
+31%-18%
$68.0k
Facility $68.0k
CT AVG $43.8k
Rank #65 / 69
21
Facility 21
CT AVG 32.0
Rank #21 / 69
3.0
Facility 3.0
CT AVG 5.8
Rank #3 / 69
3133-
33
Facility 33
CT AVG 47
Rank #181 / 264
Patricia Page
$25.1M
Facility $25.1M
CT AVG $19.0M
Rank #15 / 73
$13.4M
Facility $13.4M
CT AVG $7.2M
Rank #16 / 73
53.5%
Facility 53.5%
CT AVG 42.4%
Rank #43 / 73
75330
Jewish Senior Services
NH
AL
IL
MC
Bridgeport (North End)
294
Facility 294
CT AVG 111
Rank #3 / 123
97.6%
Facility 97.6%
CT AVG 84%
Rank #3 / 72
+16%
4.72
Facility 4.72
CT AVG 3.97
Rank #16 / 67
-22%+19%
$58.3k
Facility $58.3k
CT AVG $43.8k
Rank #60 / 69
23
Facility 23
CT AVG 32.0
Rank #25 / 69
4.6
Facility 4.6
CT AVG 5.8
Rank #21 / 69
2281-
36
Facility 36
CT AVG 47
Rank #173 / 264
Jewish Home For The Elderly Of Fairfield County Incorporated
$64.1M
Facility $64.1M
CT AVG $19.0M
Rank #1 / 73
$40.8M
Facility $40.8M
CT AVG $7.2M
Rank #1 / 73
63.6%
Facility 63.6%
CT AVG 42.4%
Rank #45 / 73
75353
Northbridge Health Care Center
NH
HC
MC
NC
RC
Bridgeport (Brooklawn/St. Vincent)
145
Facility 145
CT AVG 111
Rank #29 / 123
89.0%
Facility 89.0%
CT AVG 84%
Rank #37 / 72
+6%
3.85
Facility 3.85
CT AVG 3.97
Rank #29 / 67
-94%-3%
$57.3k
Facility $57.3k
CT AVG $43.8k
Rank #59 / 69
32
Facility 32
CT AVG 32.0
Rank #45 / 69
4.6
Facility 4.6
CT AVG 5.8
Rank #21 / 69
2125-
75
Facility 75
CT AVG 47
Rank #46 / 264
Erica Roman
$16.5M
Facility $16.5M
CT AVG $19.0M
Rank #16 / 73
$11.8M
Facility $11.8M
CT AVG $7.2M
Rank #24 / 73
71.3%
Facility 71.3%
CT AVG 42.4%
Rank #68 / 73
75413

Financial Assistance for
Nursing Home in Connecticut

3030 Park by Senior Living Hospitality is located in Bridgeport, Connecticut.
Here are the financial assistance programs available to residents in Connecticut.

Get Financial aid guidance

Connecticut Home Care Program for Elders

CHCPE

Age 65+
General Connecticut resident, at risk of nursing home placement.
Income Limits State-funded: ~$1,600/month; Medicaid: ~$2,829/month 300% FBR
Asset Limits $1,600 (state), $2,000 (Medicaid, individual).
CT

Two tiers (state and Medicaid); waitlists possible.

Benefits
In-home care (4-6 hours/day) Adult day care (~$70/day) Meals Respite (up to 14 days/year)

Statewide Respite Care Program

CT Respite Care

Age
General Caregiver of senior with dementia, Connecticut resident.
Income Limits ~$2,500/month individual, varies
Asset Limits $40,000 individual
CT

Limited to dementia caregivers; capped funding.

Benefits
In-home respite (up to 30 days/year) Adult day care (~$70/day)

Congregate Housing Services Program (CHSP)

Connecticut Congregate Housing Services Program

Age 62+
General Connecticut resident, frail but not needing 24/7 care, resides in CHSP-eligible housing.
Income Limits (2025) ~$41,000/year individual, adjusted annually
Asset Limits Not specified; focus is income-based.
CT

Limited to 14 state-subsidized sites; participants pay 10% of service costs.

Benefits
Personal care (3-5 hours/day) Meals ($5-$7/meal) Housekeeping Transportation (~5 trips/month)

Medicare Savings Program (MSP)

Connecticut Medicare Savings Program

Age 65+ or disabled
General Connecticut resident, enrolled in Medicare Part A/B.
Income Limits (2025) ~$2,510/month (individual, QMB); ~$3,380/month (SLMB); ~$3,598/month (ALMB)—adjusted annually.
Asset Limits None since 2023 policy change.
CT

Three tiers (Qualified Medicare Beneficiary, Specified Low-Income, Additional Low-Income); no asset test.

Benefits
Covers Medicare Part B premiums ($174.70/month) Deductibles ($240/year) Copays (~20% of services)

Frequently Asked Questions about 3030 Park by Senior Living Hospitality

What neighborhood is 3030 Park by Senior Living Hospitality in?

3030 Park by Senior Living Hospitality is in the Brooklawn/St. Vincent neighborhood of Bridgeport.

Is 3030 Park by Senior Living Hospitality in a walkable area?

3030 Park by Senior Living Hospitality has a walk score of 45. Somewhat walkable. A few nearby services may be reachable on foot, but most trips require transportation.

What is the license number of 3030 Park by Senior Living Hospitality?

According to CT state health department records, 3030 Park by Senior Living Hospitality's license number is 180.

When does 3030 Park by Senior Living Hospitality's license expire?

According to CT state health department records, 3030 Park by Senior Living Hospitality's license expires on March 31, 2026.

What is the occupancy rate at 3030 Park by Senior Living Hospitality?

3030 Park by Senior Living Hospitality's occupancy is 78.4%.

Does 3030 Park by Senior Living Hospitality have different floorplan options?

Yes — see the floorplan options available at 3030 Park by Senior Living Hospitality on this page.

Are there photos of 3030 Park by Senior Living Hospitality?

Yes — there are 7 photos of 3030 Park by Senior Living Hospitality in the photo gallery on this page.

Guides for Better Senior Living

Care Cost Calculator: See Prices in Your Area

Nursing Home Data Explorer

Don’t Wait Too Long: 7 Red Flag Signs Your Parent Needs Assisted Living Now

The True Cost of Assisted Living in 2025 – And How Families Are Paying For It

Understanding Senior Living Costs: Pricing Models, Discounts & Financial Assistance