Nursing Home

The Wesleyan at Scenic

Nursing Home

The Wesleyan at Scenic

4011 Williams Dr, Georgetown, TX 78628 View map
Overview of The Wesleyan at Scenic

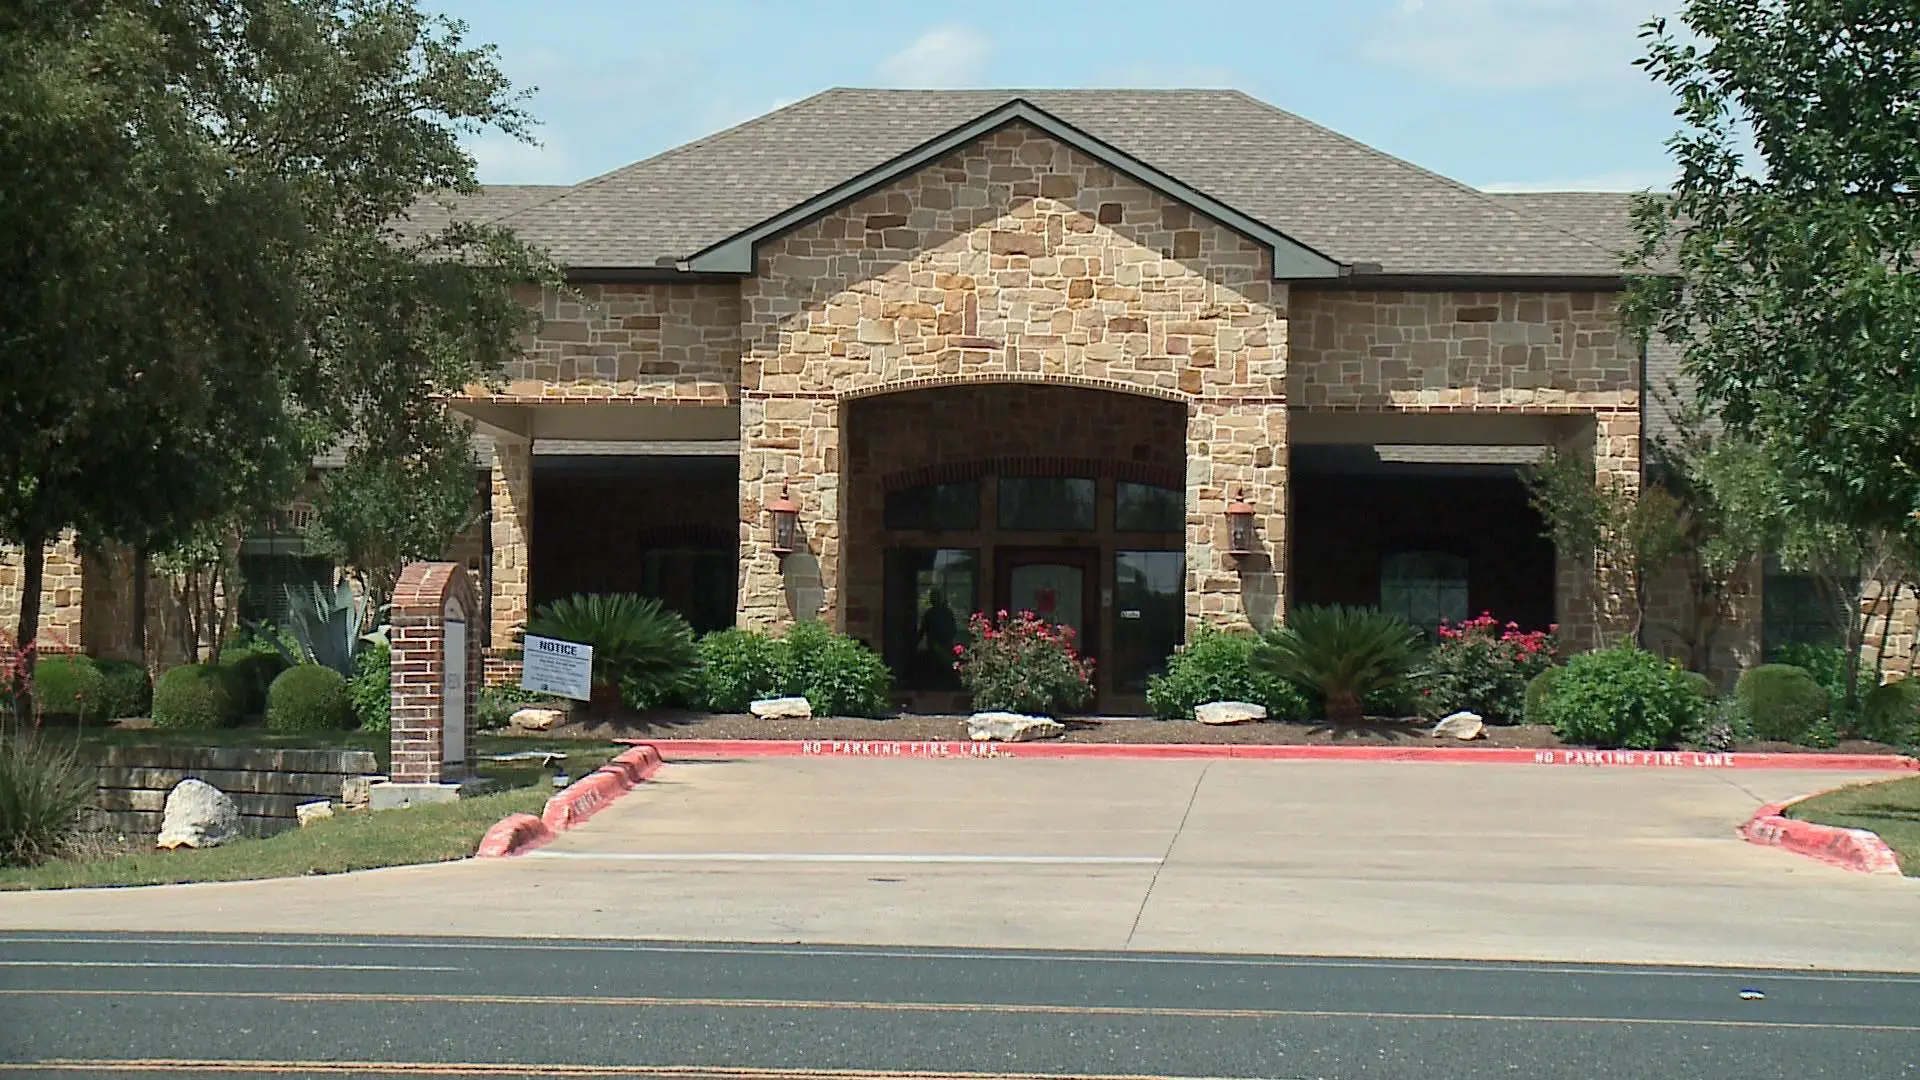
Situated in The Wesleyan Senior Living Community in Georgetown, TX, The Wesleyan Skilled Nursing provides compassionate care and comprehensive support for seniors requiring specialized attention. This facility prides itself as more than just a healthcare provider, but also a nurturing environment where residents receive expert care while enjoying a rich and engaging lifestyle. The presence of master-level dieticians, IV/antibiotic therapy, diabetic care, and specialized wound care underscores the facility’s commitment to holistic well-being. In-house Board Certified Internal Medicine Physicians and Nurse Practitioners, coupled with low resident to staff ratios, guarantee personalized and attentive medical care.

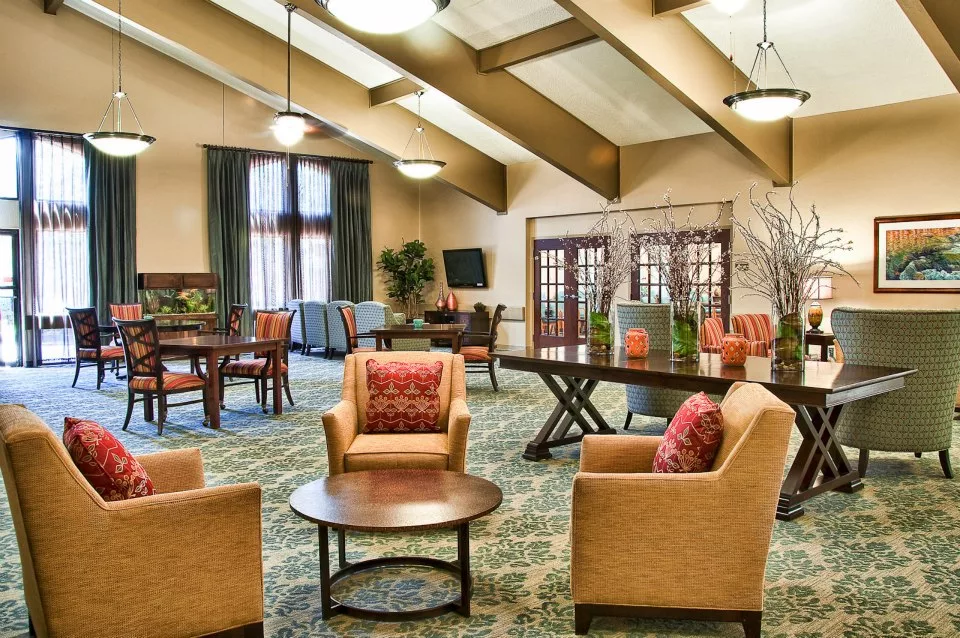
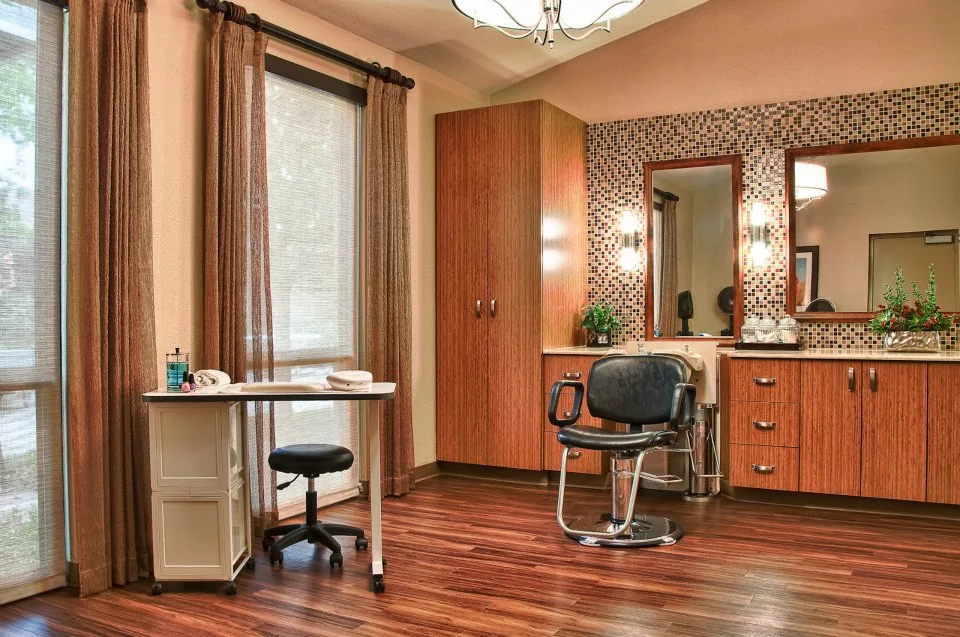
Residents at The Wesleyan Skilled Nursing experience unparalleled comfort and attention. From three chef-prepared meals daily to daily life enrichment activities, the facility ensures a vibrant atmosphere where residents thrive emotionally and socially. The facility also goes above and beyond, offering transportation to medical appointments, transition guidance within The Wesleyan Continuum of Care, and a range of recreational amenities, including inviting gathering rooms, an on-site chapel, computer stations with free Wi-Fi, and even a full-service beauty salon and barbershop. With a dedicated rehabilitation gym on-site, this skilled nursing facility ensures residents receive comprehensive care in an environment designed for both healing and comfort.

(972) 524-5221

Quality ratings

Measured by Centers for Medicare & Medicaid Services (CMS)

Overall rating Info Official CMS rating based on health inspections, staffing and quality measures.
2/5
Texas average: 3.0/5
Health Inspection Info Official CMS rating based on deficiencies found during state health inspections.
2/5
Texas average: 2.9/5
Staffing Info Official CMS rating based on nurse staffing hours per resident per day.
3/5
Texas average: 2.4/5
Quality Measures Info Official CMS rating based on clinical outcomes for residents.
4/5
Texas average: 4.0/5

Nursing care per resident

Info Average daily nursing hours per resident (adjusted for acuity). Higher values indicate more nursing time per resident.
4h 13m per day

This home provides 12% more nursing time per resident than the Texas average.

Texas average: 3h 46m per day

Staffing hours breakdown

Info Hours of care per resident per day, broken down by staff type. Data from CMS Medicare.
Staff type Facility State avg National avg
Registered Nurse (RN) Info Registered nurse hours per resident per day. 20m per day 21m per day 29m per day

Capacity and availability

Medium-capacity home

Offers a balance of services and community atmosphere.

Total beds 142

This home usually has availability

Lower occupancy suggests more openings may be available.

Lower demand than the Texas average
Occupancy rate 59%
Residents per day (avg) 71
Occupancy rate
59%
Residents per day (avg)
71

Who this home usually serves

TYPE OF STAY

Mix of rehab and long-term care

This home supports both short-term rehab and long-term care, with residents staying for a wide range of durations.

Breakdown by payment type

Medicare

42% of new residents, usually for short-term rehab.

Typical stay 21 days

Private pay

57% of new residents, often for short stays.

Typical stay 2 months

Medicaid

1% of new residents, often for long-term daily care.

Typical stay 10 - 11 years

Finances and operations

Governmental community
Operated by state authorities.
Home revenue
$10.9M
Operating deficit
-$839.5K
Governmental community Operated by state authorities.
Home revenue
$10,927,745.00
Operating deficit
$-839,468.00
Payroll costs Info The portion of the home's budget spent on staff, including nurses, caregivers, and other employees who support care and operations.
$5.3M
48.2% of revenue
Other operating costs Info All remaining costs needed to run the home, such as food, utilities, building maintenance, supplies and administrative expenses.
$6.5M
Total costs $11.8M
Walk Score
Walk Score: 17 / 100
Car-dependent. Most errands require a car, with limited nearby walkable options.

Types of Care at The Wesleyan at Scenic

Skilled Nursing Memory Care
Contact The Wesleyan at Scenic

Health Inspection History

Inspections
Total health inspections 5

Texas average 7.4


Last Health inspection on Apr 2025

Total health citations 16
Citations per inspection
3.2

Health citations are formal notices following inspections when they fail to comply with safety and care standards.

12 of 16 citations resulted from standard inspections; and 4 of 16 resulted from complaint investigations.

Breakdown of citation severity (last 3 years)
Critical Health citations More info 1
50% better than Texas average

Texas average: 2


Serious Health citations More info 0
100% better than Texas average

Texas average: 0.4

1 critical citation More info Texas average: 2

0 serious citations More info Texas average: 0.4

15 moderate citations More info Texas average: 23

0 minor citations More info Texas average: 0.4
Citations history (last 3 years)
Abuse/Neglect moderate citation Apr 30, 2025
Corrected

Infection Control moderate citation Apr 30, 2025
Corrected

Nutrition moderate citation Apr 30, 2025
Corrected

Pharmacy moderate citation Apr 30, 2025
Corrected

Compare Nursing Homes around Georgetown

The information below is reported by the Texas Health and Human Services Commission.
The Wesleyan at Scenic
AL

Assisted Living For seniors needing help with daily tasks but not full-time nursing.

MC

Memory Care Specialized care for those with Memory Loss, Alzheimer's, or dementia, ensuring safety and support.

SNF

Nursing Homes 24/7 care needed

Georgetown
142
17
THI OF TEXAS LLC
59.0%
$9,626,156.00
$5,270,111.00
54.7%
71.40
2/5
4.2089
2/5
3/5
4/5
1
16
1
-9%
+16%
-7%
Park Place Care Center
AL

Assisted Living For seniors needing help with daily tasks but not full-time nursing.

HC

Hospice Care

SNF

Nursing Homes 24/7 care needed

RC

Respite Care

Georgetown
116
39
KWOFIE, AMOS
74.3%
$20,834,157.00
$1,746,568.00
8.4%
97
1/5
3.3203
1/5
2/5
4/5
5
43
9
-9%
-9%
+17%

Places of interest near The Wesleyan at Scenic

Address 1.2 miles from city center — 3.52 miles to nearest hospital (Texas Oncology-Georgetown East)

Address 4011 Williams Dr, Georgetown, TX 78628

Calculate Travel Distance to The Wesleyan at Scenic

Add your location

Address

Staffing Data

Source: CMS Payroll-Based Journal (Q2 2025)

177
Total Staff
105
Employees
72
Contractors
30,732
Total Hours (Quarter)
47
Avg Staff/Day
7.2
Avg Shift (hrs)
Nursing Staff Breakdown
Role Count Avg Shift (hrs) Uses Contractors?
Registered Nurse126.9 Yes
Licensed Practical Nurse367.4 Yes
Certified Nursing Assistant897.1 Yes
Staff by Category
Administration
2 staff
6.1hs shift avg
Nursing Staff
151 staff
7.4hs shift avg
Physicians & Practitioners
2 staff
6hs shift avg
Therapy Services
15 staff
6.5hs shift avg
Activities & Recreation
0 staff
0hs shift avg
Social Services
3 staff
5.7hs shift avg
Dietary Services
3 staff
7.4hs shift avg
Other Services
1 staff
7.6hs shift avg
Contractor Analysis
10.8%
of total hours from contractors
3,324 contractor hours this quarter
Certified Nursing Assistant: 43 Licensed Practical Nurse: 22 Physical Therapy Assistant: 1 Occupational Therapy Aide: 1 Registered Nurse: 3 Medical Director: 1 Occupational Therapy Assistant: 1
Role Employees Contractors Total Staff Total Hours Days Worked % of Days Avg Shift (hrs)
Certified Nursing Assistant46438913,82591100%7.1
Licensed Practical Nurse1422364,83591100%7.4
Medication Aide/Technician100102,90691100%8.5
Registered Nurse93121,9929099%6.9
RN Director of Nursing4041,7728998%8.1
Speech Language Pathologist4046477481%7.2
Qualified Social Worker3036187582%5.7
Physical Therapy Aide2025886774%6.7
Respiratory Therapy Technician4045397178%5.3
Mental Health Service Worker1015016673%7.6
Physical Therapy Assistant2134936976%6.7
Other Dietary Services Staff1014676369%7.4
Administrator1014435965%7.5
Occupational Therapy Aide0113804853%7.9
Nurse Practitioner2023485864%6
Dietitian2023004044%7.5
Medical Director011452123%2.1
Occupational Therapy Assistant0113589%4.4

Facility Characteristics

Source: CMS Long-Term Care Facility Characteristics (Data as of Jan 2026)

Total census
74 residents
Residents by payment source
Medicare
14 residents (18.9%)
Medicaid
32 residents (43.2%)
Private pay or other
28 residents (37.8%)
Programs & Services
Residents' Group

Residents meet regularly to discuss policies, care quality, and activities

CCRC

Part of a Continuing Care Retirement Community offering multiple care levels

Active Resident Council

Organized group of residents that meets regularly to discuss facility policies, quality of life, and activities.

Quality of care over time

These measures show how residents usually do over time at this home, based on health outcomes and preventive care.

High-risk clinical events score Info A composite score based on pressure ulcers, falls with injury, weight loss, walking ability decline, and activities of daily living decline. 13.8
60% worse than Texas average

Texas average: 8.6

Functional decline score Info A composite score based on activities of daily living decline, walking ability decline, and incontinence. 23.2
44% worse than Texas average

Texas average: 16.0

Long-stay resident measures
Average Texas avg: 4.2 Info CMS star rating based on long-stay quality measure performance. 5 stars = significantly above average, 1 star = significantly below average.
Need for Help with Daily Activities Increased Info Percent of long-stay residents whose need for help with daily activities has increased 21.9%
36% worse than Texas average

Texas average: 16.2%

Walking Ability Worsened Info Percent of long-stay residents whose ability to move independently worsened 34.0%
110% worse than Texas average

Texas average: 16.2%

Low Risk Residents with Bowel/Bladder Incontinence Info Percent of low risk long-stay residents who lose control of their bowels or bladder 13.6%
13% better than Texas average

Texas average: 15.7%

Falls with Major Injury Info Percent of long-stay residents experiencing one or more falls with major injury 1.3%
60% better than Texas average

Texas average: 3.2%

High Risk Residents with Pressure Ulcers Info Percent of long-stay high risk residents with pressure ulcers 8.2%
84% worse than Texas average

Texas average: 4.4%

Urinary Tract Infection Info Percent of long-stay residents with a urinary tract infection 0.9%
8% worse than Texas average

Texas average: 0.8%

Lost Too Much Weight Info Percent of long-stay residents who lose too much weight 3.5%
In line with Texas average

Texas average: 3.5%

Depressive Symptoms Info Percent of long-stay residents who have depressive symptoms 0.5%
83% better than Texas average

Texas average: 2.9%

Antipsychotic Use Info Percent of long-stay residents who received an antipsychotic medication 11.3%
44% worse than Texas average

Texas average: 7.9%

Pneumococcal Vaccine Info Percent of long-stay residents assessed and appropriately given the pneumococcal vaccine 100.0%
In line with Texas average

Texas average: 97.3%

Influenza Vaccine Info Percent of long-stay residents assessed and appropriately given the seasonal influenza vaccine 98.2%
In line with Texas average

Texas average: 97.9%

Hospitalizations per 1,000 days Info Number of hospitalizations per 1,000 long-stay resident days. 1.64
23% better than Texas average

Texas average: 2.13

ED visits per 1,000 days Info Number of outpatient emergency department visits per 1,000 long-stay resident days. 0.56
73% better than Texas average

Texas average: 2.07

Short-stay resident measures
Above average Texas avg: 2.9 Info CMS star rating based on short-stay quality measure performance. 5 stars = much above average, 1 star = much below average.
Pneumococcal Vaccine Info Percent of short-stay residents assessed and appropriately given the pneumococcal vaccine 90.8%
In line with Texas average

Texas average: 90.4%

Antipsychotic medication increase Info Percent of short-stay residents who newly received an antipsychotic medication 0.2%
86% better than Texas average

Texas average: 1.4%

Influenza Vaccine Info Percent of short-stay residents assessed and appropriately given the seasonal influenza vaccine 90.0%
In line with Texas average

Texas average: 88.0%

Re-hospitalized after SNF stay Info Percentage of short-stay residents who were re-hospitalized after their nursing home admission. 16.6%
36% better than Texas average

Texas average: 25.9%

Emergency department visits Info Percentage of short-stay residents who had an outpatient emergency department visit. 10.4%
13% better than Texas average

Texas average: 12.0%

Falls with major injury Info Percentage of SNF residents who experience falls with major injury during their stay. 0.0%
100% better than Texas average

Texas average: 0.8%

Ability to care for self at discharge Info Percentage of residents at or above expected ability to care for themselves at discharge. 47.1%
12% worse than Texas average

Texas average: 53.7%

Successful return to home or community Info Rate of successful return to home or community from a skilled nursing facility. 53.4%
6% better than Texas average

Texas average: 50.6%

Penalties and fines

Federal penalties imposed by CMS for regulatory violations, including civil money penalties (fines) and denials of payment for new Medicare/Medicaid admissions.

Source: CMS Penalties Database (Data as of Jan 2026)

Total fines amount $8K
90% lower than Texas average

Texas average: $80K

Number of fines 1
60% fewer fines than Texas average

Texas average: 2.5

Payment Denials Info Serious action where Medicare and/or Medicaid temporarily stops payments for new residents until issues are fixed. 0
100% fewer payment denials than Texas average

Texas average: 0.2

Fines amount comparison
This facility $8K
Texas average $80K
Penalty History

Penalties are imposed by CMS for violations of federal nursing home regulations.

Civil Money Penalty Info Fines imposed for noncompliance, which can be assessed per day or per instance of violation. Mar 17, 2025
$8K

Last updated: Jan 2026

Guides for Better Senior Living

Care Cost Calculator: See Prices in Your Area

Nursing Home Data Explorer

Don’t Wait Too Long: 7 Red Flag Signs Your Parent Needs Assisted Living Now

The True Cost of Assisted Living in 2025 – And How Families Are Paying For It

Understanding Senior Living Costs: Pricing Models, Discounts & Financial Assistance

Financial Aid for Texas Seniors

Get financial aid guidance

Community Care for the Aged and Disabled (CCAD)

TX Medicaid CCAD

Age 65+ or disabled, Texas resident, Medicaid-eligible, care need (not always nursing home level).

~$2,829/month (300% FBR, individual).

$2,000 (individual), $3,000 (couple).

Large state; rural access challenges.

Texas Community Care Services

TX CCS

Age 60+, Texas resident, at risk of decline.

~$2,000/month (individual, varies).

$5,000 (individual).

Limited funding; high demand in urban areas.

Area Agency on Aging (AAA) Services

Texas AAA Services

Age 60+, TX resident; no income/asset limits.

None; donations encouraged.

Not assessed.

28 AAAs; includes Meals on Wheels in some areas.

Medicare Savings Program (MSP)

Texas Medicare Savings Program

Age 65+ or disabled, TX resident, Medicare Part A/B.

~$2,510/month (QMB), ~$3,380/month (SLMB), ~$3,598/month (QI)—individual.

$9,430 (individual), $14,130 (couple).

Includes Extra Help for Part D; no waitlist.

Low-Income Home Energy Assistance Program (LIHEAP)

Texas Comprehensive Energy Assistance Program (CEAP)

Age 60+ prioritized, TX resident, low-income.

~$3,970/month (185% FPL).

Not assessed.

Priority for elderly/disabled; covers gas, electric, propane.

Family Caregiver Support Program (FCSP)

Texas Family Caregiver Support Program

Caregivers of 60+ needing care or 55+ caregivers of others; TX resident; 2+ ADLs.

No strict cap; prioritizes low-income (~$24,980/year).

Not assessed.

High rural demand; includes grandparent caregivers.

Senior Community Service Employment Program (SCSEP)

Texas SCSEP

Age 55+, unemployed, low-income, TX resident.

~$1,983/month (125% FPL).

Not specified.

Priority for veterans, rural residents; AARP partnership.

VA Aid and Attendance (A&A) and Housebound Benefits

Texas VA Aid and Attendance/Housebound

Age 65+ or disabled veteran/spouse, TX resident, wartime service, ADL help (A&A) or homebound.

Net income < ~$1,984/month (veteran with dependent, A&A); pension offsets income.

~$155,356 (net worth).

High veteran population; supports rural/urban needs.

Property Tax Exemption for Seniors

Texas Senior Property Tax Exemption

Age 65+, TX resident, homeowner (homestead).

None; tax-based eligibility.

Not assessed.

$25,000+ exemption; optional freeze in some counties; saves ~$500-$1,000/year.

Senior Farmers’ Market Nutrition Program (SFMNP)

Texas SFMNP

Age 60+, TX resident, low-income.

~$2,322/month (185% FPL).

Not assessed.

Vouchers (~$50/season); serves ~20,000 via 28 AAAs.

Tour Icon
Planning a tour? Check our touring checklist.
Chat Icon
Thinking of living here? We can help you speak to a current resident