Tice Valley Post Acute
Nursing Home & Nursing Care · Walnut Creek, CA
CMS overall rating Info CMS (the Centers for Medicare & Medicaid Services) is the federal agency that rates nursing home quality. Its Overall Rating runs from 1 to 5 stars, combining health inspections, staffing, and quality measures, with inspections weighted most heavily.

Tice Valley Post Acute

Nursing Home & Nursing Care · Walnut Creek, CA
CMS overall rating Info CMS (the Centers for Medicare & Medicaid Services) is the federal agency that rates nursing home quality. Its Overall Rating runs from 1 to 5 stars, combining health inspections, staffing, and quality measures, with inspections weighted most heavily.
Calculator: See prices in your area
Tice Valley Post Acute accepts Medicare, Medicaid, and private pay.

Overview of Tice Valley Post Acute

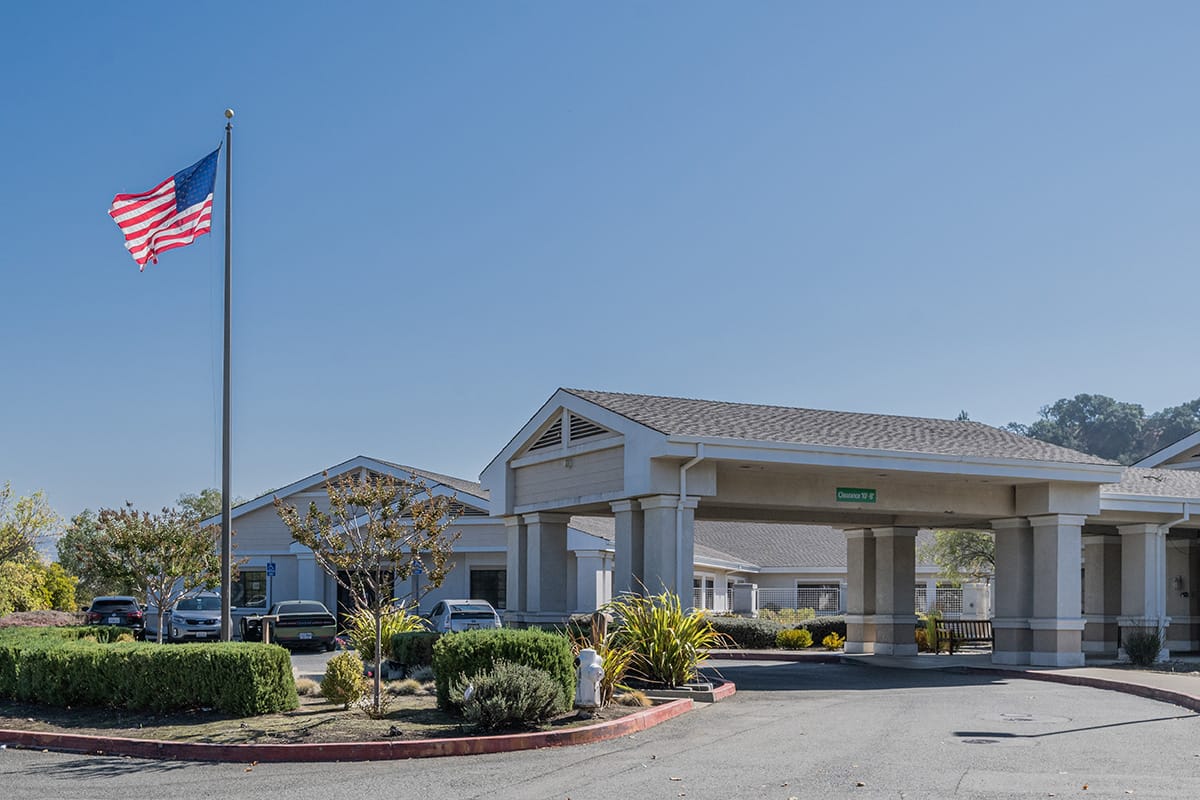
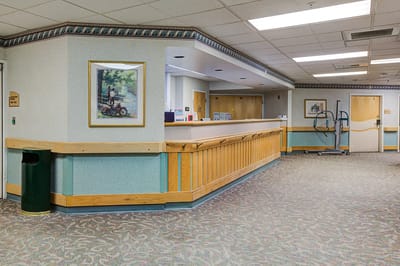
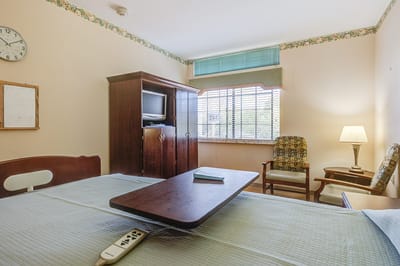
Ideally nestled in the beautiful setting of Walnut Creek, CA, Tice Valley Post Acute is an outstanding community that offers skilled nursing and rehabilitation. Featuring a wide range of care options, including complex wound care, outpatient therapy, restorative nursing, long-term care, and therapy, the community ensures residents find the right care for their unique needs. Residents experience the best of their golden years with top-tier care provided by a compassionate and highly trained team 24/7.

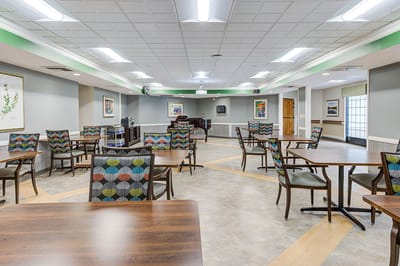
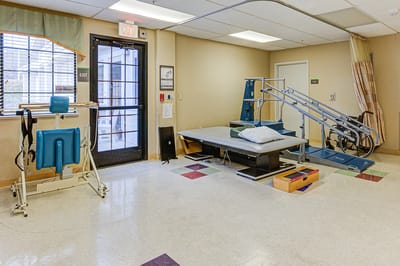
A carefully curated calendar of engaging activities and enriching programs is conducted so residents can live actively and remain socially connected. Meals are also carefully curated to meet residents’ dietary needs and preferences. The community is equipped with a state-of-the-art rehabilitation gym and spacious courtyards, making it an ideal setting for those seeking a place to begin their healing journey.

Quality ratings

Measured by Centers for Medicare & Medicaid Services (CMS)

Overall rating Info The Overall CMS Rating combines results from health inspections, staffing levels and quality measures. Health inspections carry the most weight. Staffing and quality scores can increase or decrease the final rating based on performance compared to state and national standards.
▲ 58.8% Above CA avg. ▲ 58.8% Above CA avg.CA average: 3.1Click the badge to see the full State ranking.Click here to see the full State ranking.
Health Inspection Info Based on the results of the facility's three most recent standard inspections and any complaint investigations. CMS reviews the number, scope, and severity of deficiencies, with more recent findings weighted more heavily.
▲ 43.0% Above CA avg. ▲ 43.0% Above CA avg.CA average: 2.8Click the badge to see the full State ranking.Click here to see the full State ranking.
Staffing Info Measures average nursing staff hours per resident per day, including Registered Nurses (RNs) and total nursing staff. Ratings are adjusted based on the level of care residents require and are compared to state and national benchmarks.
▲ 27.5% Above CA avg. ▲ 27.5% Above CA avg.CA average: 3.1Click the badge to see the full State ranking.Click here to see the full State ranking.
Quality Measures Info Based on clinical and physical health indicators reported to CMS, such as hospital readmissions, falls, pressure ulcers, and improvements in mobility. These measures reflect how well residents' health needs are being managed.
▲ 22.4% Above CA avg. ▲ 22.4% Above CA avg.CA average: 4.1Click the badge to see the full State ranking.Click here to see the full State ranking.

Staffing hours breakdown

Info Daily nursing hours per resident by staff type, reported to CMS. Higher is generally better — compare this facility to state and national averages to see where staffing stands.

Hours per resident per day — compared to California state averages

Total nursing care / resident Info This home is ranked 122nd out of 354 homes in California for nurse hours. Total adjusted nursing hours per resident per day, combining RN, LPN, and aide time. CMS adjusts this for case-mix so facilities can be fairly compared.
4h 18m per day
Rank #122 / 354Nurse hours — State benchmarkedThis home is ranked 122nd out of 354 homes in California. Shows adjusted nurse hours per resident per day benchmarked to the California average, with a ranking across 354 California facilities. More hours mean more direct care. The national average is about 3.5 hrs; below 3.0 is a red flag.Rankings are based only on facilities in California that report data for that category. Facilities without available data are excluded from the ranking.Click the rank badge to see the full State ranking.Click here to see the full State ranking.
This facility California avg (4h 13m per day)
vs California avg
+2%

2 of 6 metrics below state avg

Standout metric Physical Therapist is +69% above state avg
Staff typeHours / Day / Residentvs state avg
Registered Nurse (RN) Info RNs hold the highest nursing license and can assess residents, interpret test results, and direct care plans. More RN hours per day often signals stronger clinical oversight and faster response to health changes. 41m per day ▲ 6% State avg: 39m per day · National avg: 41m per day
LPN / LVN Info Licensed Practical Nurses (LPNs) or Licensed Vocational Nurses (LVNs) deliver routine hands-on care — medication administration, wound dressing, and monitoring vital signs. They work under RN supervision and make up a large share of daily bedside care. 1h 13m per day ■ Avg State avg: 1h 13m per day · National avg: 52m per day
Nurse Aide Info Certified Nurse Aides (CNAs) provide the most direct day-to-day assistance: bathing, dressing, feeding, and mobility. Nurse aide hours are typically the largest staffing category and directly affect residents' quality of life. 2h 27m per day ▼ 8% State avg: 2h 39m per day · National avg: 2h 21m per day
Weekend Total Nursing Info Combined nursing hours (RN + LPN + Nurse Aide) per resident per day on weekends. Staffing often drops on weekends — this figure reveals whether the facility maintains adequate coverage outside of weekday hours. 3h 50m per day ▼ 6% State avg: 4h 5m per day · National avg: 3h 26m per day
Physical Therapist Info Hours per resident per day provided by licensed Physical Therapists (PTs) or PT Assistants. PT services help residents recover mobility after injury or illness and are especially important for post-acute (short-stay) rehabilitation. 8m per day ▲ 69% State avg: 5m per day · National avg: 4m per day
Weekend RN Info Registered nurse hours specifically on weekends. Facilities sometimes reduce RN presence on Saturdays and Sundays — a low weekend RN figure compared to weekday hours can indicate reduced clinical oversight when most administrative staff are absent. 30m per day ■ Avg State avg: 30m per day · National avg: 29m per day

Capacity and availability

This home usually has limited availability

Higher occupancy than the California average: 84.7%
Occupancy rate
88.9% Rank #355 / 1537Occupancy rate — State benchmarkedThis home is ranked 355th out of 1537 homes in California. Shows this facility's occupancy rate versus the California average, with its Statewide rank out of 1537. Higher occupancy signals strong local demand and financial stability.Rankings are based only on facilities in California that report data for that category. Facilities without available data are excluded from the ranking.Click the rank badge to see the full State ranking.Click here to see the full State ranking.
Avg. Length of Stay
48 days
Bed community size
120-bed community Rank #561 / 1657Bed count — State benchmarkedThis home is ranked 561st out of 1657 homes in California. Shows this facility's certified or reported bed count compared to other California facilities. Larger communities may offer more amenities, programs, and on-site services for residents and families.Rankings are based only on facilities in California that report data for that category. Facilities without available data are excluded from the ranking.Click the rank badge to see the full State ranking.Click here to see the full State ranking.
A larger shared setting that may offer more common spaces and organized community services.
Walk Score
Walk Score: 59 / 100 Rank #1088 / 2092Walk Score — State benchmarkedThis home is ranked 1088th out of 2092 homes in California. Shows how walkable this facility's neighborhood is compared to the average Walk Score across California facilities. Higher scores benefit residents, families, and staff.Rankings are based only on facilities in California that report data for that category. Facilities without available data are excluded from the ranking.Click the rank badge to see the full State ranking.Click here to see the full State ranking.
Moderately walkable. Some errands can be accomplished on foot, with a mix of nearby amenities.

About this community

Payment & Insurance

1 service
Accept Medicare

Therapy & Rehabilitation

3 services
Rehabilitation Services
Respite Care
Short-Term Rehab

Staffing & Medical

1 service
24-Hour Staffing

Amenities & Lifestyle

Private Bathrooms With Showers
Expansive Common Areas
State-Of-The-Art Rehab Gym
Beautiful Courtyards And Lobby
Activities
Touring HoursMonday – Friday: 8:30 am – 5 pm, Weekends: 8:30 am – 5 pm

Contact Tice Valley Post Acute

Staffing Data

Reporting period: October 1 – December 31, 2025 (Q4 2025). Source: CMS Payroll-Based Journal report.

Total staff 261
Employees 147
Contractors 114
Staff to resident ratio 2.23 : 1
23% more staff per resident than California average
California average ratio: 1.81 : 1 California average ratio: 1.81 : 1See full California ranking
Avg staff/day 77
Average shift 7.8 hours
0% compared with California average
California average: 7.7 hours California average shift: 7.7 hoursSee full California ranking
Total staff hours (quarter) 55,323

Nursing staff breakdown

Q4 2025 · Oct 1 – Dec 31 More info This data comes from the CMS Payroll-Based Journal report covering October 1 – December 31, 2025.
Registered Nurse

Manages medical care and health needs.

RN Staff Info 19 total: 18 full-time employees and 1 contractor. 19
Average shift length Info Average shift length. Calculated as total hours divided by days worked and average staff per day. 8.5 hours
Licensed Practical Nurse

Assists with medical care and medications.

LPN Staff Info 51 total: 28 full-time employees and 23 contractors. 51
Average shift length Info Average shift length. Calculated as total hours divided by days worked and average staff per day. 8.3 hours
Certified Nursing Assistant

Helps with daily care and mobility.

CNA Staff Info 157 total: 67 full-time employees and 90 contractors. 157
Average shift length Info Average shift length. Calculated as total hours divided by days worked and average staff per day. 7.6 hours

Contractor staffing

Q4 2025 · Oct 1 – Dec 31 More info This data comes from the CMS Payroll-Based Journal report covering October 1 – December 31, 2025.

Total hours from contractors

11%

6,095 contractor hours this quarter

Certified Nursing Assistant: 90 Licensed Practical Nurse: 23 Registered Nurse: 1

Staff by category

Q4 2025 · Oct 1 – Dec 31 More info This data comes from the CMS Payroll-Based Journal report covering October 1 – December 31, 2025.
Certified Nursing Assistant679015726,11392100%7.6
Licensed Practical Nurse28235111,60792100%8.3
Registered Nurse181196,76192100%8.5
Physical Therapy Assistant6061,9618896%7.1
Respiratory Therapy Technician4041,5067480%7.7
Speech Language Pathologist4041,3468997%7.4
RN Director of Nursing3031,3416470%8.1
Other Dietary Services Staff3038248289%7.9
Dietitian1016356470%9.9
Qualified Social Worker3036046672%6.2
Dental Services Staff2025646571%7.8
Nurse Practitioner1015126470%8
Occupational Therapy Aide1015126470%8
Therapeutic Recreation Specialist1014676065%7.8
Administrator1012566470%4
Nurse Aide in Training2021431617%7.5
Clinical Nurse Specialist101881112%8
Physical Therapy Aide101841516%5.6
157 Certified Nursing Assistant
% of Days 100%
51 Licensed Practical Nurse
% of Days 100%
19 Registered Nurse
% of Days 100%
6 Physical Therapy Assistant
% of Days 96%
4 Respiratory Therapy Technician
% of Days 80%
4 Speech Language Pathologist
% of Days 97%
3 RN Director of Nursing
% of Days 70%
3 Other Dietary Services Staff
% of Days 89%
1 Dietitian
% of Days 70%
3 Qualified Social Worker
% of Days 72%
2 Dental Services Staff
% of Days 71%
1 Nurse Practitioner
% of Days 70%
1 Occupational Therapy Aide
% of Days 70%
1 Therapeutic Recreation Specialist
% of Days 65%
1 Administrator
% of Days 70%
2 Nurse Aide in Training
% of Days 17%
1 Clinical Nurse Specialist
% of Days 12%
1 Physical Therapy Aide
% of Days 16%

Penalties and fines

Federal penalties imposed by CMS for regulatory violations, including civil money penalties (fines) and denials of payment for new Medicare/Medicaid admissions.

Source: CMS Penalties Database

No penalties in the past 3 years

No civil money penalties or payment denials were reported in the last 3 years.

Quality of care over time

These measures show how residents usually do over time at this home, based on health outcomes and preventive care.

High-risk clinical events score Info A composite score based on pressure ulcers, falls with injury, weight loss, walking ability decline, and activities of daily living decline. 3.4
49% better than California average

California average: 6.6

Functional decline score Info A composite score based on activities of daily living decline, walking ability decline, and incontinence. 7.8
32% better than California average

California average: 11.3

Long-stay resident measures
Significantly above average California avg: 4.2 Info CMS star rating based on long-stay quality measure performance. 5 stars = significantly above average, 1 star = significantly below average.
Need for Help with Daily Activities Increased Info Percent of long-stay residents whose need for help with daily activities has increased 6.3%
43% better than California average

California average: 11.1%

Walking Ability Worsened Info Percent of long-stay residents whose ability to move independently worsened 3.3%
73% better than California average

California average: 12.0%

Low Risk Residents with Bowel/Bladder Incontinence Info Percent of low risk long-stay residents who lose control of their bowels or bladder 13.7%
21% worse than California average

California average: 11.3%

Falls with Major Injury Info Percent of long-stay residents experiencing one or more falls with major injury 2.9%
73% worse than California average

California average: 1.7%

High Risk Residents with Pressure Ulcers Info Percent of long-stay high risk residents with pressure ulcers 4.2%
15% better than California average

California average: 5.0%

Urinary Tract Infection Info Percent of long-stay residents with a urinary tract infection 0.3%
74% better than California average

California average: 1.2%

Lost Too Much Weight Info Percent of long-stay residents who lose too much weight 0.4%
92% better than California average

California average: 4.2%

Depressive Symptoms Info Percent of long-stay residents who have depressive symptoms 0.7%
89% better than California average

California average: 6.7%

Antipsychotic Use Info Percent of long-stay residents who received an antipsychotic medication 9.3%
8% better than California average

California average: 10.1%

Pneumococcal Vaccine Info Percent of long-stay residents assessed and appropriately given the pneumococcal vaccine 100.0%
In line with California average

California average: 98.5%

Influenza Vaccine Info Percent of long-stay residents assessed and appropriately given the seasonal influenza vaccine 100.0%
In line with California average

California average: 98.2%

Hospitalizations per 1,000 days Info Number of hospitalizations per 1,000 long-stay resident days. 2.41
7% worse than California average

California average: 2.25

ED visits per 1,000 days Info Number of outpatient emergency department visits per 1,000 long-stay resident days. 2.72
71% worse than California average

California average: 1.59

Short-stay resident measures
Above average California avg: 3.5 Info CMS star rating based on short-stay quality measure performance. 5 stars = much above average, 1 star = much below average.
Pneumococcal Vaccine Info Percent of short-stay residents assessed and appropriately given the pneumococcal vaccine 96.3%
In line with California average

California average: 94.0%

Antipsychotic medication increase Info Percent of short-stay residents who newly received an antipsychotic medication 1.5%
In line with California average

California average: 1.5%

Influenza Vaccine Info Percent of short-stay residents assessed and appropriately given the seasonal influenza vaccine 100.0%
7% better than California average

California average: 93.2%

Re-hospitalized after SNF stay Info Percentage of short-stay residents who were re-hospitalized after their nursing home admission. 23.6%
In line with California average

California average: 23.2%

Emergency department visits Info Percentage of short-stay residents who had an outpatient emergency department visit. 24.2%
116% worse than California average

California average: 11.2%

Falls with major injury Info Percentage of SNF residents who experience falls with major injury during their stay. 0.5%
30% better than California average

California average: 0.8%

Ability to care for self at discharge Info Percentage of residents at or above expected ability to care for themselves at discharge. 51.2%
5% worse than California average

California average: 53.7%

Successful return to home or community Info Rate of successful return to home or community from a skilled nursing facility. 66.6%
32% better than California average

California average: 50.6%

Breakdown by payment type

Medicare

11% of new residents, usually for short-term rehab.

Typical stay 24 days

Private pay

76% of new residents, often for short stays.

Typical stay 1 - 2 months

Medicaid

13% of new residents, often for long-term daily care.

Typical stay 5 - 6 months

Facility Characteristics

Source: CMS Long-Term Care Facility Characteristics (Data as of Jan 2026)

Total residents 117
Medicare
17
14.5% of residents
Medicaid
74
63.2% of residents
Private pay or other
26
22.2% of residents

Finances and operations

Based on CMS SNF Cost Report for fiscal year ending in 05/2024.

For-profit
Operated by a single business entity.
Net patient revenue Info Net patient revenue — what the home actually collects for resident care, after contractual allowances, bad debt and discounts are subtracted from its gross charges (CMS cost report, Worksheet G-3). It covers resident care only; money the home earns from other sources is shown separately as "Other income."
$20.2M
Net patient income Info Net patient income: net patient revenue minus the home's total operating expenses. A positive figure means it earns more from resident care than it spends to deliver it; a negative figure means the opposite. It excludes non-operating "other income."
-$1.9M
For-profit Operated by a single business entity.
Net patient revenue Info Net patient revenue — what the home actually collects for resident care, after contractual allowances, bad debt and discounts are subtracted from its gross charges (CMS cost report, Worksheet G-3). It covers resident care only; money the home earns from other sources is shown separately as "Other income."
$20.2M Rank #71 / 355Revenue — State benchmarkedThis home is ranked 71st out of 355 homes in California. Shows this facility's annual revenue compared to the California average. Higher revenue generally means more resources for staffing and capital — read alongside Payroll %.Rankings are based only on facilities in California that report data for that category. Facilities without available data are excluded from the ranking.Click the rank badge to see the full State ranking.Click here to see the full State ranking.
Net patient income Info Net patient income: net patient revenue minus the home's total operating expenses. A positive figure means it earns more from resident care than it spends to deliver it; a negative figure means the opposite. It excludes non-operating "other income."
-$1.9M
Other income Info Money the home earns outside of resident care — such as investments, grants, rentals and other non-operating sources (CMS cost report, Worksheet G-3). It is tracked separately from net patient revenue: it is not part of that figure, and it is not included in net patient income.
$9.7K
Payroll costs Info Staff salaries plus wage-related costs — benefits such as payroll taxes, health insurance and retirement — from the home's own accounting records (CMS cost report, Worksheet A). Contract or agency labor is counted separately, under other operating costs. Rank #50 / 355Payroll — State benchmarkedThis home is ranked 50th out of 355 homes in California. Shows total annual staff payroll benchmarked to the California average. Higher payroll investment relative to peers often signals better staffing and less reliance on cheaper contract labor.Rankings are based only on facilities in California that report data for that category. Facilities without available data are excluded from the ranking.Click the rank badge to see the full State ranking.Click here to see the full State ranking.
$12.2M 60.6% of net patient revenue Info Payroll as a share of revenue: staff salaries and wage-related benefits divided by net patient revenue. A higher figure means more of each revenue dollar goes to staff pay. Rank #204 / 355Payroll % — State benchmarkedThis home is ranked 204th out of 355 homes in California. Shows payroll as a percentage of revenue versus the California average. Well-run California facilities typically land around 56–67% — the top third Statewide. Below 25% may signal understaffing or heavy agency use — read with Staffing ratings.Rankings are based only on facilities in California that report data for that category. Facilities without available data are excluded from the ranking.Click the rank badge to see the full State ranking.Click here to see the full State ranking.
Other operating costs Info Everything it costs to run the home apart from payroll — food, utilities, supplies, maintenance, contract labor and administration. Calculated as total operating expense minus payroll (staff salaries and wage-related benefits).
$9.9M
Total costs Info The home's total operating expense for the year — all the costs of running it, salaries included (CMS cost report, Worksheet G-3).
$22.1M

What does this home offer?

Housing options icon

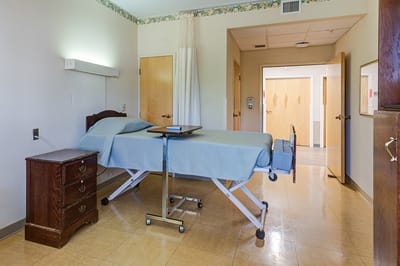
Housing Options: Private / Semi-Private Rooms

Building type icon
Building type icon

Building Type: Single-story

Housekeeping icon
Housekeeping icon

Housekeeping Services

Health Programs icon

Health Programs

Who this home usually serves

TYPE OF STAY

Primarily long-term care, limited rehab

Most residents stay long-term, while a smaller portion are admitted for short-term rehab.

Most new residents arrive under private pay (76% of admissions), and a typical private pay stay runs around 1 - 2 months.

Admissions
783 total

Coverage residents most often arrive under.

Medicare 11%
Private pay 76%
Medicaid 13%
Discharges
815 total

Coverage residents most often leave under.

Medicare 8%
Private pay 71%
Medicaid 21%

Managed by Your Care

Licensed Nursing Home Administrator (LNHA)

Your Care serves as the Licensed Nursing Home Administrator at Tice Valley Post Acute, directing all facility operations, staffing, services, and programs. They lead the leadership team alongside the Medical Director and other department directors, ensuring coordinated and quality care for residents.

Tice Valley Post Acute Reviews

John Pirogowicz
Tice Valley Post Acute facility provided the environment and care that encouraged my becoming healthier day by day. Gabriel, Louis, Jerricho, Asia, Linda, Eric, Jim, John, Lindsey, Amanda and many others helped put lil' ol' me (Hunpty Dumpty) back together again. My gratitude to all parties that gave to me their time, learning & experience.What do you like most about living here? Answer: Friendly and skilled professional care givers Are there enough caregivers to handle the residents' needs, especially during emergencies? Answer: No Are the common areas pleasant and comfortable for socializing or relaxing? Answer: Yes How would you rate the quality and variety of the meals? (1-5) Answer: 4 Are special diets handled well? Answer: Yes Is the dining schedule flexible enough to meet your preferences? Answer: Yes How do you feel about the level of social interaction available with other residents? Answer: OK How was the units offered in this community? Answer: Medicare Senior Advantage Do you feel safe living in this community? Answer: Yes How well do you think the community handles emergencies or unexpected events? Answer: Size of staff and affordability are contentious matters, be it healthcare or whatever the service needed during times of trauma. Are there any hidden fees or unexpected charges? Answer: Not that I know of Would you recommend this community to others looking for senior living options? Answer: Yes Is there anything you wish you knew before moving in? Answer: Maybe the former "Lounge" could be converted to a reading room with half dozen, or so, PCs for internet access.

Places of interest near Tice Valley Post Acute

Address 3.8 miles from city center Info Estimated distance in miles from Walnut Creek's city center to Tice Valley Post Acute's address, calculated via Google Maps.

Calculate Travel Distance to Tice Valley Post Acute

Add your location

Address

Compare Nursing Homes around Walnut Creek

The information below is reported by the California Department of Social Services and Department of Public Health.

3 facilities compared · CMS & CA Dept. of Health data

Tice Valley Post Acute
NH
NC
Walnut Creek (Rossmoor)
120
Facility 120
CA AVG 103
Rank #561 / 1657
88.9%
Facility 88.9%
CA AVG 84.7%
Rank #355 / 1537
+5%
4.29
Facility 4.29
CA AVG 4.22
Rank #122 / 354
-18%+2%
$0
Facility $0
CA AVG $56.5k
Rank #1 / 362
-
37
Facility 37
CA AVG 50.2
Rank #155 / 361
4.1
Facility 4.1
CA AVG 4.6
Rank #180 / 361
-117-
59
Facility 59
CA AVG 57
Rank #1088 / 2092
Timothy Roberts
$20.2M
Facility $20.2M
CA AVG $17.0M
Rank #71 / 355
$12.2M
Facility $12.2M
CA AVG $7.0M
Rank #50 / 355
60.6%
Facility 60.6%
CA AVG 45.2%
Rank #204 / 355
555710
Tampico Terrace Care Center
NH
HC
NC
Walnut Creek
128
Facility 128
CA AVG 103
Rank #506 / 1657
74.6%
Facility 74.6%
CA AVG 84.7%
Rank #842 / 1537
-12%
4.20
Facility 4.20
CA AVG 4.22
Rank #138 / 354
-16%-1%
$0
Facility $0
CA AVG $56.5k
Rank #1 / 362
-
40
Facility 40
CA AVG 50.2
Rank #173 / 361
3.6
Facility 3.6
CA AVG 4.6
Rank #123 / 361
-119-
40
Facility 40
CA AVG 57
Rank #1556 / 2092
Marjorie Ellks
$19.2M
Facility $19.2M
CA AVG $17.0M
Rank #108 / 355
$9.9M
Facility $9.9M
CA AVG $7.0M
Rank #120 / 355
51.7%
Facility 51.7%
CA AVG 45.2%
Rank #233 / 355
56213
Walnut Creek Skilled Nursing & Rehabilitation Center
NH
Walnut Creek (Rossmoor)
153
Facility 153
CA AVG 103
Rank #330 / 1657
68.6%
Facility 68.6%
CA AVG 84.7%
Rank #987 / 1537
-19%
3.40
Facility 3.40
CA AVG 4.22
Rank #316 / 354
+39%-19%
$0
Facility $0
CA AVG $56.5k
Rank #1 / 362
92
Facility 92
CA AVG 81
Rank #308 / 1401
54
Facility 54
CA AVG 50.2
Rank #248 / 361
3.4
Facility 3.4
CA AVG 4.6
Rank #107 / 361
-105-
56
Facility 56
CA AVG 57
Rank #1180 / 2092
Dorothy Couto
$32.1M
Facility $32.1M
CA AVG $17.0M
Rank #11 / 355
$19.5M
Facility $19.5M
CA AVG $7.0M
Rank #4 / 355
60.7%
Facility 60.7%
CA AVG 45.2%
Rank #184 / 355
56327

Financial Assistance for
Nursing Home in California

Tice Valley Post Acute is located in Walnut Creek, California.
Here are the financial assistance programs available to residents in California.

Get Financial aid guidance

Multipurpose Senior Services Program

MSSP (Medi-Cal Waiver)

Age 65+
General California resident, Medi-Cal eligible, nursing home risk.
Income Limits (2025) ~$2,829/month 300% FBR, individual
Asset Limits $2,000 (individual), $3,000 (couple).
CA

County-managed; waitlists possible.

Benefits
In-home support (4-6 hours/day) Respite care (14 days/year) Meals (~$6/meal) Transportation (8 trips/month) Care management

In-Home Supportive Services (IHSS)

California IHSS

Age 65+
General California resident, Medicaid-eligible or low-income.
Income Limits ~$1,732/month individual, Medi-Cal threshold
Asset Limits $2,000 individual
CA

Can hire family as caregivers.

Benefits
Personal care (up to 283 hours/month) Homemaker services Respite (varies)

Multipurpose Senior Services Program (MSSP)

CA MSSP

Age 65+
General California resident, Medi-Cal-eligible, nursing home-eligible but community-capable.
Income Limits ~$2,829/month 300% FBR, individual
Asset Limits $2,000 individual
CA

Available in 38 counties; waitlists common.

Benefits
Case management Respite care (up to 10 days/year) Minor home mods (avg. $500) Adult day care (~$50/day)

Property Tax Postponement Program (PTP)

CA PTP

Age 62+
General California resident, own and live in home, 40% equity.
Income Limits (2025) ~$51,500/year household, adjusted annually
Asset Limits Equity-based; no strict asset cap.
CA

Deferred taxes accrue interest (5% as of 2024); repaid upon sale/death.

Benefits
Property tax deferral (avg. $1,000-$3,000/year, varies by county)

Assisted Living Waiver (ALW)

CA ALW

Age 65+ or disabled
General California resident, Medi-Cal-eligible, nursing home-eligible.
Income Limits ~$2,829/month 300% FBR, individual
Asset Limits $2,000 individual
CA

Available in 15 counties (e.g., LA, Sacramento); waitlists common.

Benefits
Personal care in ALFs (5-7 hours/day) Medication management Social services

California CARES Program

CA CARES

Age
General Caregivers of California residents 60+ needing help with 3+ daily activities; no caregiver age limit.
Income Limits No strict limit; cost-sharing above ~$2,500/month threshold.
Asset Limits Not applicable; need-based.
CA

High demand in urban areas; complements IHSS respite.

Benefits
Respite care (up to 10 days/year) Counseling (4-6 sessions/year) Training (2-3 workshops/year) Supplies (~$200/year)

Frequently Asked Questions about Tice Valley Post Acute

What neighborhood is Tice Valley Post Acute in?

Tice Valley Post Acute is in the Rossmoor neighborhood.

Is Tice Valley Post Acute in a walkable area?

Tice Valley Post Acute has a walk score of 59. Moderately walkable. Some errands can be accomplished on foot, with a mix of nearby amenities.

What is the occupancy rate at Tice Valley Post Acute?

Tice Valley Post Acute's occupancy is 88.9%.

Does Tice Valley Post Acute operate as a for-profit or non-profit?

Tice Valley Post Acute is registered as a for-profit.

Are there photos of Tice Valley Post Acute?

Yes — there are 7 photos of Tice Valley Post Acute in the photo gallery on this page.

What is the address of Tice Valley Post Acute?

Tice Valley Post Acute is located at 1975 Tice Valley Blvd, Walnut Creek, CA 94595.

What is the phone number of Tice Valley Post Acute?

(925) 906-0200 will put you in contact with the team at Tice Valley Post Acute.

Guides for Better Senior Living

Care Cost Calculator: See Prices in Your Area

Nursing Home Data Explorer

Don’t Wait Too Long: 7 Red Flag Signs Your Parent Needs Assisted Living Now

The True Cost of Assisted Living in 2025 – And How Families Are Paying For It

Understanding Senior Living Costs: Pricing Models, Discounts & Financial Assistance