Trevecca Center for Rehabilitation and Healing

Nursing Home in Nashville

CMS overall rating Info The Overall CMS Rating combines results from health inspections, staffing levels and quality measures. Health inspections carry the most weight. Staffing and quality scores can increase or decrease the final rating based on performance compared to state and national standards.

Overview of Trevecca Center for Rehabilitation and Healing

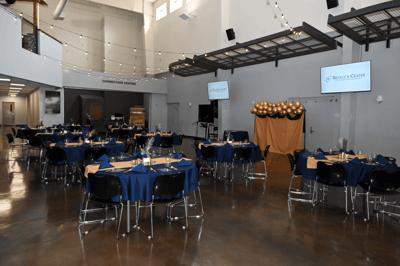
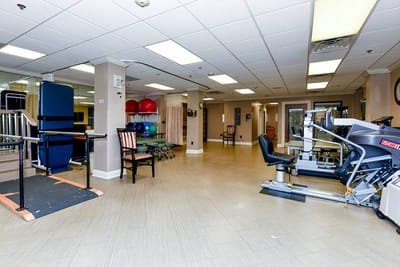
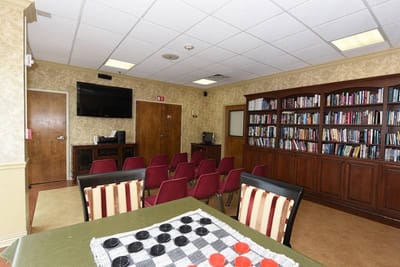
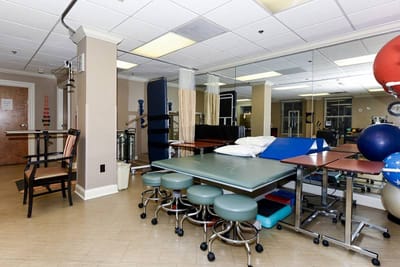
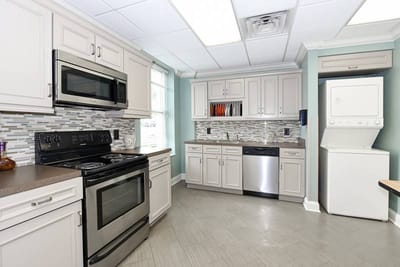
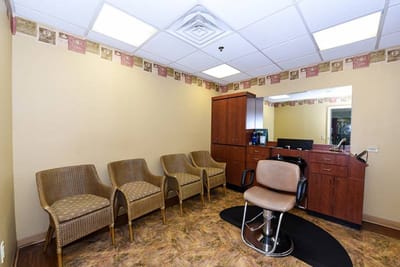
Trevecca Center for Rehabilitation and Healing is a community that proudly elevates the recovery experience of its residents. A premier nursing home that has been awarded a list of accolades, some of which are from the U.S. News and World Report ranking them as the Best Nursing Home; they have exceeded expectations for its short-term care. Trevecca Center is a tightly-knit community where residents are able to relax and renew themselves.
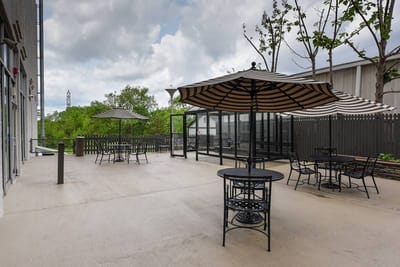
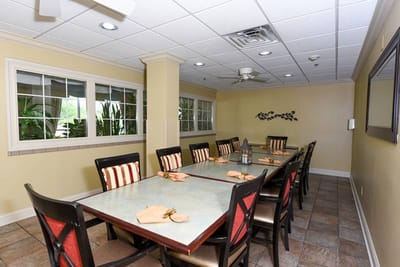
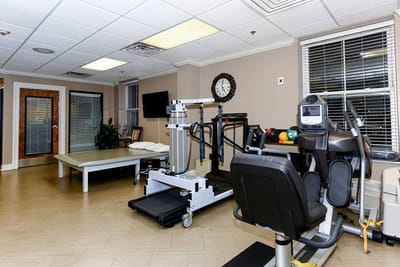
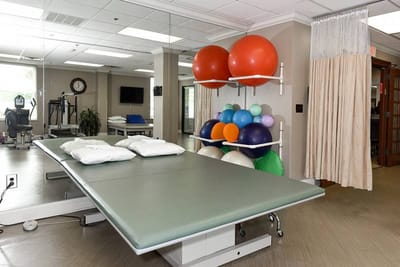
A member of the CareRite healthcare, Trevecca Center offers an array of recovery services that help a fast healing journey– orthopedic rehabilitation, short-term and long-term rehabilitation, amputee care, and wound care. Other luxurious services include its chef-prepared meals in a restaurant-style dining service. 

(615) 244-6600

Quality ratings

Measured by Centers for Medicare & Medicaid Services (CMS)

Overall rating Info The Overall CMS Rating combines results from health inspections, staffing levels and quality measures. Health inspections carry the most weight. Staffing and quality scores can increase or decrease the final rating based on performance compared to state and national standards.
3/5 ▼ 0.1 Tennessee average: 3.1/5
Health Inspection Info Based on the results of the facility's three most recent standard inspections and any complaint investigations. CMS reviews the number, scope, and severity of deficiencies, with more recent findings weighted more heavily.
3/5 ▲ 0.1 Tennessee average: 2.9/5
Staffing Info Measures average nursing staff hours per resident per day, including Registered Nurses (RNs) and total nursing staff. Ratings are adjusted based on the level of care residents require and are compared to state and national benchmarks.
1/5 ▼ 1.5 Tennessee average: 2.5/5
Quality Measures Info Based on clinical and physical health indicators reported to CMS, such as hospital readmissions, falls, pressure ulcers, and improvements in mobility. These measures reflect how well residents' health needs are being managed.
5/5 ▲ 1.3 Tennessee average: 3.7/5

Staffing hours breakdown

Info Daily nursing hours per resident by staff type, reported to CMS. Higher is generally better — compare this facility to state and national averages to see where staffing stands.

Hours per resident per day — compared to Tennessee state averages

Total nursing care / resident Info Total adjusted nursing hours per resident per day, combining RN, LPN, and aide time. CMS adjusts this for case-mix so facilities can be fairly compared.
2h 57m per day
This facility Tennessee avg (3h 40m per day)
vs Tennessee avg
-19%

4 of 5 metrics below state avg

Staff typeHours / dayvs state avg
Registered Nurse (RN) Info RNs hold the highest nursing license and can assess residents, interpret test results, and direct care plans. More RN hours per day often signals stronger clinical oversight and faster response to health changes. 28m per day ▼ 24% State avg: 37m per day · National avg: 41m per day
Nurse Aide Info Certified Nurse Aides (CNAs) provide the most direct day-to-day assistance: bathing, dressing, feeding, and mobility. Nurse aide hours are typically the largest staffing category and directly affect residents' quality of life. 2h 5m per day ▼ 3% State avg: 2h 9m per day · National avg: 2h 21m per day
Total Nursing (Weekend) Info Combined nursing hours (RN + LPN + Nurse Aide) per resident per day on weekends. Staffing often drops on weekends — this figure reveals whether the facility maintains adequate coverage outside of weekday hours. 3h 6m per day ▼ 7% State avg: 3h 21m per day · National avg: 3h 26m per day
Physical Therapist Info Hours per resident per day provided by licensed Physical Therapists (PTs) or PT Assistants. PT services help residents recover mobility after injury or illness and are especially important for post-acute (short-stay) rehabilitation. 5m per day ■ Avg State avg: 5m per day · National avg: 4m per day
RN (Weekend) Info Registered nurse hours specifically on weekends. Facilities sometimes reduce RN presence on Saturdays and Sundays — a low weekend RN figure compared to weekday hours can indicate reduced clinical oversight when most administrative staff are absent. 19m per day ▼ 24% State avg: 25m per day · National avg: 29m per day

Capacity and availability

High-capacity home

May provide extensive amenities, services and programs.

Total beds 240
Avg. Length of Stay
177 days

Who this home usually serves

TYPE OF STAY

Mostly long-term care residents

Most residents stay for extended periods and receive ongoing daily care.

Might be optimal for
Long-term daily care Ongoing support needs

Breakdown by payment type

Medicare

23% of new residents, usually for short-term rehab.

Typical stay 2 months

Private pay

24% of new residents, often for short stays.

Typical stay 5 - 6 months

Medicaid

53% of new residents, often for long-term daily care.

Typical stay 7 - 8 months

Finances and operations

Privately-owned community
Operated by a partnership between two or more business owners.
Home revenue
$23.4M
Profit
$613.0K
Privately-owned community Operated by a partnership between two or more business owners.
Home revenue
$23.4M
Profit
$613.0K
Payroll costs Info The portion of the home's budget spent on staff, including nurses, caregivers, and other employees who support care and operations.
$11.4M
48.8% of revenue
Other operating costs Info All remaining costs needed to run the home, such as food, utilities, building maintenance, supplies and administrative expenses.
$11.4M
Total costs $22.7M
Bed community size
240-bed community
A large-scale community that may provide a wide range of amenities, services, and structured programs.
Years in operation
42 years in operation
A longer operating history, which may indicate experience navigating regulations and delivering ongoing care.
Walk Score
Walk Score: 34 / 100
Somewhat walkable. A few nearby services may be reachable on foot, but most trips require transportation.
BBB Rating
BBB Rating: B- (Not Accredited)
An independent rating from the Better Business Bureau based on factors such as complaint history, transparency, and business practices.
How BBB ratings work

About this community

Occupancy

Occupancy rate
19%
74% lower than Tennessee average

Tennessee average: 72%

Occupied beds
45 / 240
Average residents 82 per day

License Details

Facility TypeNursing Home
StatusLicensed
IssuanceJanuary 7, 1992
ExpirationMay 8, 2026
CountyDavidson

Additional Licensing Details

License Number00000066
CMS Certification Number445112

Ownership & Operating Entity

Trevecca Center for Rehabilitation and Healing is legally operated by Trevecca Center for Rehabilitation and H, and administrated by Sheri Disney.

Staffing

Key information about the people who lead and staff this community.

Leadership

ContactMs. Sharon Goff, Administrator

Contact Trevecca Center for Rehabilitation and Healing

Residents information

Stay stats

Average length of stay
135 days
Total residents
54
Total admissions (2024)
46
Total discharges (2024)
36

Discharges

  • To hospital 5
  • To Private Residence or Home 3

Demographics

GENDER

  • Female Residents 74.1%
  • Male Residents 25.9%

AGE DISTRIBUTION

  • 60-64 3.7%
  • 65-69 3.7%
  • 70-74 16.7%
  • 75-79 25.9%
  • 80-84 20.4%
  • 85-89 13%
  • 90 or more 16.7%

ETHNICITY

  • Black Residents 35.2%
  • White Residents 64.8%

Inspection History

In Tennessee, the Department of Health, Division of Health Care Facilities performs unannounced inspections and investigations to ensure facilities provide high-quality resident care.

3 visits/inspections Info Inspections are mandatory, regular evaluations conducted by state health departments or regulatory agencies. They ensure the community provides safe, compliant care, covering areas like resident health, staff and management.

Tennessee average: 9 complaint visits

Latest inspection

Date June 21, 2023
Other

15 deficiencies

Deficiencies indicate regulatory issues. A higher number implies the facility had several areas requiring improvement.

Tennessee average: 17 deficiencies

Inspection Report Summary for Trevecca Center for Rehabilitation and Healing

The most recent inspection on June 21, 2023, identified several deficiencies related to care planning, resident services, dietary management, and food safety. Earlier inspections showed a mix of issues including staff language and incident investigation, staffing levels, and environmental cleanliness. The main themes across reports involved resident care coordination, adherence to care plans, assistance with daily living activities, and maintaining proper food temperatures and kitchen hygiene. A substantiated complaint from 2019 noted disrespectful staff language toward residents needing feeding assistance and failure to investigate a syringe incident. The pattern of findings suggests ongoing challenges in care planning and resident support, with no enforcement actions or fines listed in the available reports.

Health Inspection History

Inspections
Total health inspections 3

Tennessee average 3.5


Last Health inspection on Jun 2023

Total health citations 15

Tennessee average 15.4

Citations per inspection
5

Tennessee average 4.39


Health citations are formal notices following inspections when they fail to comply with safety and care standards.

14 of 15 citations resulted from standard inspections; and 1 of 15 resulted from complaint investigations.

Breakdown of citation severity (last 3 years)
Critical Health citations More info 0
100% better than Tennessee average

Tennessee average: 1.1


Serious Health citations More info 0
100% better than Tennessee average

Tennessee average: 0.6

0 critical citations More info Tennessee average: 1.1

0 serious citations More info Tennessee average: 0.6

15 moderate citations More info Tennessee average: 13.7

0 minor citations More info Tennessee average: 0.1
Citations history (last 3 years)
Nutrition moderate citation Info Issues related to food quality, meal service, and resident's nutritional needs. Jun 21, 2023
Corrected

Nutrition moderate citation Info Issues related to food quality, meal service, and resident's nutritional needs. Jun 21, 2023
Corrected

Nutrition moderate citation Info Issues related to food quality, meal service, and resident's nutritional needs. Jun 21, 2023
Corrected

Pharmacy moderate citation Info Issues related to medication management, including how drugs are stored, administered, and monitored. Jun 21, 2023
Corrected

Compare Nursing Homes around Nashville The information below is reported by the Tennessee Department of Health, Division of Health Care Facilities.

5 facilities compared · CMS & TN Dept. of Health data · Updated Apr 2026

Filter by care type
Trevecca Center for Rehabilitation and Healing
NH

Nursing Home Licensed facility providing 24/7 skilled nursing care for residents with complex, ongoing medical needs. Staffed by RNs, LPNs, and CNAs. Inspected and star-rated annually by CMS. Accepts Medicare (short-term rehab) and Medicaid (long-term care).

AL

Assisted Living A licensed, long-term care setting for seniors or individuals with disabilities who need help with daily activities — like bathing, dressing, and medication management — but not 24-hour skilled nursing. Offers housing, meals, and around-the-clock support while aiming to maximize resident independence.

Nashville (South Nashville)240 93.5% +28%2.96 -2%-18%2155.00207B- 34 Trevecca Ventures Tn Llc$21.4M$11.4M53.3%445112
Bethany Center for Rehabilitation and Healing
NH

Nursing Home Licensed facility providing 24/7 skilled nursing care for residents with complex, ongoing medical needs. Staffed by RNs, LPNs, and CNAs. Inspected and star-rated annually by CMS. Accepts Medicare (short-term rehab) and Medicaid (long-term care).

AL

Assisted Living A licensed, long-term care setting for seniors or individuals with disabilities who need help with daily activities — like bathing, dressing, and medication management — but not 24-hour skilled nursing. Offers housing, meals, and around-the-clock support while aiming to maximize resident independence.

Nashville (Townhomes Of Shadow Glen)180 93.7% +28%2.82 -53%-22%0123.02160- 69 Bethany Ventures Tn Llc$18.1M$10.5M57.8%445159
AHC Cumberland -
NH

Nursing Home Licensed facility providing 24/7 skilled nursing care for residents with complex, ongoing medical needs. Staffed by RNs, LPNs, and CNAs. Inspected and star-rated annually by CMS. Accepts Medicare (short-term rehab) and Medicaid (long-term care).

AL

Assisted Living A licensed, long-term care setting for seniors or individuals with disabilities who need help with daily activities — like bathing, dressing, and medication management — but not 24-hour skilled nursing. Offers housing, meals, and around-the-clock support while aiming to maximize resident independence.

Nashville (Bordeaux)---------000.00-- 9 -----
AHC of Nashville -
NH

Nursing Home Licensed facility providing 24/7 skilled nursing care for residents with complex, ongoing medical needs. Staffed by RNs, LPNs, and CNAs. Inspected and star-rated annually by CMS. Accepts Medicare (short-term rehab) and Medicaid (long-term care).

AL

Assisted Living A licensed, long-term care setting for seniors or individuals with disabilities who need help with daily activities — like bathing, dressing, and medication management — but not 24-hour skilled nursing. Offers housing, meals, and around-the-clock support while aiming to maximize resident independence.

Nashville (Midtown)49 318.5% +336%-----49%-000.00----$10.3M$3.8M36.4%445538
Barton House -
NH

Nursing Home Licensed facility providing 24/7 skilled nursing care for residents with complex, ongoing medical needs. Staffed by RNs, LPNs, and CNAs. Inspected and star-rated annually by CMS. Accepts Medicare (short-term rehab) and Medicaid (long-term care).

AL

Assisted Living A licensed, long-term care setting for seniors or individuals with disabilities who need help with daily activities — like bathing, dressing, and medication management — but not 24-hour skilled nursing. Offers housing, meals, and around-the-clock support while aiming to maximize resident independence.

Nashville38--------000.00--------

Financial Assistance for
Nursing Home in Tennessee

Get Financial aid guidance

CHOICES Program

TN Medicaid CHOICES

Age 65+ or disabled
General Tennessee resident, Medicaid-eligible, nursing home-level care need.
Income Limits (2025) ~$2,829/month 300% FBR, individual
Asset Limits $2,000 (individual), $3,000 (couple).
TN

Managed care model; high rural demand.

Benefits
Personal care (5-7 hours/day) Respite (240 hours/year) Adult day care ($65/day) Home modifications ($1,500 avg.)

Tennessee Options for Community Living

TN Options

Age 60+
General Tennessee resident, at risk of nursing home.
Income Limits ~$2,000/month individual, varies
Asset Limits $5,000 individual
TN

Limited funding; rural/urban balance.

Benefits
In-home care (3-5 hours/week) Respite (up to 10 days/year) Transportation (~5 trips/month)

Medicare Savings Program (MSP)

Tennessee Medicare Savings Program

Age 65+ or disabled
General TN resident, Medicare Part A/B.
Income Limits (2025) ~$2,510/month (QMB), ~$3,380/month (SLMB), ~$3,598/month (QI)—individual.
Asset Limits $9,430 (individual), $14,130 (couple).
TN

Three tiers; includes Extra Help for Part D; no waitlist.

Benefits
Covers Part B premiums ($174.70/month) Deductibles ($240/year) Copays (~20%)

Low-Income Home Energy Assistance Program (LIHEAP)

Tennessee LIHEAP

Age 60+ prioritized
General TN resident, low-income household.
Income Limits (2025) ~$3,970/month individual, 185% FPL
Asset Limits Not assessed; income-focused.
TN

Covers gas, electric, propane; emergency aid available.

Benefits
Heating/cooling aid ($300-$1,000/season) Emergency aid ($500 max)

Family Caregiver Support Program (FCSP)

Tennessee Family Caregiver Support Program

Age
General Caregivers of 60+ needing care or 55+ caregivers of others; TN resident; functional needs (2+ ADLs).
Income Limits (2025) No strict cap; prioritizes low-income ~$24,980/year
Asset Limits Not assessed; need-based.
TN

Includes grandparent caregivers; high rural demand.

Benefits
Respite (4-6 hours/week or 5 days/year) Adult day care ($60/day) Training Supplies (~$500/year)

Senior Community Service Employment Program (SCSEP)

Tennessee SCSEP

Age 55+
General unemployed, low-income, TN resident.
Income Limits (2025) ~$1,983/month 125% FPL
Asset Limits Not specified; income-focused.
TN

Priority for veterans, rural residents; AARP/Goodwill partnership.

Benefits
Paid training (~20 hours/week at ~$7.25/hour) Job placement

VA Aid and Attendance (A&A) and Housebound Benefits

Tennessee VA Aid and Attendance/Housebound

Age 65+ or disabled veteran/spouse
General TN resident, wartime service, need for ADL help (A&A) or homebound.
Income Limits (2025) Net income < ~$1,984/month (veteran with dependent, A&A); pension offsets income.
Asset Limits ~$155,356 net worth limit
TN

High veteran population; supports rural/urban care needs.

Benefits
Cash (~$1,433-$2,642/month veteran, ~$951-$1,318 spouse) for care costs (e.g., in-home, assisted living)

Elderly Nutrition Program

Tennessee Elderly Nutrition Program

Age 60+
General TN resident; no income limit but prioritizes low-income.
Income Limits (2025) None; donations encouraged.
Asset Limits Not assessed.
TN

Serves ~50,000 annually; 200+ congregate sites plus Meals on Wheels.

Benefits
Congregate meals ($5-$7/meal value) at senior centers Home-delivered meals ($5-$7/meal)

Property Tax Relief Program

Tennessee Property Tax Relief Program

Age 65+
General TN resident, homeowner/renter (or widow/er 50+, disabled 18+).
Income Limits (2025) ~$45,000/year household, excludes half of Social Security
Asset Limits Not assessed; income-focused.
TN

Rebates up to $1,000; serves ~100,000 annually.

Benefits
Tax rebates (~$250-$1,000 based on income; e.g., $1,000 if income < $8,000)

Places of interest near Trevecca Center for Rehabilitation and Healing

Address 1.9 miles from city center Info Estimated distance in miles from Nashville's city center to Trevecca Center for Rehabilitation and Healing's address, calculated via Google Maps. — 2.64 miles to nearest hospital (Vanderbilt Hypertension Center)

Calculate Travel Distance to Trevecca Center for Rehabilitation and Healing

Add your location

Address

Staffing Data (Q2 2025)

This data corresponds to Q2 2025 and is based on CMS Payroll-Based Journal.

Total staff 378
Employees 255
Contractors 123
Staff to resident ratio 1.70:1
5% worse than Tennessee average

Tennessee average ratio: 1.79:1

Avg staff/day 108
Average shift 8.8 hours
6% better than Tennessee average

Tennessee average: 8.3 hours

Total staff hours (quarter) 86,139
Nursing staff breakdown
Registered Nurse

Manages medical care and health needs.

Total count 32
Average shift length Info Average shift length. Calculated as total hours divided by days worked and average staff per day. 9.4 hours

This role is partially covered by contractors.

Licensed Practical Nurse

Assists with medical care and medications.

Total count 106
Average shift length Info Average shift length. Calculated as total hours divided by days worked and average staff per day. 9.2 hours

This role is partially covered by contractors.

Certified Nursing Assistant

Helps with daily care and mobility.

Total count 171
Average shift length Info Average shift length. Calculated as total hours divided by days worked and average staff per day. 9.4 hours

This role is partially covered by contractors.

Contractor staffing

Total hours from contractors

4.4%

3,794 contractor hours this quarter

Licensed Practical Nurse: 56 Certified Nursing Assistant: 50 Registered Nurse: 17
Staff by category
Certified Nursing Assistant1215017140,82091100%9.4
Licensed Practical Nurse505610619,64791100%9.2
Registered Nurse1517325,12891100%9.4
Other Dietary Services Staff130132,42591100%7.4
Clinical Nurse Specialist8082,2148492%6.9
RN Director of Nursing4042,1048796%8.2
Physical Therapy Aide6062,0098088%7
Occupational Therapy Aide5051,7157785%8.5
Mental Health Service Worker3031,5126875%8
Qualified Activities Professional5051,48291100%8.9
Respiratory Therapy Technician5051,4797684%6.9
Qualified Social Worker3031,4116976%7.5
Physical Therapy Assistant7071,2647380%7
Speech Language Pathologist4041,1177380%6.4
Nurse Practitioner2025186571%8
Administrator1015126470%8
Medication Aide/Technician1013955358%7.5
Therapeutic Recreation Specialist1013826167%6.3
Dietitian101622%2.8
171 Certified Nursing Assistant
% of Days 100%
106 Licensed Practical Nurse
% of Days 100%
32 Registered Nurse
% of Days 100%
13 Other Dietary Services Staff
% of Days 100%
8 Clinical Nurse Specialist
% of Days 92%
4 RN Director of Nursing
% of Days 96%
6 Physical Therapy Aide
% of Days 88%
5 Occupational Therapy Aide
% of Days 85%
3 Mental Health Service Worker
% of Days 75%
5 Qualified Activities Professional
% of Days 100%
5 Respiratory Therapy Technician
% of Days 84%
3 Qualified Social Worker
% of Days 76%
7 Physical Therapy Assistant
% of Days 80%
4 Speech Language Pathologist
% of Days 80%
2 Nurse Practitioner
% of Days 71%
1 Administrator
% of Days 70%
1 Medication Aide/Technician
% of Days 58%
1 Therapeutic Recreation Specialist
% of Days 67%
1 Dietitian
% of Days 2%

Facility Characteristics

Source: CMS Long-Term Care Facility Characteristics (Data as of Jan 2026)

Total residents 222
Medicare
31
14% of residents
Medicaid
30
13.5% of residents
Private pay or other
161
72.5% of residents
Programs & Services
Residents Group

Residents meet regularly to discuss policies, care quality, and activities

Active Resident Council

Organized group of residents that meets regularly to discuss facility policies, quality of life, and activities.

Quality of care over time

These measures show how residents usually do over time at this home, based on health outcomes and preventive care.

High-risk clinical events score Info A composite score based on pressure ulcers, falls with injury, weight loss, walking ability decline, and activities of daily living decline. 9.4
10% better than Tennessee average

Tennessee average: 10.5

Functional decline score Info A composite score based on activities of daily living decline, walking ability decline, and incontinence. 19.0
In line with Tennessee average

Tennessee average: 19.5

Long-stay resident measures
Significantly above average Tennessee avg: 3.9 Info CMS star rating based on long-stay quality measure performance. 5 stars = significantly above average, 1 star = significantly below average.
Need for Help with Daily Activities Increased Info Percent of long-stay residents whose need for help with daily activities has increased 17.1%
7% worse than Tennessee average

Tennessee average: 16.0%

Walking Ability Worsened Info Percent of long-stay residents whose ability to move independently worsened 16.3%
25% better than Tennessee average

Tennessee average: 21.7%

Low Risk Residents with Bowel/Bladder Incontinence Info Percent of low risk long-stay residents who lose control of their bowels or bladder 23.4%
13% worse than Tennessee average

Tennessee average: 20.7%

Falls with Major Injury Info Percent of long-stay residents experiencing one or more falls with major injury 2.7%
27% better than Tennessee average

Tennessee average: 3.7%

High Risk Residents with Pressure Ulcers Info Percent of long-stay high risk residents with pressure ulcers 5.0%
8% better than Tennessee average

Tennessee average: 5.4%

Urinary Tract Infection Info Percent of long-stay residents with a urinary tract infection 0.8%
61% better than Tennessee average

Tennessee average: 2.1%

Lost Too Much Weight Info Percent of long-stay residents who lose too much weight 5.9%
7% better than Tennessee average

Tennessee average: 6.3%

Depressive Symptoms Info Percent of long-stay residents who have depressive symptoms 13.9%
26% worse than Tennessee average

Tennessee average: 11.0%

Antipsychotic Use Info Percent of long-stay residents who received an antipsychotic medication 3.7%
78% better than Tennessee average

Tennessee average: 16.5%

Pneumococcal Vaccine Info Percent of long-stay residents assessed and appropriately given the pneumococcal vaccine 63.7%
29% worse than Tennessee average

Tennessee average: 89.9%

Influenza Vaccine Info Percent of long-stay residents assessed and appropriately given the seasonal influenza vaccine 85.7%
9% worse than Tennessee average

Tennessee average: 94.5%

Hospitalizations per 1,000 days Info Number of hospitalizations per 1,000 long-stay resident days. 1.36
14% better than Tennessee average

Tennessee average: 1.58

ED visits per 1,000 days Info Number of outpatient emergency department visits per 1,000 long-stay resident days. 0.95
39% better than Tennessee average

Tennessee average: 1.57

Short-stay resident measures
Significantly above average Tennessee avg: 3.4 Info CMS star rating based on short-stay quality measure performance. 5 stars = much above average, 1 star = much below average.
Pneumococcal Vaccine Info Percent of short-stay residents assessed and appropriately given the pneumococcal vaccine 30.6%
62% worse than Tennessee average

Tennessee average: 79.7%

Antipsychotic medication increase Info Percent of short-stay residents who newly received an antipsychotic medication 0.0%
100% better than Tennessee average

Tennessee average: 1.7%

Influenza Vaccine Info Percent of short-stay residents assessed and appropriately given the seasonal influenza vaccine 48.0%
40% worse than Tennessee average

Tennessee average: 79.8%

Re-hospitalized after SNF stay Info Percentage of short-stay residents who were re-hospitalized after their nursing home admission. 19.9%
10% better than Tennessee average

Tennessee average: 22.2%

Emergency department visits Info Percentage of short-stay residents who had an outpatient emergency department visit. 4.1%
63% better than Tennessee average

Tennessee average: 11.2%

Falls with major injury Info Percentage of SNF residents who experience falls with major injury during their stay. 0.5%
36% better than Tennessee average

Tennessee average: 0.8%

Ability to care for self at discharge Info Percentage of residents at or above expected ability to care for themselves at discharge. 47.8%
11% worse than Tennessee average

Tennessee average: 53.7%

Successful return to home or community Info Rate of successful return to home or community from a skilled nursing facility. 51.9%
In line with Tennessee average

Tennessee average: 50.6%

Penalties and fines

Federal penalties imposed by CMS for regulatory violations, including civil money penalties (fines) and denials of payment for new Medicare/Medicaid admissions.

Source: CMS Penalties Database (Data as of Jan 2026)

Total fines amount $9K
89% lower than Tennessee average

Tennessee average: $86K

Number of fines 2
15% more fines than Tennessee average

Tennessee average: 1.7

Payment Denials Info Serious action where Medicare and/or Medicaid temporarily stops payments for new residents until issues are fixed. 0
100% fewer payment denials than Tennessee average

Tennessee average: 0.5

Fines amount comparison
This facility $9K
Tennessee average $86K
Penalty History

Penalties are imposed by CMS for violations of federal nursing home regulations.

Civil Money Penalty Info Fines imposed for noncompliance, which can be assessed per day or per instance of violation. Jun 21, 2023
$4K
Civil Money Penalty Info Fines imposed for noncompliance, which can be assessed per day or per instance of violation. Jun 21, 2023
$6K

Last updated: Jan 2026

Guides for Better Senior Living

Care Cost Calculator: See Prices in Your Area

Nursing Home Data Explorer

Don’t Wait Too Long: 7 Red Flag Signs Your Parent Needs Assisted Living Now

The True Cost of Assisted Living in 2025 – And How Families Are Paying For It

Understanding Senior Living Costs: Pricing Models, Discounts & Financial Assistance

Explore Open Rooms
1 Contact details
2 What type of senior care service are you looking for?
3 What budget do you have in mind for senior care?
4 How soon do you need to find care?
5 Additional details

Thank you for your interest!

Our team will be in touch shortly to help with next steps.