Triple Creek Retirement Community
Nursing Home & Assisted Living · Cincinnati, OH
CMS overall rating Info CMS (the Centers for Medicare & Medicaid Services) is the federal agency that rates nursing home quality. Its Overall Rating runs from 1 to 5 stars, combining health inspections, staffing, and quality measures, with inspections weighted most heavily.

Triple Creek Retirement Community

Nursing Home & Assisted Living · Cincinnati, OH
CMS overall rating Info CMS (the Centers for Medicare & Medicaid Services) is the federal agency that rates nursing home quality. Its Overall Rating runs from 1 to 5 stars, combining health inspections, staffing, and quality measures, with inspections weighted most heavily.
Calculator: See prices in your area
Triple Creek Retirement Community accepts Medicare, Medicaid, and private pay.

Overview of Triple Creek Retirement Community

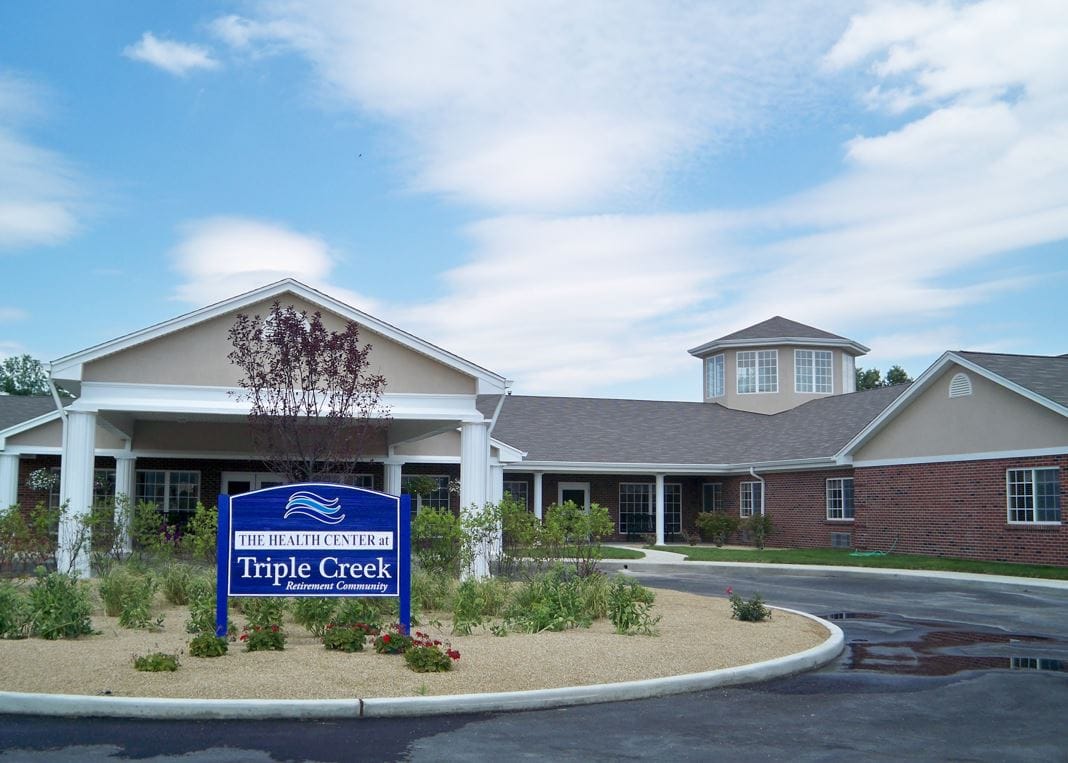
Triple Creek Retirement Community operates as a 94-bed skilled nursing facility in Cincinnati, Ohio, managed under the Trilogy Health Services network as a Continuing Care Retirement Community component. Owned by Karen Marzec and privately operated, the facility accepts Medicare, Medicaid, and private-pay placements.

All regulatory indicators align at peak performance. The facility holds a 5-star overall CMS rating, 57.1% above Ohio state benchmarks.

Health inspection performance earns 5 stars, 42.8% above state average. Staffing excellence receives 5-star designation, 22.8% above Ohio standards. Quality measures also rate 5 stars, 14.7% above state average. Across three years, the facility reports zero federal penalties, zero civil money penalties, and zero payment denials for perfect compliance.

Nursing staffing totals 3 hours 14 minutes daily per resident, 9% below Ohio’s 3 hour 32 minute state average. The facility maintains five full-time registered nurses providing consistent clinical oversight; 15 licensed practical nurses and 21 certified nursing assistants deliver direct resident care. Payroll investment reaches 58.4% of facility revenue, ranking 32nd of 203 Ohio facilities; positioning Triple Creek in the top third statewide for staffing commitment. Contractor hours represent 9.4% of total labor, concentrated in therapy disciplines and social services.

Quality outcomes generally exceed state standards.

Falls with major injury occur in 2.3% of residents, 34% better than Ohio average. Pressure ulcer rates among high-risk populations reach 3.0%, 24% better than state benchmarks. Antipsychotic medication use rates 4.5%, 47% below Ohio average. Unplanned weight loss in long-stay residents reaches 9.3%, however, 50% worse than state average and representing a care management concern.

Current census totals 51 residents (64.2% occupancy), 18% below Ohio’s 78.7% state average. Payer mix includes 39% Medicare (typically short-stay rehabilitation averaging 22 days), 47% Medicaid (typically 6-7 month placements), and 14% private pay. Operating loss reached $1.9 million in the latest fiscal year.

Triple Creek Retirement Community maintains the highest possible CMS regulatory rating across all quality domains while balancing acute post-acute rehabilitation and long-term skilled nursing services.

Quality ratings

Measured by Centers for Medicare & Medicaid Services (CMS)

Overall rating Info The Overall CMS Rating combines results from health inspections, staffing levels and quality measures. Health inspections carry the most weight. Staffing and quality scores can increase or decrease the final rating based on performance compared to state and national standards.
▲ 57.1% Above OH avg. ▲ 57.1% Above OH avg.OH average: 3.2Click the badge to see the full State ranking.Click here to see the full State ranking.
Health Inspection Info Based on the results of the facility's three most recent standard inspections and any complaint investigations. CMS reviews the number, scope, and severity of deficiencies, with more recent findings weighted more heavily.
▲ 42.8% Above OH avg. ▲ 42.8% Above OH avg.OH average: 2.8Click the badge to see the full State ranking.Click here to see the full State ranking.
Staffing Info Measures average nursing staff hours per resident per day, including Registered Nurses (RNs) and total nursing staff. Ratings are adjusted based on the level of care residents require and are compared to state and national benchmarks.
▼ 18.1% Below OH avg. ▼ 18.1% Below OH avg.OH average: 2.4Click the badge to see the full State ranking.Click here to see the full State ranking.
Quality Measures Info Based on clinical and physical health indicators reported to CMS, such as hospital readmissions, falls, pressure ulcers, and improvements in mobility. These measures reflect how well residents' health needs are being managed.
▲ 14.7% Above OH avg. ▲ 14.7% Above OH avg.OH average: 4.4Click the badge to see the full State ranking.Click here to see the full State ranking.

Staffing hours breakdown

Info Daily nursing hours per resident by staff type, reported to CMS. Higher is generally better — compare this facility to state and national averages to see where staffing stands.

Hours per resident per day — compared to Ohio state averages

Total nursing care / resident Info This home is ranked 150th out of 210 homes in Ohio for nurse hours. Total adjusted nursing hours per resident per day, combining RN, LPN, and aide time. CMS adjusts this for case-mix so facilities can be fairly compared.
3h 14m per day
Rank #150 / 210Nurse hours — State benchmarkedThis home is ranked 150th out of 210 homes in Ohio. Shows adjusted nurse hours per resident per day benchmarked to the Ohio average, with a ranking across 210 Ohio facilities. More hours mean more direct care. The national average is about 3.5 hrs; below 3.0 is a red flag.Rankings are based only on facilities in Ohio that report data for that category. Facilities without available data are excluded from the ranking.Click the rank badge to see the full State ranking.Click here to see the full State ranking.
This facility Ohio avg (3h 32m per day)
vs Ohio avg
-9%

2 of 6 metrics below state avg

Standout metric Physical Therapist is +168% above state avg
Staff typeHours / Day / Residentvs state avg
Registered Nurse (RN) Info RNs hold the highest nursing license and can assess residents, interpret test results, and direct care plans. More RN hours per day often signals stronger clinical oversight and faster response to health changes. 47m per day ▲ 22% State avg: 38m per day · National avg: 41m per day
LPN / LVN Info Licensed Practical Nurses (LPNs) or Licensed Vocational Nurses (LVNs) deliver routine hands-on care — medication administration, wound dressing, and monitoring vital signs. They work under RN supervision and make up a large share of daily bedside care. 1h 13m per day ▲ 27% State avg: 58m per day · National avg: 52m per day
Nurse Aide Info Certified Nurse Aides (CNAs) provide the most direct day-to-day assistance: bathing, dressing, feeding, and mobility. Nurse aide hours are typically the largest staffing category and directly affect residents' quality of life. 1h 44m per day ▼ 19% State avg: 2h 7m per day · National avg: 2h 20m per day
Weekend Total Nursing Info Combined nursing hours (RN + LPN + Nurse Aide) per resident per day on weekends. Staffing often drops on weekends — this figure reveals whether the facility maintains adequate coverage outside of weekday hours. 3h 5m per day ▼ 7% State avg: 3h 20m per day · National avg: 3h 27m per day
Physical Therapist Info Hours per resident per day provided by licensed Physical Therapists (PTs) or PT Assistants. PT services help residents recover mobility after injury or illness and are especially important for post-acute (short-stay) rehabilitation. 9m per day ▲ 168% State avg: 3m per day · National avg: 4m per day
Weekend RN Info Registered nurse hours specifically on weekends. Facilities sometimes reduce RN presence on Saturdays and Sundays — a low weekend RN figure compared to weekday hours can indicate reduced clinical oversight when most administrative staff are absent. 35m per day ▲ 39% State avg: 25m per day · National avg: 29m per day

Capacity and availability

This home usually has availability

Lower occupancy than the Ohio average: 78.7%
Occupancy rate
64.2% Rank #183 / 211Occupancy rate — State benchmarkedThis home is ranked 183rd out of 211 homes in Ohio. Shows this facility's occupancy rate versus the Ohio average, with its Statewide rank out of 211. Higher occupancy signals strong local demand and financial stability.Rankings are based only on facilities in Ohio that report data for that category. Facilities without available data are excluded from the ranking.Click the rank badge to see the full State ranking.Click here to see the full State ranking.
Avg. Length of Stay
52 days
Bed community size
56-bed community Rank #202 / 323Bed count — State benchmarkedThis home is ranked 202nd out of 323 homes in Ohio. Shows this facility's certified or reported bed count compared to other Ohio facilities. Larger communities may offer more amenities, programs, and on-site services for residents and families.Rankings are based only on facilities in Ohio that report data for that category. Facilities without available data are excluded from the ranking.Click the rank badge to see the full State ranking.Click here to see the full State ranking.
A moderately sized community that may balance personal attention with shared amenities and social activities.
Walk Score
Walk Score: 12 / 100 Rank #606 / 705Walk Score — State benchmarkedThis home is ranked 606th out of 705 homes in Ohio. Shows how walkable this facility's neighborhood is compared to the average Walk Score across Ohio facilities. Higher scores benefit residents, families, and staff.Rankings are based only on facilities in Ohio that report data for that category. Facilities without available data are excluded from the ranking.Click the rank badge to see the full State ranking.Click here to see the full State ranking.
Car-dependent. Most errands require a car, with limited nearby walkable options.

Contact Triple Creek Retirement Community

Staffing Data

Reporting period: October 1 – December 31, 2025 (Q4 2025). Source: CMS Payroll-Based Journal report.

Total staff 86
Employees 73
Contractors 13
Staff to resident ratio 1.69 : 1
17% fewer staff per resident than Ohio average
Ohio average ratio: 2.04 : 1 Ohio average ratio: 2.04 : 1See full Ohio ranking
Avg staff/day 27
Average shift 8.2 hours
0% compared with Ohio average
Ohio average: 8.1 hours Ohio average shift: 8.1 hoursSee full Ohio ranking
Total staff hours (quarter) 20,441

Nursing staff breakdown

Q4 2025 · Oct 1 – Dec 31 More info This data comes from the CMS Payroll-Based Journal report covering October 1 – December 31, 2025.
Registered Nurse

Manages medical care and health needs.

RN Staff Info All 5 RN Staff are full-time employees. No contractors work on this role. 5
Average shift length Info Average shift length. Calculated as total hours divided by days worked and average staff per day. 9.2 hours
Licensed Practical Nurse

Assists with medical care and medications.

LPN Staff Info All 15 LPN Staff are full-time employees. No contractors work on this role. 15
Average shift length Info Average shift length. Calculated as total hours divided by days worked and average staff per day. 10.1 hours
Certified Nursing Assistant

Helps with daily care and mobility.

CNA Staff Info All 21 CNA Staff are full-time employees. No contractors work on this role. 21
Average shift length Info Average shift length. Calculated as total hours divided by days worked and average staff per day. 8.4 hours

Contractor staffing

Q4 2025 · Oct 1 – Dec 31 More info This data comes from the CMS Payroll-Based Journal report covering October 1 – December 31, 2025.

Total hours from contractors

9.4%

1,914 contractor hours this quarter

Respiratory Therapy Technician: 5 Physical Therapy Assistant: 3 Qualified Social Worker: 2 Physical Therapy Aide: 1 Medical Director: 1 Speech Language Pathologist: 1

Staff by category

Q4 2025 · Oct 1 – Dec 31 More info This data comes from the CMS Payroll-Based Journal report covering October 1 – December 31, 2025.
Certified Nursing Assistant210215,61392100%8.4
Licensed Practical Nurse150154,66592100%10.1
Medication Aide/Technician6061,7418289%8.9
Other Dietary Services Staff7071,74092100%7.5
Registered Nurse5051,59792100%9.2
Clinical Nurse Specialist8089926368%7.6
Nurse Practitioner2027206773%8.6
Respiratory Therapy Technician0556096975%6.8
RN Director of Nursing5055345964%7.7
Administrator1015046368%8
Physical Therapy Assistant0334426874%6.5
Physical Therapy Aide0114056571%6.2
Dietitian1013934953%8
Qualified Social Worker0223706065%6.2
Medical Director011571213%4.8
Speech Language Pathologist0113244%8
Occupational Therapy Assistant202295155%0.5
21 Certified Nursing Assistant
% of Days 100%
15 Licensed Practical Nurse
% of Days 100%
6 Medication Aide/Technician
% of Days 89%
7 Other Dietary Services Staff
% of Days 100%
5 Registered Nurse
% of Days 100%
8 Clinical Nurse Specialist
% of Days 68%
2 Nurse Practitioner
% of Days 73%
5 Respiratory Therapy Technician
% of Days 75%
5 RN Director of Nursing
% of Days 64%
1 Administrator
% of Days 68%
3 Physical Therapy Assistant
% of Days 74%
1 Physical Therapy Aide
% of Days 71%
1 Dietitian
% of Days 53%
2 Qualified Social Worker
% of Days 65%
1 Medical Director
% of Days 13%
1 Speech Language Pathologist
% of Days 4%
2 Occupational Therapy Assistant
% of Days 55%

Penalties and fines

Federal penalties imposed by CMS for regulatory violations, including civil money penalties (fines) and denials of payment for new Medicare/Medicaid admissions.

Source: CMS Penalties Database

No penalties in the past 3 years

No civil money penalties or payment denials were reported in the last 3 years.

Quality of care over time

These measures show how residents usually do over time at this home, based on health outcomes and preventive care.

High-risk clinical events score Info A composite score based on pressure ulcers, falls with injury, weight loss, walking ability decline, and activities of daily living decline. 5.9
In line with Ohio average

Ohio average: 5.8

Functional decline score Info A composite score based on activities of daily living decline, walking ability decline, and incontinence. 13.3
5% worse than Ohio average

Ohio average: 12.7

Long-stay resident measures
Need for Help with Daily Activities Increased Info Percent of long-stay residents whose need for help with daily activities has increased 6.5%
6% better than Ohio average

Ohio average: 6.8%

Walking Ability Worsened Info Percent of long-stay residents whose ability to move independently worsened 8.7%
In line with Ohio average

Ohio average: 8.9%

Low Risk Residents with Bowel/Bladder Incontinence Info Percent of low risk long-stay residents who lose control of their bowels or bladder 24.8%
13% worse than Ohio average

Ohio average: 22.0%

Falls with Major Injury Info Percent of long-stay residents experiencing one or more falls with major injury 2.3%
34% better than Ohio average

Ohio average: 3.4%

High Risk Residents with Pressure Ulcers Info Percent of long-stay high risk residents with pressure ulcers 3.0%
24% better than Ohio average

Ohio average: 3.9%

Urinary Tract Infection Info Percent of long-stay residents with a urinary tract infection 0.0%
100% better than Ohio average

Ohio average: 0.5%

Lost Too Much Weight Info Percent of long-stay residents who lose too much weight 9.3%
50% worse than Ohio average

Ohio average: 6.2%

Depressive Symptoms Info Percent of long-stay residents who have depressive symptoms 14.9%
38% better than Ohio average

Ohio average: 24.0%

Antipsychotic Use Info Percent of long-stay residents who received an antipsychotic medication 4.5%
47% better than Ohio average

Ohio average: 8.4%

Pneumococcal Vaccine Info Percent of long-stay residents assessed and appropriately given the pneumococcal vaccine 88.7%
In line with Ohio average

Ohio average: 92.4%

Influenza Vaccine Info Percent of long-stay residents assessed and appropriately given the seasonal influenza vaccine 97.4%
In line with Ohio average

Ohio average: 94.5%

Short-stay resident measures
Pneumococcal Vaccine Info Percent of short-stay residents assessed and appropriately given the pneumococcal vaccine 84.3%
8% better than Ohio average

Ohio average: 78.0%

Antipsychotic medication increase Info Percent of short-stay residents who newly received an antipsychotic medication 1.5%
16% worse than Ohio average

Ohio average: 1.3%

Influenza Vaccine Info Percent of short-stay residents assessed and appropriately given the seasonal influenza vaccine 87.5%
16% better than Ohio average

Ohio average: 75.6%

Breakdown by payment type

Medicare

38% of new residents, usually for short-term rehab.

Typical stay 22 days

Private pay

43% of new residents, often for short stays.

Typical stay 3 - 4 months

Medicaid

19% of new residents, often for long-term daily care.

Typical stay 6 - 7 months

Facility Characteristics

Source: CMS Long-Term Care Facility Characteristics (Data as of Jan 2026)

Total residents 51
Medicare
20
39.2% of residents
Medicaid
24
47.1% of residents
Private pay or other
7
13.7% of residents
Programs & Services
Nurse Aide Training

State-approved Nurse Aide Training and Competency Evaluation Program on-site

CCRC

Part of a Continuing Care Retirement Community offering multiple care levels

Finances and operations

Based on CMS SNF Cost Report for fiscal year ending in 12/2023.

For-profit
Corporation
Net patient revenue Info Net patient revenue — what the home actually collects for resident care, after contractual allowances, bad debt and discounts are subtracted from its gross charges (CMS cost report, Worksheet G-3). It covers resident care only; money the home earns from other sources is shown separately as "Other income."
$8.2M
Net patient income Info Net patient income: net patient revenue minus the home's total operating expenses. A positive figure means it earns more from resident care than it spends to deliver it; a negative figure means the opposite. It excludes non-operating "other income."
-$2.0M
For-profit Corporation
Net patient revenue Info Net patient revenue — what the home actually collects for resident care, after contractual allowances, bad debt and discounts are subtracted from its gross charges (CMS cost report, Worksheet G-3). It covers resident care only; money the home earns from other sources is shown separately as "Other income."
$8.2M Rank #137 / 210Revenue — State benchmarkedThis home is ranked 137th out of 210 homes in Ohio. Shows this facility's annual revenue compared to the Ohio average. Higher revenue generally means more resources for staffing and capital — read alongside Payroll %.Rankings are based only on facilities in Ohio that report data for that category. Facilities without available data are excluded from the ranking.Click the rank badge to see the full State ranking.Click here to see the full State ranking.
Net patient income Info Net patient income: net patient revenue minus the home's total operating expenses. A positive figure means it earns more from resident care than it spends to deliver it; a negative figure means the opposite. It excludes non-operating "other income."
-$2.0M
Other income Info Money the home earns outside of resident care — such as investments, grants, rentals and other non-operating sources (CMS cost report, Worksheet G-3). It is tracked separately from net patient revenue: it is not part of that figure, and it is not included in net patient income.
$167.1K
Payroll costs Info Staff salaries plus wage-related costs — benefits such as payroll taxes, health insurance and retirement — from the home's own accounting records (CMS cost report, Worksheet A). Contract or agency labor is counted separately, under other operating costs. Rank #112 / 210Payroll — State benchmarkedThis home is ranked 112th out of 210 homes in Ohio. Shows total annual staff payroll benchmarked to the Ohio average. Higher payroll investment relative to peers often signals better staffing and less reliance on cheaper contract labor.Rankings are based only on facilities in Ohio that report data for that category. Facilities without available data are excluded from the ranking.Click the rank badge to see the full State ranking.Click here to see the full State ranking.
$4.9M 59.9% of net patient revenue Info Payroll as a share of revenue: staff salaries and wage-related benefits divided by net patient revenue. A higher figure means more of each revenue dollar goes to staff pay. Rank #32 / 210Payroll % — State benchmarkedThis home is ranked 32nd out of 210 homes in Ohio. Shows payroll as a percentage of revenue versus the Ohio average. Well-run Ohio facilities typically land around 54–64% — the top third Statewide. Below 25% may signal understaffing or heavy agency use — read with Staffing ratings.Rankings are based only on facilities in Ohio that report data for that category. Facilities without available data are excluded from the ranking.Click the rank badge to see the full State ranking.Click here to see the full State ranking.
Other operating costs Info Everything it costs to run the home apart from payroll — food, utilities, supplies, maintenance, contract labor and administration. Calculated as total operating expense minus payroll (staff salaries and wage-related benefits).
$5.3M
Total costs Info The home's total operating expense for the year — all the costs of running it, salaries included (CMS cost report, Worksheet G-3).
$10.3M

Who this home usually serves

TYPE OF STAY

Mix of rehab and long-term care

This home supports both short-term rehab and long-term care, with residents staying for a wide range of durations.

New residents most often arrive under private pay (43% of admissions), and a typical private pay stay runs around 3 - 4 months.

Admissions
247 total

Coverage residents most often arrive under.

Medicare 38%
Private pay 43%
Medicaid 19%
Discharges
323 total

Coverage residents most often leave under.

Medicare 26%
Private pay 47%
Medicaid 26%

Compare Nursing Homes around Cincinnati

The information below is reported by the Ohio Department of Health, Bureau of Survey and Certification.

5 facilities compared · CMS & OH Dept. of Health data

Triple Creek Retirement Community
NH
AL
Cincinnati
56
Facility 56
OH AVG 78
Rank #202 / 323
64.2%
Facility 64.2%
OH AVG 78.7%
Rank #183 / 211
-18%
3.23
Facility 3.23
OH AVG 3.54
Rank #150 / 210
-37%-9%
$0
Facility $0
OH AVG $74.0k
Rank #1 / 211
18
Facility 18
OH AVG 30.9
Rank #57 / 210
3.6
Facility 3.6
OH AVG 4.6
Rank #74 / 210
-46-
12
Facility 12
OH AVG 40
Rank #606 / 705
Karen Marzec
$8.2M
Facility $8.2M
OH AVG $10.1M
Rank #137 / 210
$4.9M
Facility $4.9M
OH AVG $3.9M
Rank #112 / 210
59.9%
Facility 59.9%
OH AVG 40.2%
Rank #32 / 210
366364
The Seasons
NH
AL
IL
RC
Cincinnati
45
Facility 45
OH AVG 78
Rank #246 / 323
83.8%
Facility 83.8%
OH AVG 78.7%
Rank #112 / 211
+6%
4.60
Facility 4.60
OH AVG 3.54
Rank #19 / 210
+49%+30%
$0
Facility $0
OH AVG $74.0k
Rank #1 / 211
22
Facility 22
OH AVG 30.9
Rank #80 / 210
7.3
Facility 7.3
OH AVG 4.6
Rank #196 / 210
-39-
34
Facility 34
OH AVG 40
Rank #409 / 705
Ga Hc Reit II Trs Midwest Ccrc Holdings, LLC
$5.5M
Facility $5.5M
OH AVG $10.1M
Rank #172 / 210
$3.8M
Facility $3.8M
OH AVG $3.9M
Rank #147 / 210
70.3%
Facility 70.3%
OH AVG 40.2%
Rank #13 / 210
365798
Mallard Cove Senior Living
NH
AL
MC
Sharonville
46
Facility 46
OH AVG 78
Rank #245 / 323
21.3%
Facility 21.3%
OH AVG 78.7%
Rank #211 / 211
-73%
5.90
Facility 5.90
OH AVG 3.54
Rank #6 / 210
+15%+67%
$0
Facility $0
OH AVG $74.0k
Rank #1 / 211
16
Facility 16
OH AVG 30.9
Rank #50 / 210
4.0
Facility 4.0
OH AVG 4.6
Rank #95 / 210
-34A+
48
Facility 48
OH AVG 40
Rank #277 / 705
Asad Ali
$1.5M
Facility $1.5M
OH AVG $10.1M
Rank #210 / 210
$2.6M
Facility $2.6M
OH AVG $3.9M
Rank #199 / 210
173.3%
Facility 173.3%
OH AVG 40.2%
Rank #1 / 210
366467
Scarlet Oaks
NH
AL
MC
RC
Cincinnati (Clifton)
87
Facility 87
OH AVG 78
Rank #121 / 323
74.7%
Facility 74.7%
OH AVG 78.7%
Rank #150 / 211
-5%
3.62
Facility 3.62
OH AVG 3.54
Rank #85 / 210
+4%+2%
$11.6k
Facility $11.6k
OH AVG $74.0k
Rank #157 / 211
30
Facility 30
OH AVG 30.9
Rank #111 / 210
4.3
Facility 4.3
OH AVG 4.6
Rank #116 / 210
163A+
13
Facility 13
OH AVG 40
Rank #602 / 705
Scarlet Oaks Healthcare LLC
$10.9M
Facility $10.9M
OH AVG $10.1M
Rank #61 / 210
$5.4M
Facility $5.4M
OH AVG $3.9M
Rank #66 / 210
49.8%
Facility 49.8%
OH AVG 40.2%
Rank #145 / 210
365978
Cottingham Retirement Community
NH
AL
HC
IL
MC
PC
RC
Cincinnati (Sharonville)
128
Facility 128
OH AVG 78
Rank #36 / 323
45.3%
Facility 45.3%
OH AVG 78.7%
Rank #203 / 211
-42%
2.78
Facility 2.78
OH AVG 3.54
Rank #198 / 210
-48%-21%
$0
Facility $0
OH AVG $74.0k
Rank #1 / 211
22
Facility 22
OH AVG 30.9
Rank #80 / 210
3.7
Facility 3.7
OH AVG 4.6
Rank #82 / 210
258A+
53
Facility 53
OH AVG 40
Rank #223 / 705
-
$7.5M
Facility $7.5M
OH AVG $10.1M
Rank #140 / 210
$3.7M
Facility $3.7M
OH AVG $3.9M
Rank #157 / 210
49.3%
Facility 49.3%
OH AVG 40.2%
Rank #148 / 210
365652

Financial Assistance for
Nursing Home in Ohio

Triple Creek Retirement Community is located in Cincinnati, Ohio.
Here are the financial assistance programs available to residents in Ohio.

Get Financial aid guidance

PASSPORT Waiver

Ohio Medicaid PASSPORT

Age 60+
General Ohio resident, Medicaid-eligible, nursing home-level care need.
Income Limits (2025) ~$2,829/month 300% FBR, individual
Asset Limits $2,000 (individual), $3,000 (couple).
OH

Administered through regional agencies; waitlists possible.

Benefits
Personal care (5-7 hours/day) Respite (240 hours/year) Adult day care ($65/day) Home modifications ($1,500 avg.)

Ohio Home Care Program (non-Medicaid)

OH HCP

Age 60+
General Ohio resident, at risk of decline.
Income Limits ~$2,000/month individual, varies
Asset Limits $5,000 individual
OH

Limited funding; regional variation.

Benefits
In-home care (3-5 hours/week) Respite (up to 10 days/year) Transportation (~5 trips/month)

Assisted Living Waiver (ALW)

Ohio Assisted Living Waiver

Age 21+ (65+ prioritized)
General OH resident, Medicaid-eligible, NFLOC.
Income Limits (2025) ~$2,829/month (individual); QIT required.
Asset Limits $2,000 (individual), $3,000 (couple).
OH

Covers ~300 facilities; room/board not included (separate cost).

Benefits
Personal care Meals Medication management Transportation (~$3,000-$4,000/month value)

Program of All-Inclusive Care for the Elderly (PACE)

Ohio PACE (e.g., McGregor PACE)

Age 55+
General OH resident (specific counties), NFLOC, safe with PACE support.
Income Limits (2025) ~$2,829/month (Medicaid-eligible); private pay option available.
Asset Limits $2,000 (individual), $3,000 (couple) for Medicaid enrollees.
OH

Available in 9 counties (e.g., Cuyahoga, Franklin); expanding via Healthy Aging Grants.

Benefits
Personal care (5-7 hours/day) Medical care Meals Transportation Respite Therapies

Medicare Savings Program (MSP)

Ohio Medicare Savings Program

Age 65+ or disabled
General OH resident, Medicare Part A/B.
Income Limits (2025) ~$2,510/month (QMB), ~$3,380/month (SLMB), ~$3,598/month (QI)—individual.
Asset Limits $9,430 (individual), $14,130 (couple).
OH

Three tiers; includes Extra Help for Part D; no waitlist.

Benefits
Covers Part B premiums ($174.70/month) Deductibles ($240/year) Copays (~20%)

Home Energy Assistance Program (HEAP)

Ohio HEAP

Age 60+ prioritized
General OH resident, low-income household.
Income Limits (2025) ~$3,970/month individual, 185% FPL
Asset Limits Not assessed; income-focused.
OH

Covers gas, electric, oil; emergency aid via Winter/Summer Crisis Programs.

Benefits
Heating/cooling aid ($300-$1,000/season) Emergency aid ($500 max)

Family Caregiver Support Program (FCSP)

Ohio Family Caregiver Support Program

Age
General Caregivers of 60+ needing care or 55+ caregivers of others; OH resident; functional needs (2+ ADLs).
Income Limits (2025) Prioritizes ~$24,980/year (individual); no strict cap.
Asset Limits Not assessed; need-based.
OH

12 AAAs; rural/low-income priority; volunteer respite option.

Benefits
Respite (4-6 hours/week or 5 days/year) Adult day care ($60/day) Training Supplies (~$500/year)

VA Aid and Attendance (A&A) and Housebound Benefits

Ohio VA Aid and Attendance/Housebound

Age 65+ or disabled veteran/spouse
General OH resident, wartime service, need for ADL help (A&A) or homebound.
Income Limits (2025) Net income < ~$1,984/month (veteran with dependent, A&A); pension offsets income.
Asset Limits ~$155,356 net worth limit
OH

High veteran demand; supports care in multiple settings.

Benefits
Cash (~$1,433-$2,642/month veteran, ~$951-$1,318 spouse) for care costs (e.g., in-home, assisted living)

Homestead Exemption

Ohio Homestead Exemption

Age 65+ (or disabled)
General OH resident, homeowner, low-income.
Income Limits (2025) ~$38,500/year individual, adjusted annually
Asset Limits Not assessed; home ownership required.
OH

Reduces taxable value by $25,000; applies to primary residence.

Benefits
Tax reduction (~$400-$800/year avg., varies by county)

Save the Dream Ohio (Homeowner Assistance Fund)

Ohio Save the Dream

Age 60+ prioritized
General OH resident, homeowner, hardship post-Jan 21, 2020.
Income Limits (2025) ~$147,600/year family of 4, 150% AMI; varies by county
Asset Limits Not assessed; hardship-focused.
OH

Covers delinquent mortgages, utilities, taxes; max $25,000 mortgage aid.

Benefits
Mortgage aid ($25,000 max) Utility/property tax aid ($5,000 avg.)

Frequently Asked Questions about Triple Creek Retirement Community

Is Triple Creek Retirement Community in a walkable area?

Triple Creek Retirement Community has a walk score of 12. Car-dependent. Most errands require a car, with limited nearby walkable options.

What is the occupancy rate at Triple Creek Retirement Community?

Triple Creek Retirement Community's occupancy is 64.2%.

Does Triple Creek Retirement Community operate as a for-profit or non-profit?

Triple Creek Retirement Community is registered as a for-profit.

Are there photos of Triple Creek Retirement Community?

Yes — there is 1 photo of Triple Creek Retirement Community in the photo gallery on this page.

What is the phone number of Triple Creek Retirement Community?

(513) 851-0601 will put you in contact with the team at Triple Creek Retirement Community.

Is Triple Creek Retirement Community Medicare or Medicaid certified?

Yes — Triple Creek Retirement Community is a CMS-certified provider of Medicare and Medicaid.

Guides for Better Senior Living

Care Cost Calculator: See Prices in Your Area

Nursing Home Data Explorer

Don’t Wait Too Long: 7 Red Flag Signs Your Parent Needs Assisted Living Now

The True Cost of Assisted Living in 2025 – And How Families Are Paying For It

Understanding Senior Living Costs: Pricing Models, Discounts & Financial Assistance