


Total staff
71
Employees
47
Contractors
24
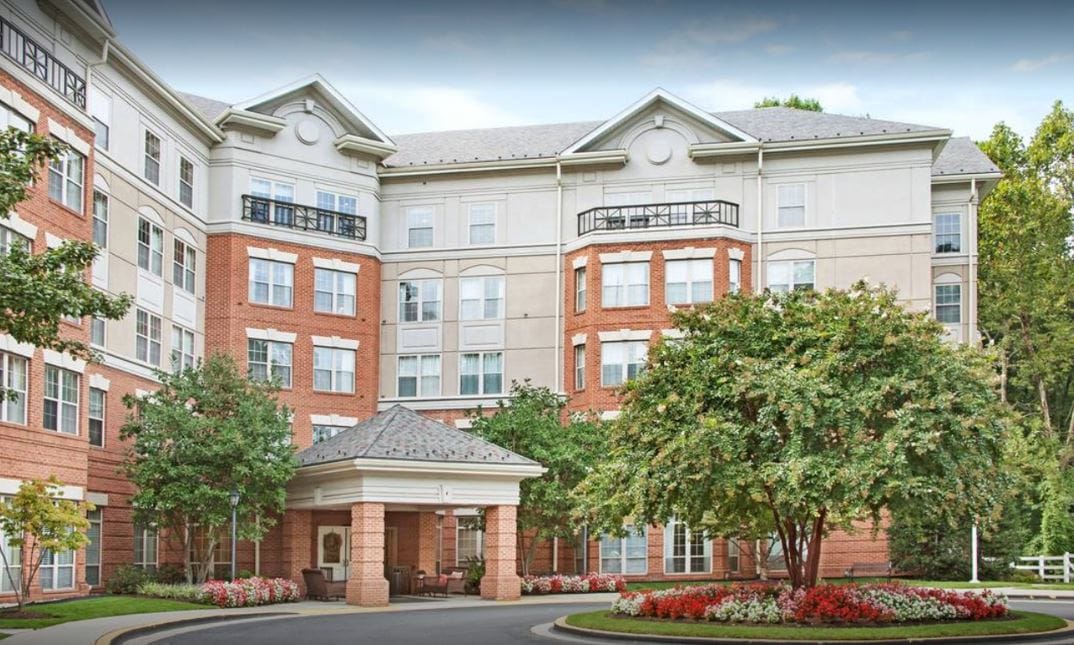
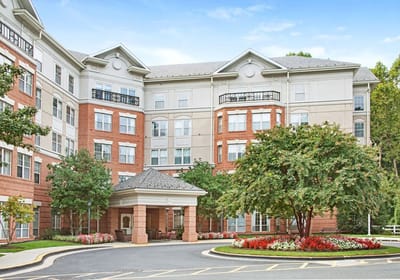


Tuckerman Rehabilitation & Healthcare Center is a beacon of warmth and compassion in the realm of skilled nursing, closely linked to John Hopkins Suburban Hospital. With a progressive rehab approach, the center prioritizes post-acute rehabilitation, aiming to swiftly reintegrate patients into their homes. Situated within Rockville, the facility prides itself on forging partnerships with esteemed healthcare providers, delivering exceptional clinical care while enriching the lives of individuals on physical, emotional, and spiritual levels.
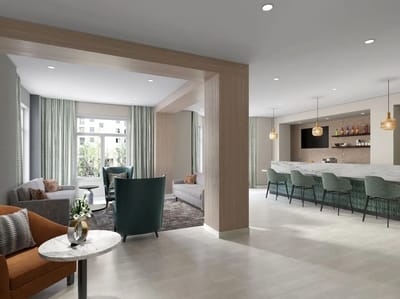
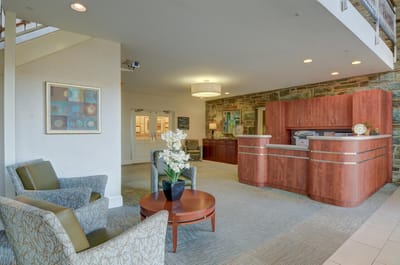
Nestled in a scenic residential area just outside Washington, DC, Tuckerman boasts a serene atmosphere conducive to healing and recovery. The subacute wing, with its personalized care, top-notch rehab programming, and state-of-the-art equipment, facilitates successful recovery from various medical conditions. Residents enjoy a plethora of amenities including fine dining, lush gardens, and stimulating recreational activities, ensuring a holistic and rejuvenating experience during their stay.
| Staff type | Hours / Day / Resident | vs state avg |
|---|---|---|
|
Registered Nurse (RN)
| 1h 7m per day | ▲ 37% State avg: 49m per day · National avg: 41m per day |
|
LPN / LVN
| 36m per day | ▼ 35% State avg: 55m per day · National avg: 52m per day |
|
Nurse Aide
| 1h 44m per day | ▼ 19% State avg: 2h 9m per day · National avg: 2h 20m per day |
|
Weekend Total Nursing
| 3h 10m per day | ▼ 8% State avg: 3h 28m per day · National avg: 3h 26m per day |
|
Physical Therapist
| 13m per day | ▲ 165% State avg: 5m per day · National avg: 4m per day |
|
Weekend RN
| 51m per day | ▲ 38% State avg: 37m per day · National avg: 28m per day |
Reporting period: October 1 – December 31, 2025 (Q4 2025). Source: CMS Payroll-Based Journal report.
Manages medical care and health needs.
Assists with medical care and medications.
Helps with daily care and mobility.
Total hours from contractors
3,171 contractor hours this quarter
| Certified Nursing Assistant | 22 | 0 | 22 | 5,933 | 92 | 100% | 7.3 |
| Registered Nurse | 9 | 5 | 14 | 2,413 | 92 | 100% | 7.6 |
| Licensed Practical Nurse | 9 | 0 | 9 | 2,030 | 92 | 100% | 8.2 |
| Physical Therapy Assistant | 0 | 6 | 6 | 1,038 | 78 | 85% | 7.5 |
| Clinical Nurse Specialist | 2 | 0 | 2 | 942 | 69 | 75% | 7.9 |
| Respiratory Therapy Technician | 0 | 7 | 7 | 754 | 74 | 80% | 7.4 |
| Dietitian | 2 | 0 | 2 | 488 | 61 | 66% | 8 |
| Qualified Social Worker | 0 | 3 | 3 | 484 | 68 | 74% | 6.5 |
| Nurse Practitioner | 1 | 0 | 1 | 480 | 60 | 65% | 8 |
| Mental Health Service Worker | 1 | 0 | 1 | 480 | 60 | 65% | 8 |
| Administrator | 1 | 0 | 1 | 464 | 58 | 63% | 8 |
| Speech Language Pathologist | 0 | 1 | 1 | 380 | 57 | 62% | 6.7 |
| Physical Therapy Aide | 0 | 2 | 2 | 352 | 58 | 63% | 5.9 |
Federal penalties imposed by CMS for regulatory violations, including civil money penalties (fines) and denials of payment for new Medicare/Medicaid admissions.
Source: CMS Penalties Database
No penalties in the past 3 years
No civil money penalties or payment denials were reported in the last 3 years.
These measures show how residents usually do over time at this home, based on health outcomes and preventive care.
Maryland average: 78.4%
Maryland average: 1.4%
Maryland average: 80.6%
Maryland average: 21.2%
Maryland average: 9.9%
Maryland average: 0.8%
Maryland average: 53.7%
Maryland average: 50.6%
Quality measures are calculated from Minimum Data Set (MDS) assessments. For most measures, lower percentages indicate better care quality.
76% of new residents, usually for short-term rehab.
22% of new residents, often for short stays.
1% of new residents, often for long-term daily care.
Source: CMS Long-Term Care Facility Characteristics (Data as of Jan 2026)
Residents meet regularly to discuss policies, care quality, and activities
Family members meet regularly to discuss policies, care quality, and activities
State-approved Nurse Aide Training and Competency Evaluation Program on-site
Part of a Continuing Care Retirement Community offering multiple care levels
Organized group of family members that meets regularly to discuss facility policies, resident care, and activities.
Organized group of residents that meets regularly to discuss facility policies, quality of life, and activities.
Data sourced from CMS Long-Term Care Facility Characteristics quarterly report. Payer mix reflects the current resident census by primary payment source.
Historical financial and operational data for Tuckerman Rehabilitation & Healthcare Center from 2011–2022, based on CMS SNF Cost Reports.
Key figures below are for fiscal year ending in 12/2022 — the home's most recent complete cost report, an older period than most facilities report.
Based on the home's most recent complete CMS SNF Cost Report — fiscal year ending in 12/2022. This is an older period than most facilities report, so compare with that in mind.
Most residents typically stay for a few weeks or months before returning home or moving on.
Most new residents arrive under Medicare (76% of admissions), and a typical Medicare stay runs around 1 months.
Coverage residents most often arrive under.
Coverage residents most often leave under.
![]() 4.4 miles from city center
4.4 miles from city center
![]() Estimated distance in miles from Rockville's city center to Tuckerman Rehabilitation & Healthcare Center's address, calculated via Google Maps.
— 2.15 miles to nearest hospital (Suburban Hospital)
Estimated distance in miles from Rockville's city center to Tuckerman Rehabilitation & Healthcare Center's address, calculated via Google Maps.
— 2.15 miles to nearest hospital (Suburban Hospital)
Add your location
The information below is reported by the Maryland Department of Health, Office of Health Care Quality.
| Ingleside at King Farm | NH AL IL MC SNF | Rockville (King Farm) | 45
Facility
45
MD AVG
42
Rank
#219 / 685 |
73.8%
Facility
73.8%
MD AVG
80.3
Rank
#75 / 97 | -8% | 6.36
Facility
6.36
MD AVG
3.77
Rank
#6 / 143 | +5% | +68% | $0
Facility
$0
MD AVG
$65.0k
Rank
#1 / 145 | 16
Facility
16
MD AVG
49.9
Rank
#7 / 145 | 8.0
Facility
8.0
MD AVG
12.8
Rank
#37 / 145 | - | 33 | - |
73
Facility
73
MD AVG
43
Rank
#152 / 985 | Westminster Ingleside King Farm Retirement Communities Inc | $44.3MFiscal year ending 12/2023
Facility
$44.3MFiscal year ending 12/2023
MD AVG
$18.7M
Rank
#7 / 144 | $14.8MFiscal year ending 12/2023
Facility
$14.8MFiscal year ending 12/2023
MD AVG
$6.5M
Rank
#22 / 144 | 33.4%Fiscal year ending 12/2023
Facility
33.4%Fiscal year ending 12/2023
MD AVG
38.5%
Rank
#139 / 144 | 215353 | ||||
| Tuckerman Rehabilitation & Healthcare Center | NH PC RC SNF | Rockville | 41
Facility
41
MD AVG
42
Rank
#224 / 685 |
90.7%
Facility
90.7%
MD AVG
80.3
Rank
#35 / 97 | +13% | 2.88
Facility
2.88
MD AVG
3.77
Rank
#135 / 143 | +43% | -24% | $0
Facility
$0
MD AVG
$65.0k
Rank
#1 / 145 | 23
Facility
23
MD AVG
49.9
Rank
#18 / 145 | 4.6
Facility
4.6
MD AVG
12.8
Rank
#6 / 145 | - | 37 | - |
39
Facility
39
MD AVG
43
Rank
#534 / 985 | Calanthia Green | $6.6M*Fiscal year ending 12/2022These figures are from this home's most recent complete cost report — an older period than most facilities report. Compare with that in mind.
Facility
$6.6M*Fiscal year ending 12/2022These figures are from this home's most recent complete cost report — an older period than most facilities report. Compare with that in mind.
MD AVG
$18.7M
Rank
#138 / 144 | $2.6M*Fiscal year ending 12/2022These figures are from this home's most recent complete cost report — an older period than most facilities report. Compare with that in mind.
Facility
$2.6M*Fiscal year ending 12/2022These figures are from this home's most recent complete cost report — an older period than most facilities report. Compare with that in mind.
MD AVG
$6.5M
Rank
#142 / 144 | 39.8%*Fiscal year ending 12/2022These figures are from this home's most recent complete cost report — an older period than most facilities report. Compare with that in mind.
Facility
39.8%*Fiscal year ending 12/2022These figures are from this home's most recent complete cost report — an older period than most facilities report. Compare with that in mind.
MD AVG
38.5%
Rank
#87 / 144 | 215320 | ||||
| Revitz House | NH AL HC IL MC SNF | Rockville | 558
Facility
558
MD AVG
42
Rank
#1 / 685 |
67.8%
Facility
67.8%
MD AVG
80.3
Rank
#80 / 97 | -16% | 3.91
Facility
3.91
MD AVG
3.77
Rank
#41 / 143 | -37% | +4% | $0
Facility
$0
MD AVG
$65.0k
Rank
#1 / 145 | 25
Facility
25
MD AVG
49.9
Rank
#22 / 145 | 8.3
Facility
8.3
MD AVG
12.8
Rank
#40 / 145 | - | 378 | - |
81
Facility
81
MD AVG
43
Rank
#86 / 985 | Alison Baraf | $57.8MFiscal year ending 12/2023
Facility
$57.8MFiscal year ending 12/2023
MD AVG
$18.7M
Rank
#4 / 144 | $42.1MFiscal year ending 12/2023
Facility
$42.1MFiscal year ending 12/2023
MD AVG
$6.5M
Rank
#4 / 144 | 72.9%Fiscal year ending 12/2023
Facility
72.9%Fiscal year ending 12/2023
MD AVG
38.5%
Rank
#38 / 144 | 215071 | ||||
| Autumn Lake Healthcare at Oak Manor | NH MC PC RC SNF | Burtonsville (Perrywood Estates) | 145
Facility
145
MD AVG
42
Rank
#45 / 685 |
90.6%
Facility
90.6%
MD AVG
80.3
Rank
#36 / 97 | +13% | 3.48
Facility
3.48
MD AVG
3.77
Rank
#69 / 143 | -48% | -8% | $11.4k
Facility
$11.4k
MD AVG
$65.0k
Rank
#97 / 145 | 36
Facility
36
MD AVG
49.9
Rank
#54 / 145 | 7.2
Facility
7.2
MD AVG
12.8
Rank
#24 / 145 | 1 | 131 | - |
18
Facility
18
MD AVG
43
Rank
#756 / 985 | 3415 Greencastle Road Holdco LLC | $19.0MFiscal year ending 12/2023
Facility
$19.0MFiscal year ending 12/2023
MD AVG
$18.7M
Rank
#63 / 144 | $3.2MFiscal year ending 12/2023
Facility
$3.2MFiscal year ending 12/2023
MD AVG
$6.5M
Rank
#40 / 144 | 16.6%Fiscal year ending 12/2023
Facility
16.6%Fiscal year ending 12/2023
MD AVG
38.5%
Rank
#27 / 144 | 215315 | ||||
| Sterling Care Rockville Nursing | NH HOS PC RC SNF | Rockville | 100
Facility
100
MD AVG
42
Rank
#109 / 685 |
83.9%
Facility
83.9%
MD AVG
80.3
Rank
#61 / 97 | +4% | 3.10
Facility
3.10
MD AVG
3.77
Rank
#119 / 143 | -36% | -18% | $0
Facility
$0
MD AVG
$65.0k
Rank
#1 / 145 | 21
Facility
21
MD AVG
49.9
Rank
#16 / 145 | 21.0
Facility
21.0
MD AVG
12.8
Rank
#132 / 145 | - | 84 | - |
16
Facility
16
MD AVG
43
Rank
#772 / 985 | - | $13.6MFiscal year ending 12/2023
Facility
$13.6MFiscal year ending 12/2023
MD AVG
$18.7M
Rank
#73 / 144 | $5.2MFiscal year ending 12/2023
Facility
$5.2MFiscal year ending 12/2023
MD AVG
$6.5M
Rank
#130 / 144 | 38.1%Fiscal year ending 12/2023
Facility
38.1%Fiscal year ending 12/2023
MD AVG
38.5%
Rank
#142 / 144 | 215107 |
Tuckerman Rehabilitation & Healthcare Center is located in Rockville, Maryland.
Here are the financial assistance programs available to residents in Maryland.
Tuckerman Rehabilitation & Healthcare Center has a walk score of 39. Somewhat walkable. A few nearby services may be reachable on foot, but most trips require transportation.
Tuckerman Rehabilitation & Healthcare Center's occupancy is 83.2%.
No, Tuckerman Rehabilitation & Healthcare Center has a no-pet policy.
Tuckerman Rehabilitation & Healthcare Center is registered as a for-profit.
Yes — there are 8 photos of Tuckerman Rehabilitation & Healthcare Center in the photo gallery on this page.
Tuckerman Rehabilitation & Healthcare Center is located at 5550 Tuckerman Ln, Rockville, MD 20852.
(410) 500-1110 will put you in contact with the team at Tuckerman Rehabilitation & Healthcare Center.
Care Cost Calculator: See Prices in Your Area
Nursing Home Data Explorer
Don’t Wait Too Long: 7 Red Flag Signs Your Parent Needs Assisted Living Now
The True Cost of Assisted Living in 2025 – And How Families Are Paying For It
Understanding Senior Living Costs: Pricing Models, Discounts & Financial Assistance


