University Retirement Community

Independent Living in Davis

CMS overall rating Info The Overall CMS Rating is scored from 1 to 5 stars and combines results from health inspections, staffing levels, and quality measures. Health inspections carry the most weight. Staffing and quality scores can increase or decrease the final rating based on performance compared to state and national standards.
Calculator: See prices in your area
University Retirement Community accepts Medicare and private pay.

Overview of University Retirement Community

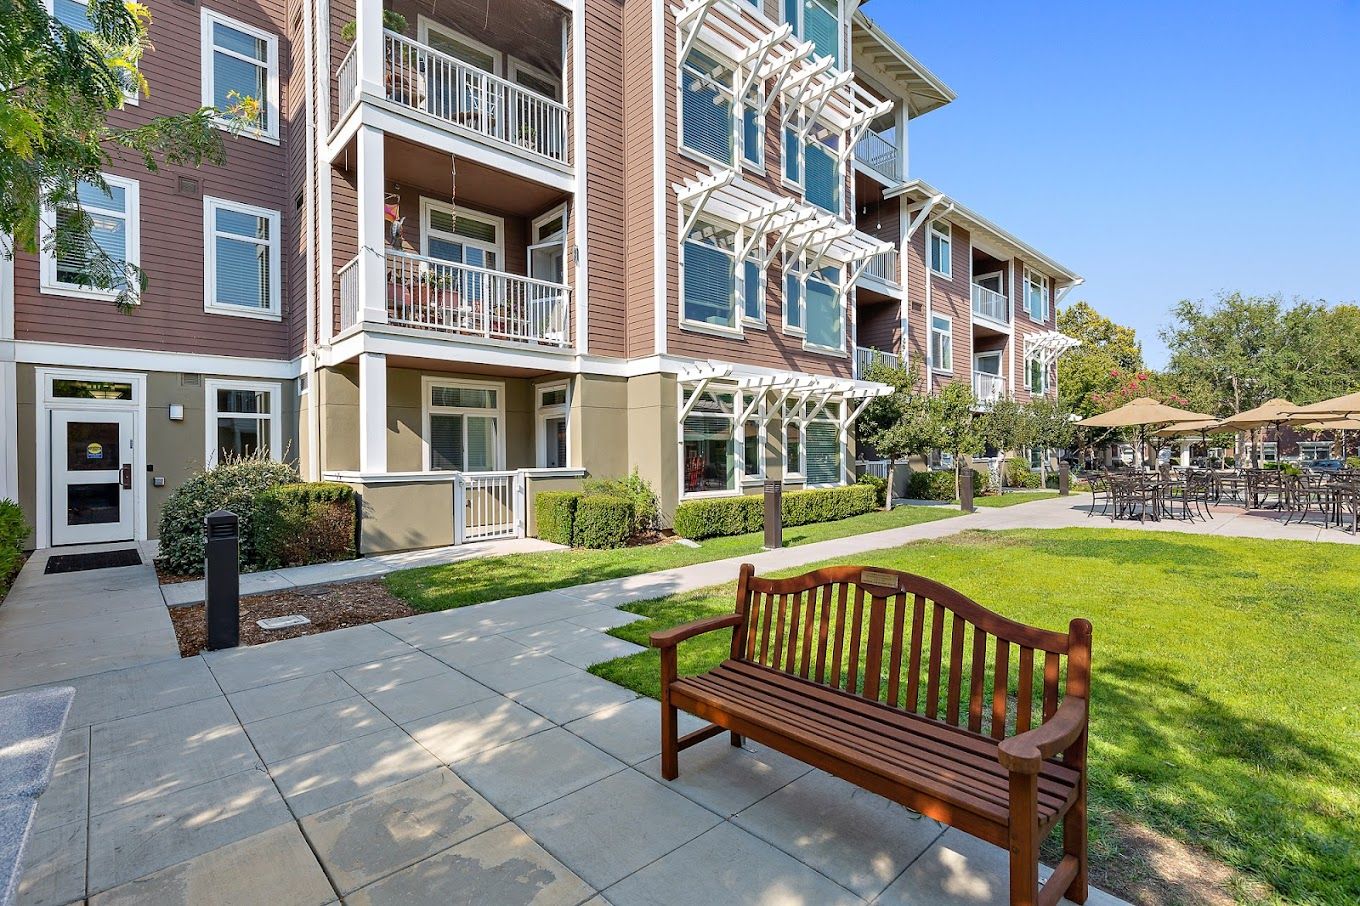
Located in the heart of Davis, CA, University Retirement Community is a luxury senior living community that offers its residents an extravagant independent living environment. The community provides its residents with stunning and snug accommodations with home maintenance and other household chores taken care of for a carefree living experience. Each residence is equipped with private decks, large windows, full kitchens, and large living and dining areas that foster a comfortable and convenient living environment.

Designed to nurture residents’ overall aspect of well-being, the community also offers an array of wellness initiatives and enriching activities. Residents keep their minds sharp with the community’s excellent range of lifelong learning opportunities that help stimulate their minds and cognitive abilities. Here at University Retirement Community, residents spend less time worrying about the small things, and more time pursuing the things they love.

(530) 747-7000

Managed by Maria Burton

Healthcare Administrator

Maria Burton serves as the Healthcare Administrator at University Retirement Community at Davis, leading the healthcare services to ensure residents receive exceptional care. She is part of the leadership team dedicated to supporting staff and meeting the community's needs with commitment and professionalism.

Quality ratings

Measured by Centers for Medicare & Medicaid Services (CMS)

Overall rating Info The Overall CMS Rating combines results from health inspections, staffing levels and quality measures. Health inspections carry the most weight. Staffing and quality scores can increase or decrease the final rating based on performance compared to state and national standards.
5/5 ▲ 1.4 California average: 3.6/5
Health Inspection Info Based on the results of the facility's three most recent standard inspections and any complaint investigations. CMS reviews the number, scope, and severity of deficiencies, with more recent findings weighted more heavily.
4/5 ▲ 0.9 California average: 3.2/5
Staffing Info Measures average nursing staff hours per resident per day, including Registered Nurses (RNs) and total nursing staff. Ratings are adjusted based on the level of care residents require and are compared to state and national benchmarks.
5/5 ▲ 1.6 California average: 3.5/5
Quality Measures Info Based on clinical and physical health indicators reported to CMS, such as hospital readmissions, falls, pressure ulcers, and improvements in mobility. These measures reflect how well residents' health needs are being managed.
4/5 ▼ 0.3 California average: 4.3/5

Staffing hours breakdown

Info Daily nursing hours per resident by staff type, reported to CMS. Higher is generally better — compare this facility to state and national averages to see where staffing stands.

Hours per resident per day — compared to California state averages

Total nursing care / resident Info This home is ranked 50th out of 271 homes in California.

Total adjusted nursing hours per resident per day, combining RN, LPN, and aide time. CMS adjusts this for case-mix so facilities can be fairly compared.
4h 45m per day
Rank #50 / 271Nurse hours — state benchmarkedThis home is ranked 50th out of 271 homes in California.Shows adjusted nurse hours per resident per day benchmarked to the California average, with a ranking across 271 California SNFs. More hours mean more direct care. The national average is about 3.5 hrs; below 3.0 is a red flag.
This facility California avg (4h 23m per day)
vs California avg
+9%

1 of 6 metrics below state avg

Standout metric Physical Therapist is +200% above state avg
Staff type Hours / day vs state avg
Registered Nurse (RN) Info RNs hold the highest nursing license and can assess residents, interpret test results, and direct care plans. More RN hours per day often signals stronger clinical oversight and faster response to health changes. 1h 39m per day ▲ 154% State avg: 39m per day · National avg: 41m per day
LPN / LVN Info Licensed Practical Nurses (LPNs) or Licensed Vocational Nurses (LVNs) deliver routine hands-on care — medication administration, wound dressing, and monitoring vital signs. They work under RN supervision and make up a large share of daily bedside care. 14m per day ▼ 81% State avg: 1h 13m per day · National avg: 52m per day
Nurse Aide Info Certified Nurse Aides (CNAs) provide the most direct day-to-day assistance: bathing, dressing, feeding, and mobility. Nurse aide hours are typically the largest staffing category and directly affect residents' quality of life. 2h 50m per day ▲ 8% State avg: 2h 38m per day · National avg: 2h 20m per day
Total Nursing (Weekend) Info Combined nursing hours (RN + LPN + Nurse Aide) per resident per day on weekends. Staffing often drops on weekends — this figure reveals whether the facility maintains adequate coverage outside of weekday hours. 4h 7m per day ■ Avg State avg: 4h 5m per day · National avg: 3h 26m per day
Physical Therapist Info Hours per resident per day provided by licensed Physical Therapists (PTs) or PT Assistants. PT services help residents recover mobility after injury or illness and are especially important for post-acute (short-stay) rehabilitation. 15m per day ▲ 200% State avg: 5m per day · National avg: 4m per day
RN (Weekend) Info Registered nurse hours specifically on weekends. Facilities sometimes reduce RN presence on Saturdays and Sundays — a low weekend RN figure compared to weekday hours can indicate reduced clinical oversight when most administrative staff are absent. 1h 13m per day ▲ 143% State avg: 30m per day · National avg: 28m per day

Capacity and availability

Avg. Length of Stay
112 days

Who this home usually serves

TYPE OF STAY

Mostly short-term rehab stays

Most residents typically stay for a few weeks or months before returning home or moving on.

Breakdown by payment type

Medicare

54% of new residents, usually for short-term rehab.

Typical stay 1 - 2 months

Private pay

46% of new residents, often for short stays.

Typical stay 2 - 3 years

Finances and operations

Voluntary non-profit community
Home revenue
$32.9M
Surplus of revenue
$5.1M
Voluntary non-profit community
Home revenue
$32.9M Rank #200 / 275Revenue — state benchmarkedThis home is ranked 200th out of 275 homes in California.Shows this facility's annual revenue compared to the California SNF average. Higher revenue generally means more resources for staffing and capital — read alongside Payroll %.
Surplus of revenue
$5.1M
Payroll costs Info The portion of the home's budget spent on staff, including nurses, caregivers, and other employees who support care and operations. Rank #50 / 275Payroll — state benchmarkedThis home is ranked 50th out of 275 homes in California.Shows total annual staff payroll benchmarked to the California average. Higher payroll investment relative to peers often signals better staffing and less reliance on cheaper contract labor.
$10.2M
31.1% of revenue Rank #12 / 275Payroll % — state benchmarkedThis home is ranked 12th out of 275 homes in California.Shows payroll as a percentage of revenue versus the California average. Well-run SNFs often land around 55–65%. Below 25% may signal understaffing or heavy agency use — read with Staffing ratings.
Other operating costs Info All remaining costs needed to run the home, such as food, utilities, building maintenance, supplies and administrative expenses.
$20.5M
Total costs $30.7M
Bed community size
500-bed community
A large-scale community that may provide a wide range of amenities, services, and structured programs.
Years in operation
26 years in operation
A longer operating history, which may indicate experience navigating regulations and delivering ongoing care.
Walk Score
Walk Score: 54 / 100 Rank #167 / 229Walk Score — state benchmarkedThis home is ranked 167th out of 229 homes in California.Shows how walkable this facility's neighborhood is compared to the average Walk Score across California SNFs. Higher scores benefit residents, families, and staff.
Moderately walkable. Some errands can be accomplished on foot, with a mix of nearby amenities.

About this community

Occupancy

Occupancy rate
10%
Rank #273 / 277Occupancy rate — state benchmarkedThis home is ranked 273rd out of 277 homes in California.Shows this facility's occupancy rate versus the California average, with its statewide rank out of 277. Higher occupancy signals strong local demand and financial stability.
Lower than the California average: 72.8%
Occupied beds
50 / 500
Average residents 87 per day

License Details

Facility TypeRcfe-continuing Care Retirement Community
StatusLicensed
IssuanceFebruary 18, 2000
CountyYolo
CMS Certification Number555769

Ownership & Operating Entity

University Retirement Community is legally operated by Univer Retire Com At Davis/pacific Retire Services, and administrated by Maria Burton.

What does this home offer?

Room sizes icon
Room sizes icon

Room Sizes: 563 / 1069 / 1145 / 1263 sq. ft

Housing options icon

Housing Options: 1 Bed / 2 Bed / 3 Bed

Building type icon
Building type icon

Building Type: 3-story

Fitness and recreation icon

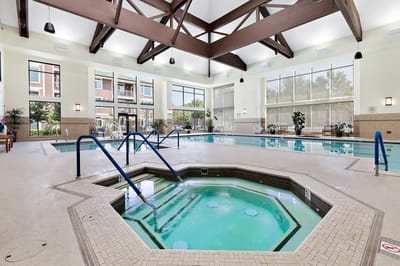
Fitness and Recreation

Types of Care at University Retirement Community

Independent Living

Contact University Retirement Community

Inspection History

In California, the Department of Social Services (for assisted living facilities) and the Department of Public Health (for nursing homes) conduct inspections to ensure resident safety and regulatory compliance.

Inspection Scorecard Info This scorecard compares key inspection, citation, and complaint metrics at this facility against the California state average. Metrics worse than average are highlighted in red; those better than average are highlighted in green.

Since 2021 vs. California state average
Overall vs. California average 1 Worse Metrics worse than California average:
• Official inspections (25% above)
7 Better Metrics better than California average:
• Total citations (90% below)
• Serious citations (Type A) (67% below)
• Moderate citations (Type B) (100% below)
• Total visits (6% below)
• Complaint visits (69% below)
• Other visits (14% below)
• Complaint investigations (60% below)
Latest Inspection January 12, 2026 Annual Inspection

Citations Info Citations are formal regulatory violations recorded during state inspections. California uses Type A (serious) and Type B (moderate) severity levels.

Metric This Facility California Average vs. California Avg
Total citations Info Formal regulatory violations recorded by California Community Care Licensing Division (CCLD) inspectors across all inspection types. 1 10 This facility has 90% fewer total citations than a typical California facility (1 vs. California avg 10).↓ 90% better
Serious citations (Type A) Info Violations that pose an immediate risk to resident health or safety. Type A citations are the most serious and typically require prompt corrective action. 1 3 This facility has 67% fewer serious citations (type a) than a typical California facility (1 vs. California avg 3).↓ 67% better
Moderate citations (Type B) Info Violations that do not pose an immediate risk but still represent a departure from required care or operational standards. Corrective action required within a specified timeframe. 0 4 This facility has 100% fewer moderate citations (type b) than a typical California facility (0 vs. California avg 4).↓ 100% better

Inspections & Visits Info Regulatory visits include scheduled inspections, complaint investigations, and other on-site visits by state regulators.

Metric This Facility California Average vs. California Avg
Total visits Info Combined count of complaint visits, other regulatory visits, and official scheduled inspections. 15 16 This facility has 6% fewer total visits than a typical California facility (15 vs. California avg 16).↓ 6% better
Complaint visits Info On-site visits triggered by formal complaints filed by residents, families, or staff. Fewer complaint visits generally indicate fewer reported concerns. 4 13 This facility has 69% fewer complaint visits than a typical California facility (4 vs. California avg 13).↓ 69% better
Other visits Info Regulatory visits that are neither routine inspections nor complaint investigations — administrative check-ins, follow-up reviews, licensing-related visits. 6 7 This facility has 14% fewer other visits than a typical California facility (6 vs. California avg 7).↓ 14% better
Official inspections Info Routine, scheduled inspections conducted by state regulators to evaluate whether the facility meets federal and state standards. 5 4 This facility has 25% more official inspections than a typical California facility (5 vs. California avg 4).↑ 25% worse
Complaint Investigations Info Investigations triggered by formal complaints filed by residents, families, or staff. Complaint Investigations can result in multiple complaint visits. This home had 4 complaint visits. 4 10 This facility has 60% fewer complaint investigations than a typical California facility (4 vs. California avg 10).↓ 60% better

Inspection Reports Summary Info An editor-reviewed summary of the themes and findings across this facility's recent inspection reports.

University Retirement Community at Davis had a mixed inspection record marked by supervision deficiencies leading to harm and a $10,000 fine issued on March 28, 2025. On September 26, 2025, inspectors cited one deficiency for inadequate supervision that allowed a resident to leave unattended, posing immediate risk, while other complaints about water and hygiene were unsubstantiated. The most recent annual inspection on January 12, 2026, found no deficiencies, indicating some improvement in compliance and facility conditions.

Read the full state inspection reports, including specific deficiencies and facility responses.

Show Inspection Reports

Health Inspection History

Inspections
Total health inspections 5

California average 12.5


Last Health inspection on Sep 2025

Total health citations
18 Rank #29 / 275Health citations — state benchmarkedThis home is ranked 29th out of 275 homes in California.Shows this facility's total health deficiency citations benchmarked to the California state average, with a ranking across all 275 CA SNFs. Lower citation counts earn a better rank.

California average 50.2

Citations per inspection
3.6 Rank #88 / 275Citations per inspection — state benchmarkedThis home is ranked 88th out of 275 homes in California.Shows average deficiency citations per CMS inspection for this facility versus the California mean across 275 SNFs with citation data. Lower is better.

California average 4.65


Health citations are formal notices following inspections when they fail to comply with safety and care standards.

16 of 18 citations resulted from standard inspections; and 2 of 18 resulted from complaint investigations.

Breakdown of citation severity (last 3 years)
Critical Health citations More info
0
100% better than California average

California average: 0.4


Serious Health citations More info 1
In line with California average

California average: 1

0 critical citations More info California average: 0.4

1 serious citation More info California average: 1

17 moderate citations More info California average: 47.2

0 minor citations More info California average: 1.5
Citations history (last 3 years)
Environmental moderate citation Info Issues related to building safety, cleanliness, maintenance, and overall living conditions. Sep 19, 2025
Corrected

Infection Control moderate citation Info Issues related to preventing and controlling infections, including hygiene practices and safety protocols. Sep 19, 2025
Corrected

Nutrition moderate citation Info Issues related to food quality, meal service, and resident's nutritional needs. Sep 19, 2025
Corrected

Pharmacy moderate citation Info Issues related to medication management, including how drugs are stored, administered, and monitored. Sep 19, 2025
Corrected

Financial Assistance for
Independent Living in California

University Retirement Community is located in Davis, California.
Here are the financial assistance programs available to residents in California.

Get Financial aid guidance

Multipurpose Senior Services Program

MSSP (Medi-Cal Waiver)

Age 65+
General California resident, Medi-Cal eligible, nursing home risk.
Income Limits (2025) ~$2,829/month 300% FBR, individual
Asset Limits $2,000 (individual), $3,000 (couple).
CA

County-managed; waitlists possible.

Benefits
In-home support (4-6 hours/day) Respite care (14 days/year) Meals (~$6/meal) Transportation (8 trips/month) Care management

In-Home Supportive Services (IHSS)

California IHSS

Age 65+
General California resident, Medicaid-eligible or low-income.
Income Limits ~$1,732/month individual, Medi-Cal threshold
Asset Limits $2,000 individual
CA

Can hire family as caregivers.

Benefits
Personal care (up to 283 hours/month) Homemaker services Respite (varies)

Multipurpose Senior Services Program (MSSP)

CA MSSP

Age 65+
General California resident, Medi-Cal-eligible, nursing home-eligible but community-capable.
Income Limits ~$2,829/month 300% FBR, individual
Asset Limits $2,000 individual
CA

Available in 38 counties; waitlists common.

Benefits
Case management Respite care (up to 10 days/year) Minor home mods (avg. $500) Adult day care (~$50/day)

Property Tax Postponement Program (PTP)

CA PTP

Age 62+
General California resident, own and live in home, 40% equity.
Income Limits (2025) ~$51,500/year household, adjusted annually
Asset Limits Equity-based; no strict asset cap.
CA

Deferred taxes accrue interest (5% as of 2024); repaid upon sale/death.

Benefits
Property tax deferral (avg. $1,000-$3,000/year, varies by county)

Assisted Living Waiver (ALW)

CA ALW

Age 65+ or disabled
General California resident, Medi-Cal-eligible, nursing home-eligible.
Income Limits ~$2,829/month 300% FBR, individual
Asset Limits $2,000 individual
CA

Available in 15 counties (e.g., LA, Sacramento); waitlists common.

Benefits
Personal care in ALFs (5-7 hours/day) Medication management Social services

California CARES Program

CA CARES

Age
General Caregivers of California residents 60+ needing help with 3+ daily activities; no caregiver age limit.
Income Limits No strict limit; cost-sharing above ~$2,500/month threshold.
Asset Limits Not applicable; need-based.
CA

High demand in urban areas; complements IHSS respite.

Benefits
Respite care (up to 10 days/year) Counseling (4-6 sessions/year) Training (2-3 workshops/year) Supplies (~$200/year)

Low-Income Home Energy Assistance Program (LIHEAP)

CA LIHEAP

Age 60+ priority
General California resident, low-income, utility/heating need.
Income Limits (2025) ~$2,510/month 200% of poverty level, individual
Asset Limits Not applicable; income-focused.
CA

High demand in inland/coastal extremes; weatherization capped at $5,000/home.

Benefits
Utility payments (avg. $500-$1,000/year) Weatherization (e.g., insulation, avg. $1,000-$3,000 savings)

Places of interest near University Retirement Community

Address 2.8 miles from city center Info Estimated distance in miles from Davis's city center to University Retirement Community's address, calculated via Google Maps.

Calculate Travel Distance to University Retirement Community

Add your location

Address

Staffing Data (Q2 2025)

This data corresponds to Q2 2025 and is based on CMS Payroll-Based Journal.

Total staff 66
Employees 51
Contractors 15
Staff to resident ratio 1.83:1
1833233% better than California average

California average ratio: 0.00:1

Avg staff/day 28
Average shift 7 hours
9% worse than California average

California average: 7.7 hours

Total staff hours (quarter) 17,726
Nursing staff breakdown
Registered Nurse

Manages medical care and health needs.

Total count 14
Average shift length Info Average shift length. Calculated as total hours divided by days worked and average staff per day. 7.8 hours

No contractors work on this role.

Licensed Practical Nurse

Assists with medical care and medications.

Total count 1
Average shift length Info Average shift length. Calculated as total hours divided by days worked and average staff per day. 10.3 hours

No contractors work on this role.

Certified Nursing Assistant

Helps with daily care and mobility.

Total count 26
Average shift length Info Average shift length. Calculated as total hours divided by days worked and average staff per day. 7.6 hours

This role is partially covered by contractors.

Contractor staffing

Total hours from contractors

12.5%

2,207 contractor hours this quarter

Respiratory Therapy Technician: 4 Physical Therapy Assistant: 3 Speech Language Pathologist: 2 Certified Nursing Assistant: 1 Qualified Social Worker: 1 Occupational Therapy Aide: 1 Physical Therapy Aide: 1 Medical Director: 1 Occupational Therapy Assistant: 1
Staff by category
Certified Nursing Assistant 25 1 26 8,611 91 100% 7.6
Registered Nurse 14 0 14 3,920 91 100% 7.8
Respiratory Therapy Technician 0 4 4 751 75 82% 4.8
Clinical Nurse Specialist 4 0 4 605 57 63% 7.6
Licensed Practical Nurse 1 0 1 527 51 56% 10.3
Administrator 1 0 1 465 62 68% 7.5
Mental Health Service Worker 1 0 1 460 59 65% 7.8
Dietitian 1 0 1 443 59 65% 7.5
Other Dietary Services Staff 1 0 1 382 49 54% 7.8
Physical Therapy Assistant 0 3 3 367 64 70% 5.4
RN Director of Nursing 2 0 2 311 42 46% 7.3
Speech Language Pathologist 0 2 2 295 67 74% 2.6
Qualified Social Worker 0 1 1 179 43 47% 4.2
Nurse Practitioner 1 0 1 128 17 19% 7.5
Occupational Therapy Aide 0 1 1 117 13 14% 9
Physical Therapy Aide 0 1 1 86 24 26% 3.6
Medical Director 0 1 1 45 15 16% 3
Occupational Therapy Assistant 0 1 1 36 7 8% 5.1
26 Certified Nursing Assistant
% of Days 100%
14 Registered Nurse
% of Days 100%
4 Respiratory Therapy Technician
% of Days 82%
4 Clinical Nurse Specialist
% of Days 63%
1 Licensed Practical Nurse
% of Days 56%
1 Administrator
% of Days 68%
1 Mental Health Service Worker
% of Days 65%
1 Dietitian
% of Days 65%
1 Other Dietary Services Staff
% of Days 54%
3 Physical Therapy Assistant
% of Days 70%
2 RN Director of Nursing
% of Days 46%
2 Speech Language Pathologist
% of Days 74%
1 Qualified Social Worker
% of Days 47%
1 Nurse Practitioner
% of Days 19%
1 Occupational Therapy Aide
% of Days 14%
1 Physical Therapy Aide
% of Days 26%
1 Medical Director
% of Days 16%
1 Occupational Therapy Assistant
% of Days 8%

Facility Characteristics

Source: CMS Long-Term Care Facility Characteristics (Data as of Jan 2026)

Total residents 36
Medicare
14
38.9% of residents
Private pay or other
22
61.1% of residents

Quality of care over time

These measures show how residents usually do over time at this home, based on health outcomes and preventive care.

High-risk clinical events score Info A composite score based on pressure ulcers, falls with injury, weight loss, walking ability decline, and activities of daily living decline. 9.5
43% worse than California average

California average: 6.6

Functional decline score Info A composite score based on activities of daily living decline, walking ability decline, and incontinence. 14.4
27% worse than California average

California average: 11.3

Long-stay resident measures
Above average California avg: 4.2 Info CMS star rating based on long-stay quality measure performance. 5 stars = significantly above average, 1 star = significantly below average.
Need for Help with Daily Activities Increased Info Percent of long-stay residents whose need for help with daily activities has increased 13.8%
25% worse than California average

California average: 11.1%

Walking Ability Worsened Info Percent of long-stay residents whose ability to move independently worsened 14.9%
24% worse than California average

California average: 12.0%

Low Risk Residents with Bowel/Bladder Incontinence Info Percent of low risk long-stay residents who lose control of their bowels or bladder 14.5%
28% worse than California average

California average: 11.3%

Falls with Major Injury Info Percent of long-stay residents experiencing one or more falls with major injury 4.8%
189% worse than California average

California average: 1.7%

High Risk Residents with Pressure Ulcers Info Percent of long-stay high risk residents with pressure ulcers 8.1%
63% worse than California average

California average: 5.0%

Urinary Tract Infection Info Percent of long-stay residents with a urinary tract infection 4.8%
288% worse than California average

California average: 1.2%

Lost Too Much Weight Info Percent of long-stay residents who lose too much weight 5.8%
36% worse than California average

California average: 4.2%

Depressive Symptoms Info Percent of long-stay residents who have depressive symptoms 0.0%
100% better than California average

California average: 6.7%

Antipsychotic Use Info Percent of long-stay residents who received an antipsychotic medication 19.2%
91% worse than California average

California average: 10.1%

Pneumococcal Vaccine Info Percent of long-stay residents assessed and appropriately given the pneumococcal vaccine 100.0%
In line with California average

California average: 98.5%

Influenza Vaccine Info Percent of long-stay residents assessed and appropriately given the seasonal influenza vaccine 100.0%
In line with California average

California average: 98.2%

Short-stay resident measures
Significantly above average California avg: 3.5 Info CMS star rating based on short-stay quality measure performance. 5 stars = much above average, 1 star = much below average.
Pneumococcal Vaccine Info Percent of short-stay residents assessed and appropriately given the pneumococcal vaccine 94.6%
In line with California average

California average: 94.0%

Antipsychotic medication increase Info Percent of short-stay residents who newly received an antipsychotic medication 0.6%
62% better than California average

California average: 1.5%

Influenza Vaccine Info Percent of short-stay residents assessed and appropriately given the seasonal influenza vaccine 53.0%
43% worse than California average

California average: 93.2%

Re-hospitalized after SNF stay Info Percentage of short-stay residents who were re-hospitalized after their nursing home admission. 14.0%
40% better than California average

California average: 23.2%

Emergency department visits Info Percentage of short-stay residents who had an outpatient emergency department visit. 17.4%
55% worse than California average

California average: 11.2%

Falls with major injury Info Percentage of SNF residents who experience falls with major injury during their stay. 1.1%
48% worse than California average

California average: 0.8%

Ability to care for self at discharge Info Percentage of residents at or above expected ability to care for themselves at discharge. 72.2%
35% better than California average

California average: 53.7%

Successful return to home or community Info Rate of successful return to home or community from a skilled nursing facility. 70.4%
39% better than California average

California average: 50.6%

Penalties and fines

Federal penalties imposed by CMS for regulatory violations, including civil money penalties (fines) and denials of payment for new Medicare/Medicaid admissions.

Source: CMS Penalties Database (Data as of Jan 2026)

Total fines amount $0
100% lower than California average

California average: $55K

Number of fines 0
100% fewer fines than California average

California average: 2.4

Payment Denials Info Serious action where Medicare and/or Medicaid temporarily stops payments for new residents until issues are fixed. 1
102% more payment denials than California average

California average: 0.5

Fines amount comparison
This facility $0
California average $55K
Penalty History

Penalties are imposed by CMS for violations of federal nursing home regulations.

1 penalty in the past 3 years

Oct 25, 2024 · 14 days

Payment Denial Info Serious action where Medicare and/or Medicaid temporarily stops payments for new residents until issues are fixed. Oct 25, 2024
14 days

Last updated: Jan 2026

Compare Independent Living around Davis The information below is reported by the California Department of Social Services and Department of Public Health.

Filter by care type
University Retirement Community
AL

Assisted Living A licensed, long-term care setting for seniors or individuals with disabilities who need help with daily activities — like bathing, dressing, and medication management — but not 24-hour skilled nursing. Offers housing, meals, and around-the-clock support while aiming to maximize resident independence.

IL

Independent Living Lifestyle-focused communities for older adults offering dining, activities, and transportation with minimal personal care. Best for active, independent seniors who want community without medical support.

MC

Memory Care Secured, specialized care for people living with Alzheimer's or dementia. Staff trained in cognitive impairment, with higher staff-to-resident ratios and an environment designed to reduce confusion and wandering risk.

NH

Nursing Home Licensed facility providing 24/7 skilled nursing care for residents with complex, ongoing medical needs. Staffed by RNs, LPNs, and CNAs. Inspected and star-rated annually by CMS. Accepts Medicare (short-term rehab) and Medicaid (long-term care).

Davis (West Davis) 500 No 54 5 4 1 26 10.0% Univer Retire Com At Davis/Pacific Retire Services 1 Bed / 2 Bed / 3 Bed
Atria Covell Gardens
AL

Assisted Living A licensed, long-term care setting for seniors or individuals with disabilities who need help with daily activities — like bathing, dressing, and medication management — but not 24-hour skilled nursing. Offers housing, meals, and around-the-clock support while aiming to maximize resident independence.

IL

Independent Living Lifestyle-focused communities for older adults offering dining, activities, and transportation with minimal personal care. Best for active, independent seniors who want community without medical support.

MC

Memory Care Secured, specialized care for people living with Alzheimer's or dementia. Staff trained in cognitive impairment, with higher staff-to-resident ratios and an environment designed to reduce confusion and wandering risk.

Davis (Senda Nueva) 210 Yes 38 5 17 6 28 69.0% Wg Covell Sh Lp; Atria Management Co Llc 1 Bed / 2 Bed / 3 Bed

Guides for Better Senior Living

Care Cost Calculator: See Prices in Your Area

Nursing Home Data Explorer

Don’t Wait Too Long: 7 Red Flag Signs Your Parent Needs Assisted Living Now

The True Cost of Assisted Living in 2025 – And How Families Are Paying For It

Understanding Senior Living Costs: Pricing Models, Discounts & Financial Assistance

Explore Open Rooms
1 Contact details
2 What type of senior care service are you looking for?
3 What budget do you have in mind for senior care?
4 How soon do you need to find care?
5 Additional details

Thank you for your interest!

Our team will be in touch shortly to help with next steps.