Courtyard Healthcare Center
Nursing Home · Davis, CA
CMS overall rating Info The Overall CMS Rating is scored from 1 to 5 stars and combines results from health inspections, staffing levels, and quality measures. Health inspections carry the most weight. Staffing and quality scores can increase or decrease the final rating based on performance compared to state and national standards.

Courtyard Healthcare Center

Nursing Home · Davis, CA
CMS overall rating Info The Overall CMS Rating is scored from 1 to 5 stars and combines results from health inspections, staffing levels, and quality measures. Health inspections carry the most weight. Staffing and quality scores can increase or decrease the final rating based on performance compared to state and national standards.
Calculator: See prices in your area
Courtyard Healthcare Center accepts Medicare, Medicaid, and private pay.

Overview of Courtyard Healthcare Center

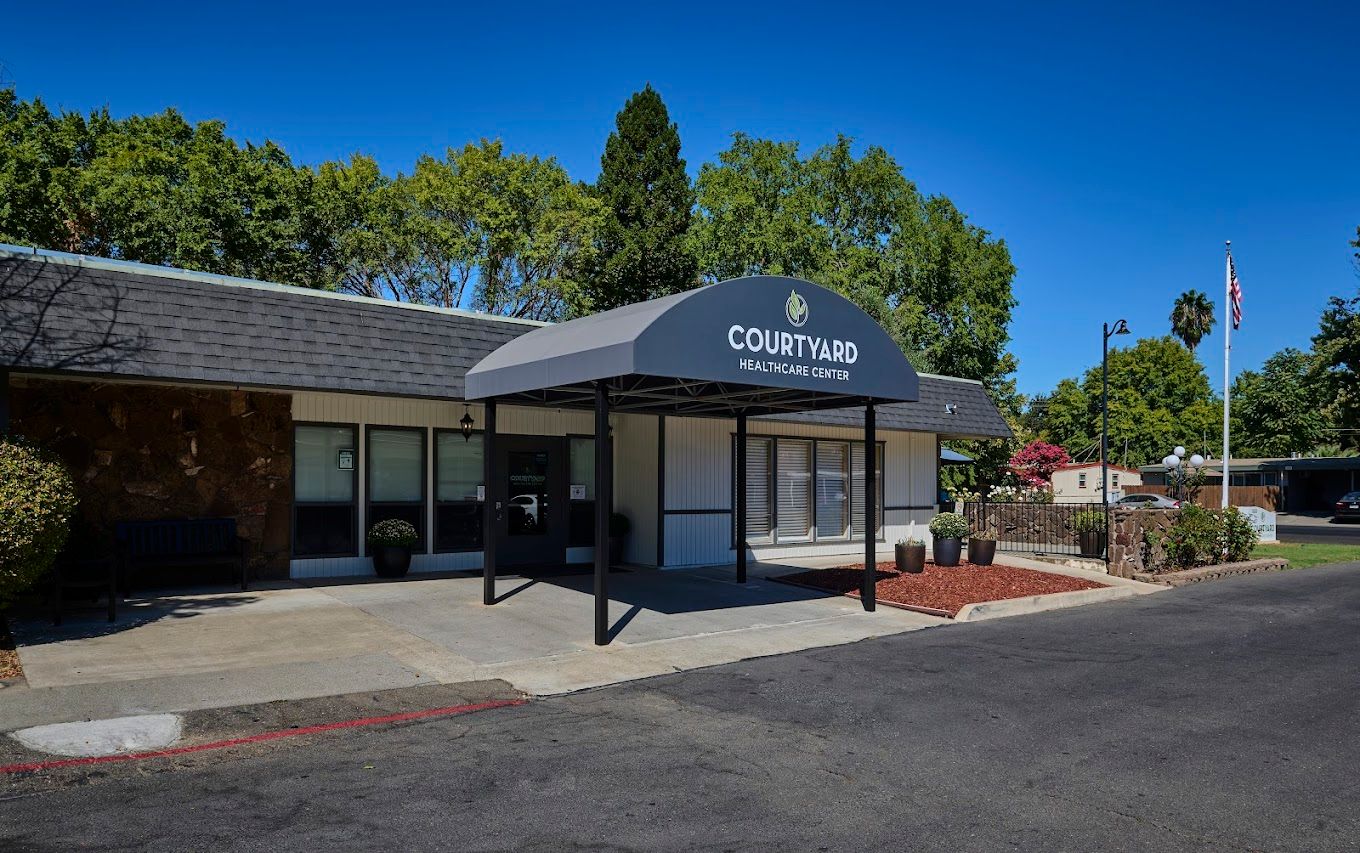
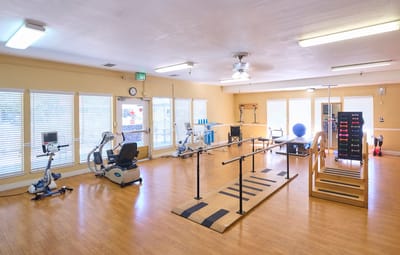
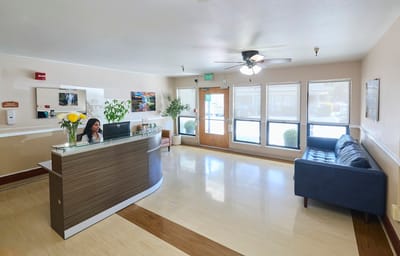
Surrounded by lush trees and green spaces, Courtyard Healthcare Center is a respected senior care provider in Davis, CA that offers a relaxing recovery experience with its refreshing surroundings and excellent services. The community offers 24-hour skilled nursing services and personalized rehabilitation plans, ensuring residents have the tools and support they need to regain or maintain the skills they need to continue living the lifestyle they want. Residents enjoy their peace of mind knowing that a reliable team of care professionals and therapists are available to provide them with the services they need to recover quickly.

Elevating residents’ living experience within the community, Courtyard Healthcare Center also offers a vibrant range of engaging daily activities to keep residents engaged, entertained, and happy. Residents can also enjoy an array of fresh and balanced meals at the community’s open dining room that encourages the sharing of meaningful conversations. Here, residents are guaranteed to fully enjoy their golden years amidst a serene living environment that fosters both comfort and enrichment.

(530) 756-1800

Quality ratings

Measured by Centers for Medicare & Medicaid Services (CMS)

Overall rating Info The Overall CMS Rating combines results from health inspections, staffing levels and quality measures. Health inspections carry the most weight. Staffing and quality scores can increase or decrease the final rating based on performance compared to state and national standards.
▼ 44.4% Below CA avg. ▼ 44.4% Below CA avg.Click the badge to see the full State ranking.Click here to see the full State ranking.
Health Inspection Info Based on the results of the facility's three most recent standard inspections and any complaint investigations. CMS reviews the number, scope, and severity of deficiencies, with more recent findings weighted more heavily.
▼ 68.3% Below CA avg. ▼ 68.3% Below CA avg.Click the badge to see the full State ranking.Click here to see the full State ranking.
Staffing Info Measures average nursing staff hours per resident per day, including Registered Nurses (RNs) and total nursing staff. Ratings are adjusted based on the level of care residents require and are compared to state and national benchmarks.
▲ 15.9% Above CA avg. ▲ 15.9% Above CA avg.Click the badge to see the full State ranking.Click here to see the full State ranking.
Quality Measures Info Based on clinical and physical health indicators reported to CMS, such as hospital readmissions, falls, pressure ulcers, and improvements in mobility. These measures reflect how well residents' health needs are being managed.
▲ 17.4% Above CA avg. ▲ 17.4% Above CA avg.Click the badge to see the full State ranking.Click here to see the full State ranking.

Staffing hours breakdown

Info Daily nursing hours per resident by staff type, reported to CMS. Higher is generally better — compare this facility to state and national averages to see where staffing stands.

Hours per resident per day — compared to California state averages

Total nursing care / resident Info This home is ranked 105th out of 346 homes in California. Total adjusted nursing hours per resident per day, combining RN, LPN, and aide time. CMS adjusts this for case-mix so facilities can be fairly compared.
4h 25m per day
Rank #105 / 346Nurse hours — State benchmarkedThis home is ranked 105th out of 346 homes in California. Shows adjusted nurse hours per resident per day benchmarked to the California average, with a ranking across 346 California SNFs. More hours mean more direct care. The national average is about 3.5 hrs; below 3.0 is a red flag.Click the rank badge to see the full State ranking.Click here to see the full State ranking.
This facility California avg (4h 23m per day)
vs California avg
+1%

4 of 6 metrics below state avg

Standout metric Weekend RN is +7% above state avg
Staff typeHours / Day / Residentvs state avg
Registered Nurse (RN) Info RNs hold the highest nursing license and can assess residents, interpret test results, and direct care plans. More RN hours per day often signals stronger clinical oversight and faster response to health changes. 39m per day ■ Avg State avg: 39m per day · National avg: 41m per day
LPN / LVN Info Licensed Practical Nurses (LPNs) or Licensed Vocational Nurses (LVNs) deliver routine hands-on care — medication administration, wound dressing, and monitoring vital signs. They work under RN supervision and make up a large share of daily bedside care. 26m per day ▼ 64% State avg: 1h 13m per day · National avg: 52m per day
Nurse Aide Info Certified Nurse Aides (CNAs) provide the most direct day-to-day assistance: bathing, dressing, feeding, and mobility. Nurse aide hours are typically the largest staffing category and directly affect residents' quality of life. 1h 52m per day ▼ 30% State avg: 2h 39m per day · National avg: 2h 21m per day
Weekend Total Nursing Info Combined nursing hours (RN + LPN + Nurse Aide) per resident per day on weekends. Staffing often drops on weekends — this figure reveals whether the facility maintains adequate coverage outside of weekday hours. 3h 49m per day ▼ 6% State avg: 4h 5m per day · National avg: 3h 26m per day
Physical Therapist Info Hours per resident per day provided by licensed Physical Therapists (PTs) or PT Assistants. PT services help residents recover mobility after injury or illness and are especially important for post-acute (short-stay) rehabilitation. 4m per day ▼ 20% State avg: 5m per day · National avg: 4m per day
Weekend RN Info Registered nurse hours specifically on weekends. Facilities sometimes reduce RN presence on Saturdays and Sundays — a low weekend RN figure compared to weekday hours can indicate reduced clinical oversight when most administrative staff are absent. 32m per day ▲ 7% State avg: 30m per day · National avg: 29m per day

Types of Care at Courtyard Healthcare Center

Nursing Home

Capacity and availability

This home is often near full

Occupancy higher than 95% suggests steady demand, but availability may be limited.

Higher occupancy than the California average: 84.7%
Occupancy rate 97.3% Rank #158 / 1407Occupancy rate — State benchmarkedThis home is ranked 158th out of 1407 homes in California. Shows this facility's occupancy rate versus the California average, with its Statewide rank out of 1407. Higher occupancy signals strong local demand and financial stability.Click the rank badge to see the full State ranking.Click here to see the full State ranking.
Avg. Length of Stay 53 days
Occupancy rate
97.3% Rank #158 / 1407Occupancy rate — State benchmarkedThis home is ranked 158th out of 1407 homes in California. Shows this facility's occupancy rate versus the California average, with its Statewide rank out of 1407. Higher occupancy signals strong local demand and financial stability.Click the rank badge to see the full State ranking.Click here to see the full State ranking.
Avg. Length of Stay
53 days
Walk Score
Walk Score: 70 / 100 Rank #741 / 2096Walk Score — State benchmarkedThis home is ranked 741st out of 2096 homes in California. Shows how walkable this facility's neighborhood is compared to the average Walk Score across California SNFs. Higher scores benefit residents, families, and staff.Click the rank badge to see the full State ranking.Click here to see the full State ranking.
Very walkable. Most errands can be accomplished on foot, and many essentials are within a short walk.

License Details

CMS Certification Number55922

Contact Courtyard Healthcare Center

Inspection History

In California, the Department of Social Services (for assisted living facilities) and the Department of Public Health (for nursing homes) conduct inspections to ensure resident safety and regulatory compliance.

Since 2022 · 4 years of data 68 citations 0 complaint visits

Inspection Scorecard Info This scorecard compares key inspection, citation, and complaint metrics at this facility against the California state average. Metrics rated ≥15% worse than average are highlighted in red; those ≥15% better are highlighted in green.

Since 2022 vs. California state average
Overall vs. CA average 2 Worse Metrics worse than California average:
• Total citations (580% above)
• Citations per year (580% above)
3 Better Metrics better than California average:
• Total visits (100% below)
• Complaint visits (100% below)
• Other visits (100% below)
Latest Inspection November 24, 2025 Other

Citations Info Citations are formal regulatory issues recorded during state inspections.

This FacilityCA Averagevs. CA Avg
Total citations Info Formal regulatory issues recorded by inspectors across all inspection types. 6810 This facility has 580% more total citations than a typical California nursing home (68 vs. CA avg 10).↑ 580% worse
Citations per year Info Average citations per year since 2022. 172.5 This facility has 580% more citations per year than a typical California nursing home (17 vs. CA avg 2.5).↑ 580% worse

Inspections & Visits Info State inspections evaluate whether the facility meets health and safety standards.

This FacilityCA Averagevs. CA Avg
Total visits Info Combined count of complaint visits, other regulatory visits, and official scheduled inspections. 016 This facility has 100% fewer total visits than a typical California nursing home (0 vs. CA avg 16).↓ 100% better
Complaint visits Info On-site visits triggered by formal complaints filed by residents, families, or staff. 013 This facility has 100% fewer complaint visits than a typical California nursing home (0 vs. CA avg 13).↓ 100% better
Other visits Info Regulatory visits that are neither routine inspections nor complaint investigations — administrative check-ins, follow-up reviews, licensing-related visits. 07 This facility has 100% fewer other visits than a typical California nursing home (0 vs. CA avg 7).↓ 100% better

Inspection Reports Summary Info An editor-reviewed summary of the themes and findings across this facility's recent inspection reports.

This facility’s inspection record is mixed, showing repeated deficiencies in food safety, resident discharge planning, and protection from resident-to-resident abuse. The most recent inspection on November 24, 2025, cited two deficiencies related to failure to follow a therapeutic diet and unsanitary dish storage. Multiple complaint investigations from 2023 to 2025 substantiated abuse incidents and unsafe discharges, while routine and annual inspections flagged ongoing issues with medication administration, kitchen sanitation, and care planning.

Read the full inspection reports for this facility, including detailed findings and corrective actions.

Show Inspection Reports

Health Inspection History

Inspections since 2023
Total health inspections 21

California average 12.5


Last Health inspection on Sep 2025

Total health citations
64 Rank #277 / 354Health citations — State benchmarkedThis home is ranked 277th out of 354 homes in California. Shows this facility's total health deficiency citations benchmarked to the California State average, with a ranking across all 354 CA SNFs. Lower citation counts earn a better rank.Click the rank badge to see the full State ranking.Click here to see the full State ranking.

California average 50.2

Citations per inspection
3.05 Rank #72 / 354Citations per inspection — State benchmarkedThis home is ranked 72nd out of 354 homes in California. Shows average deficiency citations per CMS inspection for this facility versus the California mean across 354 SNFs with citation data. Lower is better.Click the rank badge to see the full State ranking.Click here to see the full State ranking.

California average 4.65


Health citations are formal notices following inspections when they fail to comply with safety and care standards.

34 of 64 citations resulted from standard inspections; 27 of 64 resulted from complaint investigations; and 3 of 64 came from combined inspections (standard and complaint).

Breakdown of citation severity (last 3 years)
Critical Health citations
0
100% better than California average

California average: 0.4


Serious Health citations
1 Rank #1 / 156Serious citations (G–I) — State benchmarkedThis home is ranked 1st out of 156 homes in California. Shows G–I scope serious health citations for this facility versus other California SNFs. Lower counts rank better.Click the rank badge to see the full State ranking.Click here to see the full State ranking.
In line with California average

California average: 1

0 critical citations California average: 0.4

1 serious citation California average: 1

63 moderate citations California average: 47.2

0 minor citations California average: 1.5
Citations history (last 3 years)
Nutrition moderate citation Sep 08, 2025
Corrected

Quality of Care moderate citation Aug 26, 2025
Corrected

Resident Rights moderate citation Jul 31, 2025
Corrected

Quality of Care moderate citation Jul 10, 2025
Corrected

Staffing Data

Reporting period: October 1 – December 31, 2025 (Q4 2025). Source: CMS Payroll-Based Journal report.

Total staff 178
Employees 178
Contractors 0
Staff to resident ratio 1.66:1
8% worse than California average
California average ratio: 1.81:1 California average ratio: 1.81:1See full California ranking
Avg staff/day 70
Average shift 8 hours
0% compared with California average
California average: 7.7 hours California average shift: 7.7 hoursSee full California ranking
Total staff hours (quarter) 51,732

Nursing staff breakdown

Q4 2025 · Oct 1 – Dec 31 More info This data comes from the CMS Payroll-Based Journal report covering October 1 – December 31, 2025.
Registered Nurse

Manages medical care and health needs.

RN Staff 26
Average shift length Info Average shift length. Calculated as total hours divided by days worked and average staff per day. 9.7 hours

No contractors work on this role.

Licensed Practical Nurse

Assists with medical care and medications.

LPN Staff 20
Average shift length Info Average shift length. Calculated as total hours divided by days worked and average staff per day. 9.9 hours

No contractors work on this role.

Certified Nursing Assistant

Helps with daily care and mobility.

CNA Staff 96
Average shift length Info Average shift length. Calculated as total hours divided by days worked and average staff per day. 7.5 hours

No contractors work on this role.

Contractor staffing

Q4 2025 · Oct 1 – Dec 31 More info This data comes from the CMS Payroll-Based Journal report covering October 1 – December 31, 2025.

Total hours from contractors

0%

0 contractor hours this quarter

No contractor roles were reported this quarter.

Staff by category

Q4 2025 · Oct 1 – Dec 31 More info This data comes from the CMS Payroll-Based Journal report covering October 1 – December 31, 2025.
Certified Nursing Assistant9609626,96992100%7.5
Registered Nurse260267,32892100%9.7
Licensed Practical Nurse200206,70092100%9.9
Dental Services Staff5052,5386975%8
Other Dietary Services Staff9091,9369199%7.3
Clinical Nurse Specialist3031,2246672%8
Respiratory Therapy Technician3031,0407480%6.4
Administrator1015286672%8
Nurse Practitioner1015286672%8
Occupational Therapy Aide1015286672%8
Dietitian1015206571%8
Speech Language Pathologist2024785964%7.9
RN Director of Nursing1014025863%6.9
Therapeutic Recreation Specialist1013475762%6.1
Physical Therapy Aide3032774751%5.9
Physical Therapy Assistant3032244650%4.2
Qualified Social Worker2021652123%6.4
96 Certified Nursing Assistant
% of Days 100%
26 Registered Nurse
% of Days 100%
20 Licensed Practical Nurse
% of Days 100%
5 Dental Services Staff
% of Days 75%
9 Other Dietary Services Staff
% of Days 99%
3 Clinical Nurse Specialist
% of Days 72%
3 Respiratory Therapy Technician
% of Days 80%
1 Administrator
% of Days 72%
1 Nurse Practitioner
% of Days 72%
1 Occupational Therapy Aide
% of Days 72%
1 Dietitian
% of Days 71%
2 Speech Language Pathologist
% of Days 64%
1 RN Director of Nursing
% of Days 63%
1 Therapeutic Recreation Specialist
% of Days 62%
3 Physical Therapy Aide
% of Days 51%
3 Physical Therapy Assistant
% of Days 50%
2 Qualified Social Worker
% of Days 23%

Penalties and fines

Federal penalties imposed by CMS for regulatory violations, including civil money penalties (fines) and denials of payment for new Medicare/Medicaid admissions.

Source: CMS Penalties Database (Data as of Jan 2026)

Total fines amount $7K Rank #238 / 354Federal fines — State benchmarkedThis home is ranked 238th out of 354 homes in California. Shows this facility's cumulative CMS federal fine dollars versus the California average among facilities with fines, and where it ranks among 354 skilled nursing facilities in the pool. Lower total dollars mean a better rank.Click the rank badge to see the full State ranking.Click here to see the full State ranking.
87% lower than California average

California average: $55K

Number of fines 1
58% fewer fines than California average

California average: 2.4

Payment Denials Info Serious action where Medicare and/or Medicaid temporarily stops payments for new residents until issues are fixed. 0
100% fewer payment denials than California average

California average: 0.5

Fines amount comparison
This facility $7K
California average $55K

No penalties in the past 3 years

No civil money penalties or payment denials were reported in the last 3 years.

Quality of care over time

These measures show how residents usually do over time at this home, based on health outcomes and preventive care.

High-risk clinical events score Info A composite score based on pressure ulcers, falls with injury, weight loss, walking ability decline, and activities of daily living decline. 4.7
30% better than California average

California average: 6.6

Functional decline score Info A composite score based on activities of daily living decline, walking ability decline, and incontinence. 8.7
24% better than California average

California average: 11.3

Long-stay resident measures
Significantly above average California avg: 4.2 Info CMS star rating based on long-stay quality measure performance. 5 stars = significantly above average, 1 star = significantly below average.
Need for Help with Daily Activities Increased Info Percent of long-stay residents whose need for help with daily activities has increased 6.4%
42% better than California average

California average: 11.1%

Walking Ability Worsened Info Percent of long-stay residents whose ability to move independently worsened 9.5%
21% better than California average

California average: 12.0%

Low Risk Residents with Bowel/Bladder Incontinence Info Percent of low risk long-stay residents who lose control of their bowels or bladder 10.0%
11% better than California average

California average: 11.3%

Falls with Major Injury Info Percent of long-stay residents experiencing one or more falls with major injury 1.5%
12% better than California average

California average: 1.7%

High Risk Residents with Pressure Ulcers Info Percent of long-stay high risk residents with pressure ulcers 0.7%
85% better than California average

California average: 5.0%

Urinary Tract Infection Info Percent of long-stay residents with a urinary tract infection 0.3%
76% better than California average

California average: 1.2%

Lost Too Much Weight Info Percent of long-stay residents who lose too much weight 5.2%
24% worse than California average

California average: 4.2%

Depressive Symptoms Info Percent of long-stay residents who have depressive symptoms 7.6%
14% worse than California average

California average: 6.7%

Antipsychotic Use Info Percent of long-stay residents who received an antipsychotic medication 9.4%
7% better than California average

California average: 10.1%

Pneumococcal Vaccine Info Percent of long-stay residents assessed and appropriately given the pneumococcal vaccine 99.4%
In line with California average

California average: 98.5%

Influenza Vaccine Info Percent of long-stay residents assessed and appropriately given the seasonal influenza vaccine 97.7%
In line with California average

California average: 98.2%

Hospitalizations per 1,000 days Info Number of hospitalizations per 1,000 long-stay resident days. 1.61
28% better than California average

California average: 2.25

ED visits per 1,000 days Info Number of outpatient emergency department visits per 1,000 long-stay resident days. 1.90
19% worse than California average

California average: 1.59

Short-stay resident measures
Below average California avg: 3.5 Info CMS star rating based on short-stay quality measure performance. 5 stars = much above average, 1 star = much below average.
Pneumococcal Vaccine Info Percent of short-stay residents assessed and appropriately given the pneumococcal vaccine 92.7%
In line with California average

California average: 94.0%

Antipsychotic medication increase Info Percent of short-stay residents who newly received an antipsychotic medication 1.3%
14% better than California average

California average: 1.5%

Influenza Vaccine Info Percent of short-stay residents assessed and appropriately given the seasonal influenza vaccine 87.4%
6% worse than California average

California average: 93.2%

Re-hospitalized after SNF stay Info Percentage of short-stay residents who were re-hospitalized after their nursing home admission. 24.0%
In line with California average

California average: 23.2%

Emergency department visits Info Percentage of short-stay residents who had an outpatient emergency department visit. 18.5%
65% worse than California average

California average: 11.2%

Falls with major injury Info Percentage of SNF residents who experience falls with major injury during their stay. 1.3%
64% worse than California average

California average: 0.8%

Ability to care for self at discharge Info Percentage of residents at or above expected ability to care for themselves at discharge. 38.2%
29% worse than California average

California average: 53.7%

Successful return to home or community Info Rate of successful return to home or community from a skilled nursing facility. 59.4%
17% better than California average

California average: 50.6%

Breakdown by payment type

Medicare

41% of new residents, usually for short-term rehab.

Typical stay 23 days

Private pay

49% of new residents, often for short stays.

Typical stay 2 - 3 months

Medicaid

10% of new residents, often for long-term daily care.

Typical stay 2 months

Facility Characteristics

Source: CMS Long-Term Care Facility Characteristics (Data as of Jan 2026)

Total residents 107
Medicare
18
16.8% of residents
Medicaid
86
80.4% of residents
Private pay or other
3
2.8% of residents
Programs & Services
Residents Group

Residents meet regularly to discuss policies, care quality, and activities

Active Resident Council

Organized group of residents that meets regularly to discuss facility policies, quality of life, and activities.

Finances and operations

Privately-owned community
Operated by a business corporation.
Home revenue
$17.2M
Profit
$1.1M
Privately-owned community Operated by a business corporation.
Home revenue
$17.2M Rank #163 / 347Revenue — State benchmarkedThis home is ranked 163rd out of 347 homes in California. Shows this facility's annual revenue compared to the California SNF average. Higher revenue generally means more resources for staffing and capital — read alongside Payroll %.Click the rank badge to see the full State ranking.Click here to see the full State ranking.
Profit
$1.1M
Payroll costs Info The portion of the home's budget spent on staff, including nurses, caregivers, and other employees who support care and operations. Rank #95 / 347Payroll — State benchmarkedThis home is ranked 95th out of 347 homes in California. Shows total annual staff payroll benchmarked to the California average. Higher payroll investment relative to peers often signals better staffing and less reliance on cheaper contract labor.Click the rank badge to see the full State ranking.Click here to see the full State ranking.
$11.0M
64.2% of revenue Rank #44 / 347Payroll % — State benchmarkedThis home is ranked 44th out of 347 homes in California. Shows payroll as a percentage of revenue versus the California average. Well-run California SNFs typically land around 56–67% — the top third Statewide. Below 25% may signal understaffing or heavy agency use — read with Staffing ratings.Click the rank badge to see the full State ranking.Click here to see the full State ranking.
Other operating costs Info All remaining costs needed to run the home, such as food, utilities, building maintenance, supplies and administrative expenses.
$5.0M
Total costs $16.1M

What does this home offer?

Total residents icon

Total Residents: 112

Building type icon
Building type icon

Building Type: Single-story

Who this home usually serves

TYPE OF STAY

Mix of rehab and long-term care

This home supports both short-term rehab and long-term care, with residents staying for a wide range of durations.

Courtyard Healthcare Center Reviews

Share your thoughts and experiences about Courtyard Healthcare Center. Let’s celebrate the stories that make a difference!
Tautianna Peck
I have worked here for 3 years this November 1st. It is by far the best place I have ever worked. The residents are amazing, we have a wonderful therapy team, great nursing, fantastic activities, and spectacular food. My father-in-law was even a resident here for the last year of his life and they made him return back to the old him. He was so much happier and healthier than he had been in years. He made so many friends with other residents and staff. They even put on a memorial for him, which meant the world to us. I am excited to see what the next years bring!What do you like most about living here? Answer: Great food, great work environment, great activities, great maintenance, great therapy, great housekeeping, great laundry, great social services. Are there enough caregivers to handle the residents' needs, especially during emergencies? Answer: Yes 
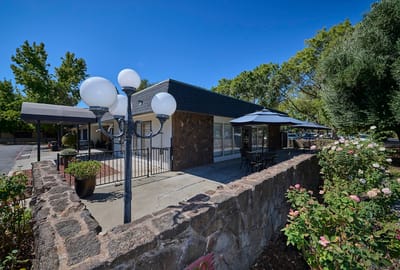
Are the common areas pleasant and comfortable for socializing or relaxing? Answer: Yes How would you rate the quality and variety of the meals? (1-5) Answer: 5 Are special diets handled well? Answer: Yes Is the dining schedule flexible enough to meet your preferences? Answer: Yes How do you feel about the level of social interaction available with other residents? Answer: Great variety and outings. How was the units offered in this community? Answer: Verbally Do you feel safe living in this community? Answer: Yes How well do you think the community handles emergencies or unexpected events? Answer: Beautifully Are there any hidden fees or unexpected charges? Answer: No Would you recommend this community to others looking for senior living options? Answer: Absolutely Is there anything you wish you knew before moving in? Answer:

Places of interest near Courtyard Healthcare Center

Address 1.2 miles from city center Info Estimated distance in miles from Davis's city center to Courtyard Healthcare Center's address, calculated via Google Maps.

Calculate Travel Distance to Courtyard Healthcare Center

Add your location

Address

Financial Assistance for
Nursing Home in California

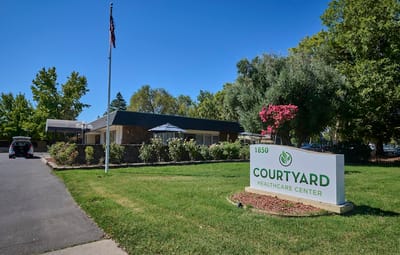
Courtyard Healthcare Center is located in Davis, California.
Here are the financial assistance programs available to residents in California.

Get Financial aid guidance

Multipurpose Senior Services Program

MSSP (Medi-Cal Waiver)

Age 65+
General California resident, Medi-Cal eligible, nursing home risk.
Income Limits (2025) ~$2,829/month 300% FBR, individual
Asset Limits $2,000 (individual), $3,000 (couple).
CA

County-managed; waitlists possible.

Benefits
In-home support (4-6 hours/day) Respite care (14 days/year) Meals (~$6/meal) Transportation (8 trips/month) Care management

In-Home Supportive Services (IHSS)

California IHSS

Age 65+
General California resident, Medicaid-eligible or low-income.
Income Limits ~$1,732/month individual, Medi-Cal threshold
Asset Limits $2,000 individual
CA

Can hire family as caregivers.

Benefits
Personal care (up to 283 hours/month) Homemaker services Respite (varies)

Multipurpose Senior Services Program (MSSP)

CA MSSP

Age 65+
General California resident, Medi-Cal-eligible, nursing home-eligible but community-capable.
Income Limits ~$2,829/month 300% FBR, individual
Asset Limits $2,000 individual
CA

Available in 38 counties; waitlists common.

Benefits
Case management Respite care (up to 10 days/year) Minor home mods (avg. $500) Adult day care (~$50/day)

Property Tax Postponement Program (PTP)

CA PTP

Age 62+
General California resident, own and live in home, 40% equity.
Income Limits (2025) ~$51,500/year household, adjusted annually
Asset Limits Equity-based; no strict asset cap.
CA

Deferred taxes accrue interest (5% as of 2024); repaid upon sale/death.

Benefits
Property tax deferral (avg. $1,000-$3,000/year, varies by county)

Assisted Living Waiver (ALW)

CA ALW

Age 65+ or disabled
General California resident, Medi-Cal-eligible, nursing home-eligible.
Income Limits ~$2,829/month 300% FBR, individual
Asset Limits $2,000 individual
CA

Available in 15 counties (e.g., LA, Sacramento); waitlists common.

Benefits
Personal care in ALFs (5-7 hours/day) Medication management Social services

California CARES Program

CA CARES

Age
General Caregivers of California residents 60+ needing help with 3+ daily activities; no caregiver age limit.
Income Limits No strict limit; cost-sharing above ~$2,500/month threshold.
Asset Limits Not applicable; need-based.
CA

High demand in urban areas; complements IHSS respite.

Benefits
Respite care (up to 10 days/year) Counseling (4-6 sessions/year) Training (2-3 workshops/year) Supplies (~$200/year)

Compare Nursing Home around Davis

The information below is reported by the California Department of Social Services and Department of Public Health.

2 facilities compared · CMS & CA Dept. of Health data

Filter by care type
University Retirement Community
NH

Nursing Home Licensed facility providing 24/7 skilled nursing care for residents with complex, ongoing medical needs. Staffed by RNs, LPNs, and CNAs. Inspected and star-rated annually by CMS. Accepts Medicare (short-term rehab) and Medicaid (long-term care).

AL

Assisted Living A licensed, long-term care setting for seniors or individuals with disabilities who need help with daily activities — like bathing, dressing, and medication management — but not 24-hour skilled nursing. Offers housing, meals, and around-the-clock support while aiming to maximize resident independence.

IL

Independent Living Lifestyle-focused communities for older adults offering dining, activities, and transportation with minimal personal care. Best for active, independent seniors who want community without medical support.

MC

Memory Care Secured, specialized care for people living with Alzheimer's or dementia. Staff trained in cognitive impairment, with higher staff-to-resident ratios and an environment designed to reduce confusion and wandering risk.

Davis (West Davis)500 10.0% -88%4.76 +82%+13%$0183.6135 54 Lois Cross$32.9M$12.9M39.2%555769
Courtyard Healthcare Center
NH

Nursing Home Licensed facility providing 24/7 skilled nursing care for residents with complex, ongoing medical needs. Staffed by RNs, LPNs, and CNAs. Inspected and star-rated annually by CMS. Accepts Medicare (short-term rehab) and Medicaid (long-term care).

AL

Assisted Living A licensed, long-term care setting for seniors or individuals with disabilities who need help with daily activities — like bathing, dressing, and medication management — but not 24-hour skilled nursing. Offers housing, meals, and around-the-clock support while aiming to maximize resident independence.

IL

Independent Living Lifestyle-focused communities for older adults offering dining, activities, and transportation with minimal personal care. Best for active, independent seniors who want community without medical support.

MC

Memory Care Secured, specialized care for people living with Alzheimer's or dementia. Staff trained in cognitive impairment, with higher staff-to-resident ratios and an environment designed to reduce confusion and wandering risk.

Davis (Davis Manor)112 94.8% +12%4.42 +64%+5%$10.6k643.11109 70 -$17.2M$11.0M64.2%55922

Frequently Asked Questions about Courtyard Healthcare Center

What neighborhood is Courtyard Healthcare Center in?

Courtyard Healthcare Center is in the Davis Manor neighborhood of Davis.

Is Courtyard Healthcare Center in a walkable area?

Courtyard Healthcare Center has a walk score of 70. Very walkable. Most errands can be accomplished on foot, and many essentials are within a short walk.

What is the address of Courtyard Healthcare Center?

Courtyard Healthcare Center is located at 1850 E 8th St, Davis, CA 95616, United States.

What is the phone number of Courtyard Healthcare Center?

(530) 756-1800 will put you in contact with the team at Courtyard Healthcare Center.

Is Courtyard Healthcare Center Medicare or Medicaid certified?

Yes — Courtyard Healthcare Center is a CMS-certified provider of Medicare and Medicaid.

Guides for Better Senior Living

Care Cost Calculator: See Prices in Your Area

Nursing Home Data Explorer

Don’t Wait Too Long: 7 Red Flag Signs Your Parent Needs Assisted Living Now

The True Cost of Assisted Living in 2025 – And How Families Are Paying For It

Understanding Senior Living Costs: Pricing Models, Discounts & Financial Assistance

Explore Open Rooms
1 Contact details
2 What type of senior care service are you looking for?
3 What budget do you have in mind for senior care?
4 How soon do you need to find care?
5 Additional details

Thank you for your interest!

Our team will be in touch shortly to help with next steps.