Vi at Aventura
Nursing Home, Assisted Living, Independent Living, Memory Care & Skilled Nursing · Florida, FL
CMS overall rating Info The Overall CMS Rating is scored from 1 to 5 stars and combines results from health inspections, staffing levels, and quality measures. Health inspections carry the most weight. Staffing and quality scores can increase or decrease the final rating based on performance compared to state and national standards.

Vi at Aventura

Nursing Home, Assisted Living, Independent Living, Memory Care & Skilled Nursing · Florida, FL
CMS overall rating Info The Overall CMS Rating is scored from 1 to 5 stars and combines results from health inspections, staffing levels, and quality measures. Health inspections carry the most weight. Staffing and quality scores can increase or decrease the final rating based on performance compared to state and national standards.
Calculator: See prices in your area
Vi at Aventura accepts CHAMPUS, Insurance and/or HMO, Medicare, and private pay.

Overview of Vi at Aventura

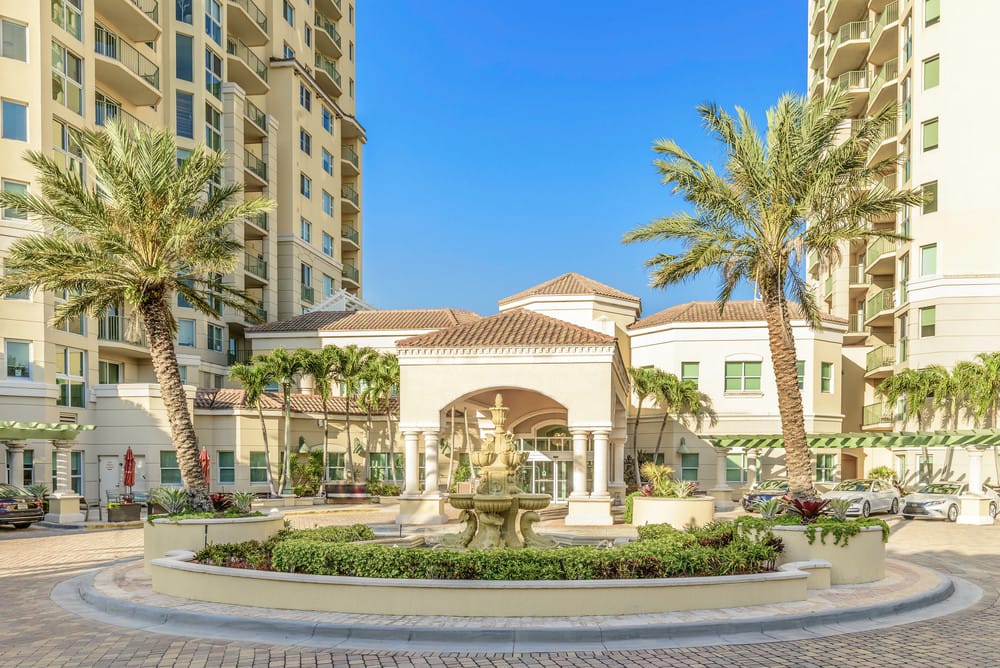
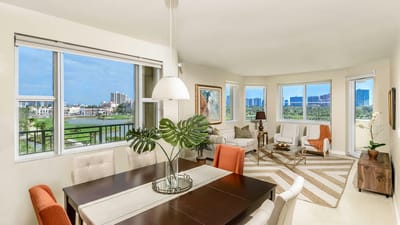
Take in the breathtaking view of West Country Club Drive, Aventura, FL, with the outstanding senior living community of Vi at Aventura that offers assisted living, independent living, memory care, and skilled nursing. Treat yourself to a relaxing retirement with the cozy and elegant residence of Vi at Aventura in various one-bedroom and two-bedroom floor plans. Let go of your worries with a team of compassionate and highly experienced professionals providing top-tier care and assistance.

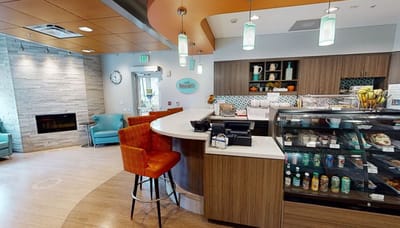
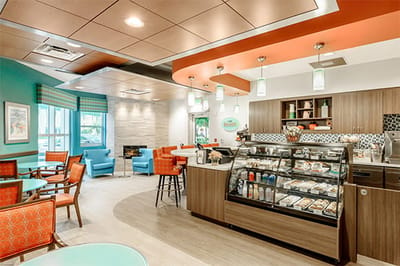
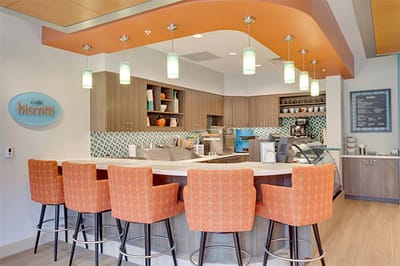
Enjoy personal time and cherish moments with friends in the stunning spaces of the community. Conveniently located near local attractions and amenities, Vi at Aventura ensures residents’ needs are within a few steps away. Indulge in delightful and healthy meals catering to dietary requirements and tastes. Vi at Aventura is a haven for seniors seeking an active and well-cared-for lifestyle with its ethereal campus filled with a warm and welcoming environment.

Quality ratings

Measured by Centers for Medicare & Medicaid Services (CMS)

Overall rating Info The Overall CMS Rating combines results from health inspections, staffing levels and quality measures. Health inspections carry the most weight. Staffing and quality scores can increase or decrease the final rating based on performance compared to state and national standards.
▲ 36.6% Above FL avg. ▲ 36.6% Above FL avg.Click the badge to see the full State ranking.Click here to see the full State ranking.
Health Inspection Info Based on the results of the facility's three most recent standard inspections and any complaint investigations. CMS reviews the number, scope, and severity of deficiencies, with more recent findings weighted more heavily.
▲ 57.7% Above FL avg. ▲ 57.7% Above FL avg.Click the badge to see the full State ranking.Click here to see the full State ranking.
Staffing Info Measures average nursing staff hours per resident per day, including Registered Nurses (RNs) and total nursing staff. Ratings are adjusted based on the level of care residents require and are compared to state and national benchmarks.
▲ 34.0% Above FL avg. ▲ 34.0% Above FL avg.Click the badge to see the full State ranking.Click here to see the full State ranking.
Quality Measures Info Based on clinical and physical health indicators reported to CMS, such as hospital readmissions, falls, pressure ulcers, and improvements in mobility. These measures reflect how well residents' health needs are being managed.
▲ 17.1% Above FL avg. ▲ 17.1% Above FL avg.Click the badge to see the full State ranking.Click here to see the full State ranking.

Staffing hours breakdown

Info Daily nursing hours per resident by staff type, reported to CMS. Higher is generally better — compare this facility to state and national averages to see where staffing stands.

Hours per resident per day — compared to Florida state averages

Total nursing care / resident Info This home is ranked 46th out of 252 homes in Florida. Total adjusted nursing hours per resident per day, combining RN, LPN, and aide time. CMS adjusts this for case-mix so facilities can be fairly compared.
4h 43m per day
Rank #46 / 252Nurse hours — State benchmarkedThis home is ranked 46th out of 252 homes in Florida. Shows adjusted nurse hours per resident per day benchmarked to the Florida average, with a ranking across 252 Florida SNFs. More hours mean more direct care. The national average is about 3.5 hrs; below 3.0 is a red flag.Click the rank badge to see the full State ranking.Click here to see the full State ranking.
This facility Florida avg (4h 25m per day)
vs Florida avg
+7%

2 of 6 metrics below state avg

Standout metric Registered Nurse (RN) is +100% above state avg
Staff typeHours / Day / Residentvs state avg
Registered Nurse (RN) Info RNs hold the highest nursing license and can assess residents, interpret test results, and direct care plans. More RN hours per day often signals stronger clinical oversight and faster response to health changes. 1h 28m per day ▲ 100% State avg: 44m per day · National avg: 41m per day
LPN / LVN Info Licensed Practical Nurses (LPNs) or Licensed Vocational Nurses (LVNs) deliver routine hands-on care — medication administration, wound dressing, and monitoring vital signs. They work under RN supervision and make up a large share of daily bedside care. 45m per day ▼ 4% State avg: 47m per day · National avg: 52m per day
Nurse Aide Info Certified Nurse Aides (CNAs) provide the most direct day-to-day assistance: bathing, dressing, feeding, and mobility. Nurse aide hours are typically the largest staffing category and directly affect residents' quality of life. 2h 58m per day ▲ 27% State avg: 2h 20m per day · National avg: 2h 20m per day
Weekend Total Nursing Info Combined nursing hours (RN + LPN + Nurse Aide) per resident per day on weekends. Staffing often drops on weekends — this figure reveals whether the facility maintains adequate coverage outside of weekday hours. 4h 39m per day ▲ 32% State avg: 3h 31m per day · National avg: 3h 26m per day
Physical Therapist Info Hours per resident per day provided by licensed Physical Therapists (PTs) or PT Assistants. PT services help residents recover mobility after injury or illness and are especially important for post-acute (short-stay) rehabilitation. 3m per day ▼ 40% State avg: 5m per day · National avg: 4m per day
Weekend RN Info Registered nurse hours specifically on weekends. Facilities sometimes reduce RN presence on Saturdays and Sundays — a low weekend RN figure compared to weekday hours can indicate reduced clinical oversight when most administrative staff are absent. 47m per day ▲ 47% State avg: 32m per day · National avg: 28m per day

Types of Care at Vi at Aventura

Assisted Living Independent Living Memory Care Skilled Nursing

Capacity and availability

Avg. Length of Stay
62 days
Bed community size
26-bed community Rank #872 / 1065Bed count — State benchmarkedThis home is ranked 872nd out of 1065 homes in Florida. Shows this facility's certified or reported bed count compared to other Florida SNFs. Larger communities may offer more amenities, programs, and on-site services for residents and families.Click the rank badge to see the full State ranking.Click here to see the full State ranking.
A moderately sized community that may balance personal attention with shared amenities and social activities.
Walk Score
Walk Score: 69 / 100 Rank #222 / 1486Walk Score — State benchmarkedThis home is ranked 222nd out of 1486 homes in Florida. Shows how walkable this facility's neighborhood is compared to the average Walk Score across Florida SNFs. Higher scores benefit residents, families, and staff.Click the rank badge to see the full State ranking.Click here to see the full State ranking.
Moderately walkable. Some errands can be accomplished on foot, with a mix of nearby amenities.

About this community

Occupancy

Occupancy rate
77%
Rank #200 / 255Occupancy rate — State benchmarkedThis home is ranked 200th out of 255 homes in Florida. Shows this facility's occupancy rate versus the Florida average, with its Statewide rank out of 255. Higher occupancy signals strong local demand and financial stability.Click the rank badge to see the full State ranking.Click here to see the full State ranking.
Lower than the Florida average: 84.3%
Occupied beds
20 / 26
Average residents per home in Florida 108 per day

License Details

Facility TypeAssisted Living Facility
StatusIn Review
IssuanceMarch 2, 2024
ExpirationFebruary 2, 2026
CountyMiami-Dade
License Number10382
CMS Certification Number106076
RCFE NumberFAC #88173

Ownership & Operating Entity

Vi at Aventura is legally operated by Cc-aventura, Inc., and administrated by Martine Cesaire-Francois.

Management CompanyCLASSIC RESIDENCE MANAGEMENT LIMITED PARTNERSHIP
Profit StatusFor-Profit

Staffing

Key information about the people who lead and staff this community.

Languages Spoken

Creole English French Spanish

Therapy & Rehabilitation

3 services
Rehabilitation Services
Respite Care
Short-Term Rehab

Additional Services

1 service
Memory Support

Additional Policies & Features

Continuing Care Retirement Community (CCRC)

Amenities & Lifestyle

Specific ProgramsDining and Amenities, Your Well-Being

Dining & Nutrition

Food DescriptionVi at Aventura offers globally influenced dining with casual and fine-dining options, featuring a variety of culinary offerings.

Contact Vi at Aventura

Inspection History

In Florida, the Agency for Health Care Administration (AHCA) is the primary authority that conducts unannounced inspections and completes official health quality reports for all healthcare facilities.

Since 2013 · 13 years of data 19 citations 17 inspections 1 fine $500 fined

Inspection Scorecard Info This scorecard compares key inspection, citation, and complaint metrics at this facility against the Florida state average. Metrics rated ≥15% worse than average are highlighted in red; those ≥15% better are highlighted in green.

Since 2013 vs. Florida state average
Overall vs. FL average 0 Worse No metrics in this bucket. 6 Better Metrics better than Florida average:
• Total citations (42% below)
• Citations per year (40% below)
• Citations per inspection (15% below)
• Total inspections (35% below)
• Inspections with citations (38% below)
• Inspection citation rate (5% below)
Latest Inspection May 27, 2025 Monitor

Citations Info Citations are formal regulatory issues recorded during state inspections.

This FacilityFL Averagevs. FL Avg
Total citations Info Formal regulatory issues recorded by inspectors across all inspection types. 1933 This facility has 42% fewer total citations than a typical Florida nursing home (19 vs. FL avg 33).↓ 42% better
Citations per year Info Average citations per year since 2013. 1.52.5 This facility has 40% fewer citations per year than a typical Florida nursing home (1.5 vs. FL avg 2.5).↓ 40% better
Citations per inspection Info Average citations per inspection. 1.11.3 This facility has 15% fewer citations per inspection than a typical Florida nursing home (1.1 vs. FL avg 1.3).↓ 15% better

Inspections Info State inspections evaluate whether the facility meets health and safety standards.

This FacilityFL Averagevs. FL Avg
Total inspections Info Combined count of all routine and focused inspections. Excludes complaint investigations. 1726 This facility has 35% fewer total inspections than a typical Florida nursing home (17 vs. FL avg 26).↓ 35% better
Inspections with citations Info Inspections that resulted in at least one regulatory citation. 1016 This facility has 38% fewer inspections with citations than a typical Florida nursing home (10 vs. FL avg 16).↓ 38% better
Inspection citation rate Info Percentage of inspections that resulted in at least one citation. 59%62% This facility has 3 percentage points lower inspection citation rate than a typical Florida nursing home (59% vs. FL avg 62%).↓ 3% better

Inspection Reports Summary Info An editor-reviewed summary of the themes and findings across this facility's recent inspection reports.

VI at Aventura underwent its most recent inspection on May 27, 2025, which reported no deficiencies. Over the reporting period from October 31, 2013, to May 27, 2025, a total of 17 inspections were conducted, with all but one citing deficiencies. The facility was found to have a total of 19 line-item deficiencies across these inspections. Common themes identified during this time included building maintenance and physical plant issues, as well as concerns related to records and documentation, resident care and rights, infection control, and emergency planning.

Read the full inspection reports for this facility, including detailed findings and corrective actions.

Show Inspection Reports

Health Inspection History

Inspections since 2023
Total health inspections 2

Florida average 4.3


Last Health inspection on May 2024

Total health citations
7 Rank #26 / 251Health citations — State benchmarkedThis home is ranked 26th out of 251 homes in Florida. Shows this facility's total health deficiency citations benchmarked to the Florida State average, with a ranking across all 251 FL SNFs. Lower citation counts earn a better rank.Click the rank badge to see the full State ranking.Click here to see the full State ranking.

Florida average 19.7

Citations per inspection
3.5 Rank #84 / 251Citations per inspection — State benchmarkedThis home is ranked 84th out of 251 homes in Florida. Shows average deficiency citations per CMS inspection for this facility versus the Florida mean across 251 SNFs with citation data. Lower is better.Click the rank badge to see the full State ranking.Click here to see the full State ranking.

Florida average 4.48


Health citations are formal notices following inspections when they fail to comply with safety and care standards.

All 7 citations resulted from standard inspections.

Breakdown of citation severity (last 3 years)
Critical Health citations
0
100% better than Florida average

Florida average: 0.8


Serious Health citations
0
100% better than Florida average

Florida average: 0.4

0 critical citations Florida average: 0.8

0 serious citations Florida average: 0.4

7 moderate citations Florida average: 18.4

0 minor citations Florida average: 0.2
Citations history (last 3 years)
Administration moderate citation May 02, 2024
Corrected

Infection Control moderate citation May 02, 2024
Corrected

Nutrition moderate citation May 02, 2024
Corrected

Quality of Care moderate citation May 02, 2024
Corrected

Staffing Data

Reporting period: October 1 – December 31, 2025 (Q4 2025). Source: CMS Payroll-Based Journal report.

Total staff 66
Employees 55
Contractors 11
Staff to resident ratio 0:0
100% worse than Florida average
Florida average ratio: 1.47:1 Florida average ratio: 1.47:1See full Florida ranking
Avg staff/day 27
Average shift 8.1 hours
0% compared with Florida average
Florida average: 7.9 hours Florida average shift: 7.9 hoursSee full Florida ranking
Total staff hours (quarter) 20,130

Nursing staff breakdown

Q4 2025 · Oct 1 – Dec 31 More info This data comes from the CMS Payroll-Based Journal report covering October 1 – December 31, 2025.
Registered Nurse

Manages medical care and health needs.

RN Staff 8
Average shift length Info Average shift length. Calculated as total hours divided by days worked and average staff per day. 8.4 hours

No contractors work on this role.

Licensed Practical Nurse

Assists with medical care and medications.

LPN Staff 9
Average shift length Info Average shift length. Calculated as total hours divided by days worked and average staff per day. 9.7 hours

No contractors work on this role.

Certified Nursing Assistant

Helps with daily care and mobility.

CNA Staff 27
Average shift length Info Average shift length. Calculated as total hours divided by days worked and average staff per day. 9.2 hours

No contractors work on this role.

Contractor staffing

Q4 2025 · Oct 1 – Dec 31 More info This data comes from the CMS Payroll-Based Journal report covering October 1 – December 31, 2025.

Total hours from contractors

10.3%

2,079 contractor hours this quarter

Speech Language Pathologist: 3 Respiratory Therapy Technician: 2 Physical Therapy Aide: 2 Qualified Social Worker: 1 Physical Therapy Assistant: 1 Medical Director: 1 Occupational Therapy Assistant: 1

Staff by category

Q4 2025 · Oct 1 – Dec 31 More info This data comes from the CMS Payroll-Based Journal report covering October 1 – December 31, 2025.
Certified Nursing Assistant270278,99792100%9.2
Licensed Practical Nurse9092,48292100%9.7
Registered Nurse8082,39392100%8.4
Other Dietary Services Staff3031,1168997%7.5
Clinical Nurse Specialist3039198390%6.4
Nurse Practitioner2028636368%7.5
Speech Language Pathologist0338376672%6.2
Dental Services Staff1014886571%7.5
Dietitian1014135560%7.5
Physical Therapy Aide0223926267%6
Administrator1013835155%7.5
Qualified Social Worker0113446773%5.1
Physical Therapy Assistant0112466166%4
Respiratory Therapy Technician0222266975%3.1
Medical Director0112333%7.5
Occupational Therapy Assistant0111233%4
27 Certified Nursing Assistant
% of Days 100%
9 Licensed Practical Nurse
% of Days 100%
8 Registered Nurse
% of Days 100%
3 Other Dietary Services Staff
% of Days 97%
3 Clinical Nurse Specialist
% of Days 90%
2 Nurse Practitioner
% of Days 68%
3 Speech Language Pathologist
% of Days 72%
1 Dental Services Staff
% of Days 71%
1 Dietitian
% of Days 60%
2 Physical Therapy Aide
% of Days 67%
1 Administrator
% of Days 55%
1 Qualified Social Worker
% of Days 73%
1 Physical Therapy Assistant
% of Days 66%
2 Respiratory Therapy Technician
% of Days 75%
1 Medical Director
% of Days 3%
1 Occupational Therapy Assistant
% of Days 3%

Penalties and fines

Federal penalties imposed by CMS for regulatory violations, including civil money penalties (fines) and denials of payment for new Medicare/Medicaid admissions.

Source: CMS Penalties Database

No penalties in the past 3 years

No civil money penalties or payment denials were reported in the last 3 years.

Quality of care over time

These measures show how residents usually do over time at this home, based on health outcomes and preventive care.

High-risk clinical events score Info A composite score based on pressure ulcers, falls with injury, weight loss, walking ability decline, and activities of daily living decline. 5.0
33% better than Florida average

Florida average: 7.4

Functional decline score Info A composite score based on activities of daily living decline, walking ability decline, and incontinence. 6.8
45% better than Florida average

Florida average: 12.4

Long-stay resident measures
Significantly above average Florida avg: 4.5 Info CMS star rating based on long-stay quality measure performance. 5 stars = significantly above average, 1 star = significantly below average.
Need for Help with Daily Activities Increased Info Percent of long-stay residents whose need for help with daily activities has increased 8.9%
15% better than Florida average

Florida average: 10.5%

Walking Ability Worsened Info Percent of long-stay residents whose ability to move independently worsened 11.6%
11% better than Florida average

Florida average: 12.9%

Low Risk Residents with Bowel/Bladder Incontinence Info Percent of low risk long-stay residents who lose control of their bowels or bladder 0.0%
100% better than Florida average

Florida average: 13.5%

Falls with Major Injury Info Percent of long-stay residents experiencing one or more falls with major injury 2.7%
In line with Florida average

Florida average: 2.6%

High Risk Residents with Pressure Ulcers Info Percent of long-stay high risk residents with pressure ulcers 1.8%
67% better than Florida average

Florida average: 5.4%

Urinary Tract Infection Info Percent of long-stay residents with a urinary tract infection 1.4%
55% worse than Florida average

Florida average: 0.9%

Lost Too Much Weight Info Percent of long-stay residents who lose too much weight 0.0%
100% better than Florida average

Florida average: 6.0%

Depressive Symptoms Info Percent of long-stay residents who have depressive symptoms 0.0%
100% better than Florida average

Florida average: 3.3%

Antipsychotic Use Info Percent of long-stay residents who received an antipsychotic medication 7.0%
12% better than Florida average

Florida average: 8.0%

Pneumococcal Vaccine Info Percent of long-stay residents assessed and appropriately given the pneumococcal vaccine 100.0%
In line with Florida average

Florida average: 97.7%

Influenza Vaccine Info Percent of long-stay residents assessed and appropriately given the seasonal influenza vaccine 100.0%
In line with Florida average

Florida average: 99.2%

Hospitalizations per 1,000 days Info Number of hospitalizations per 1,000 long-stay resident days. 2.63
25% worse than Florida average

Florida average: 2.10

ED visits per 1,000 days Info Number of outpatient emergency department visits per 1,000 long-stay resident days. 0.42
64% better than Florida average

Florida average: 1.18

Short-stay resident measures
Above average Florida avg: 3.1 Info CMS star rating based on short-stay quality measure performance. 5 stars = much above average, 1 star = much below average.
Pneumococcal Vaccine Info Percent of short-stay residents assessed and appropriately given the pneumococcal vaccine 100.0%
6% better than Florida average

Florida average: 94.0%

Antipsychotic medication increase Info Percent of short-stay residents who newly received an antipsychotic medication 0.7%
51% better than Florida average

Florida average: 1.5%

Influenza Vaccine Info Percent of short-stay residents assessed and appropriately given the seasonal influenza vaccine 100.0%
6% better than Florida average

Florida average: 94.7%

Re-hospitalized after SNF stay Info Percentage of short-stay residents who were re-hospitalized after their nursing home admission. 26.2%
In line with Florida average

Florida average: 26.2%

Emergency department visits Info Percentage of short-stay residents who had an outpatient emergency department visit. 10.2%
10% worse than Florida average

Florida average: 9.3%

Falls with major injury Info Percentage of SNF residents who experience falls with major injury during their stay. 0.5%
30% better than Florida average

Florida average: 0.8%

Ability to care for self at discharge Info Percentage of residents at or above expected ability to care for themselves at discharge. 48.5%
10% worse than Florida average

Florida average: 53.7%

Successful return to home or community Info Rate of successful return to home or community from a skilled nursing facility. 69.1%
37% better than Florida average

Florida average: 50.6%

Breakdown by payment type

Medicare

88% of new residents, usually for short-term rehab.

Typical stay 1 months

Private pay

12% of new residents, often for short stays.

Typical stay 9 - 10 months

Finances and operations

Privately-owned community
Operated by a business corporation.
Home revenue
$27.3M
Operating loss
-$5.9M
Privately-owned community Operated by a business corporation.
Home revenue
$27.3M Rank #55 / 256Revenue — State benchmarkedThis home is ranked 55th out of 256 homes in Florida. Shows this facility's annual revenue compared to the Florida SNF average. Higher revenue generally means more resources for staffing and capital — read alongside Payroll %.Click the rank badge to see the full State ranking.Click here to see the full State ranking.
Operating loss
-$5.9M
Payroll costs Info The portion of the home's budget spent on staff, including nurses, caregivers, and other employees who support care and operations. Rank #178 / 256Payroll — State benchmarkedThis home is ranked 178th out of 256 homes in Florida. Shows total annual staff payroll benchmarked to the Florida average. Higher payroll investment relative to peers often signals better staffing and less reliance on cheaper contract labor.Click the rank badge to see the full State ranking.Click here to see the full State ranking.
$6.5M
23.9% of revenue Rank #248 / 256Payroll % — State benchmarkedThis home is ranked 248th out of 256 homes in Florida. Shows payroll as a percentage of revenue versus the Florida average. Well-run Florida SNFs typically land around 49–56% — the top third Statewide. Below 25% may signal understaffing or heavy agency use — read with Staffing ratings.Click the rank badge to see the full State ranking.Click here to see the full State ranking.
Other operating costs Info All remaining costs needed to run the home, such as food, utilities, building maintenance, supplies and administrative expenses.
$12.2M
Total costs $18.7M

What does this home offer?

Housing options icon

Housing Options: 1 Bed / 2 Bed

Building type icon
Building type icon

Building Type: High-rise

Transportation services icon

Transportation Services

Fitness and recreation icon

Fitness and Recreation

Who this home usually serves

TYPE OF STAY

Mostly short-term rehab stays

Most residents typically stay for a few weeks or months before returning home or moving on.

Activities in this home

Places of interest near Vi at Aventura

Address 0.1 mile from city center

Calculate Travel Distance to Vi at Aventura

Add your location

Address

Financial Assistance for
Nursing Home in Florida

Vi at Aventura is located in Aventura, Florida.
Here are the financial assistance programs available to residents in Florida.

Get Financial aid guidance

Long-Term Care Waiver

Florida Medicaid LTC Waiver

Age 65+ or 21+ disabled
General Florida resident, Medicaid- eligible, nursing home-level care need.
Income Limits (2025) ~$2,829/month 300% FBR, individual
Asset Limits $2,000 (individual), $3,000 (couple).
FL

High demand; waitlists common.

Benefits
In-home care (6-8 hours/day) Assisted living Respite (240 hours/year) Case management

Community Care for the Elderly (CCE)

Florida CCE

Age 60+
General Florida resident, at risk of nursing home.
Income Limits ~$2,000/month varies
Asset Limits $5,000 individual
FL

Limited funding; regional variation.

Benefits
Homemaker services (3-5 hours/week) Adult day care (~$60/day) Respite (up to 10 days/year)

Home Care for the Elderly (HCE)

Florida Home Care for the Elderly

Age 60+
General Florida resident, at risk of nursing home placement; caregiver must be approved.
Income Limits (2025) ~$2,829/month individual, aligned with Medicaid thresholds
Asset Limits ~$2,000 (individual); varies by case manager discretion.
FL

Limited funding (~3,500 served annually); prioritizes low-income frail seniors.

Benefits
Basic subsidy (~$160/month) for housing/medical costs; special subsidies for supplies/services (e.g., incontinence supplies, ~$50-$200/month)

Program of All-Inclusive Care for the Elderly (PACE)

Florida Medicaid PACE

Age 55+
General Florida resident, nursing home-level care need, safe with PACE support.
Income Limits (2025) ~$2,829/month 300% FBR
Asset Limits $2,000 (individual), $3,000 (couple).
FL

Limited to specific counties (e.g., Hillsborough, Miami-Dade); ~10 sites statewide.

Benefits
Personal care (5-7 hours/day) Medical care Meals Transportation Therapy

Optional State Supplementation (OSS)

Florida Optional State Supplementation

Age 65+ or disabled
General Florida resident, living in approved facility, receiving SSI or low-income.
Income Limits (2025) ~$1,004/month individual, including SSI
Asset Limits $2,000 (individual), $3,000 (couple).
FL

Limited to specific facility types; ~$78.40/month max supplement.

Benefits
Cash payment (~$78.40/month) for room/board or personal needs in facilities

Frequently Asked Questions about Vi at Aventura

What languages are spoken at Vi at Aventura?

The team at Vi at Aventura speaks Creole, English, French, and Spanish.

Who is the owner of Vi at Aventura?

The legal owner and operator of Vi at Aventura is Cc-Aventura, Inc..

Is Vi at Aventura in a walkable area?

Vi at Aventura has a walk score of 69. Moderately walkable. Some errands can be accomplished on foot, with a mix of nearby amenities.

What is the license number of Vi at Aventura?

According to FL state health department records, Vi at Aventura's license number is 10382.

When does Vi at Aventura's license expire?

According to FL state health department records, Vi at Aventura's license expires on February 2, 2026.

What is the occupancy rate at Vi at Aventura?

Vi at Aventura's occupancy is 77%.

What payment types does Vi at Aventura accept?

Vi at Aventura accepts CHAMPUS, Insurance and/or HMO, and Medicare.

Guides for Better Senior Living

Care Cost Calculator: See Prices in Your Area

Nursing Home Data Explorer

Don’t Wait Too Long: 7 Red Flag Signs Your Parent Needs Assisted Living Now

The True Cost of Assisted Living in 2025 – And How Families Are Paying For It

Understanding Senior Living Costs: Pricing Models, Discounts & Financial Assistance

Explore Open Rooms
1 Contact details
2 What type of senior care service are you looking for?
3 What budget do you have in mind for senior care?
4 How soon do you need to find care?
5 Additional details

Thank you for your interest!

Our team will be in touch shortly to help with next steps.