Explore Open Rooms

1 Contact details
2 What type of senior care service are you looking for?
3 What budget do you have in mind for senior care?
4 How soon do you need to find care?
5 Additional details

Thank you for your interest!

Our team will be in touch shortly to help with next steps.

Nursing Home

Villa Gardens Health Center

Nursing Home

Villa Gardens Health Center

842 E Villa St, Pasadena, CA 91101 View map
Overview of Villa Gardens Health Center

A stand out for comprehensive senior care, Villa Gardens Health Center offers a holistic approach to well-being for residents seeking either short-term rehabilitation or long-term skilled nursing. A team of dedicated healthcare professionals, encompassing doctors, nurses, therapists, and social workers, collaborate to craft individualized care plans that address each resident’s specific needs, to help residents regain strength, improve daily living skills, and regain their confidence. Residents benefit from a structured program designed to maximize progress, with access to state-of-the-art equipment and compassionate guidance from therapists.

Villa Gardens provides 24/7 assistance with daily living activities, ensuring residents receive the support they need while maintaining their autonomy as much as possible. Spacious private and semi-private rooms create a comfortable living space, while beautifully landscaped gardens offer a serene environment for relaxation and socialization.

(626) 463-6160

Quality ratings

Measured by Centers for Medicare & Medicaid Services (CMS)

Overall rating Info The Overall CMS Rating combines results from health inspections, staffing levels and quality measures. Health inspections carry the most weight. Staffing and quality scores can increase or decrease the final rating based on performance compared to state and national standards.
5/5
California average: 3.6/5
Health Inspection Info Based on the results of the facility's three most recent standard inspections and any complaint investigations. CMS reviews the number, scope, and severity of deficiencies, with more recent findings weighted more heavily.
4/5
California average: 3.2/5
Staffing Info Measures average nursing staff hours per resident per day, including Registered Nurses (RNs) and total nursing staff. Ratings are adjusted based on the level of care residents require and are compared to state and national benchmarks.
4/5
California average: 3.5/5
Quality Measures Info Based on clinical and physical health indicators reported to CMS, such as hospital readmissions, falls, pressure ulcers, and improvements in mobility. These measures reflect how well residents' health needs are being managed.
5/5
California average: 4.3/5

Nursing care per resident

Info This shows how many total hours of nursing staff time are available per resident each day. Higher numbers usually mean more staff support.
5h 11m per day

This home provides 18% more nursing time per resident than the California average.

California average: 4h 23m per day

Staffing hours breakdown

Info Hours of care per resident per day, broken down by staff type. Data from CMS Medicare.
Staff type Facility State avg National avg
Registered Nurse (RN) Info Registered nurse hours per resident per day. 20m per day 39m per day 41m per day
Nurse Aide Info Nurse aide hours per resident per day. 3h 4m per day 2h 39m per day 2h 21m per day
Total Nursing (Weekend) Info Total number of nurse staff hours per resident per day on weekends. 4h 39m per day 4h 5m per day 3h 26m per day
Physical Therapist Info Physical therapist staff hours per resident per day. 8m per day 5m per day 4m per day
RN (Weekend) Info Registered nurse hours per resident per day on weekends. 12m per day 30m per day 29m per day

Capacity and availability

High-capacity home

May provide extensive amenities, services and programs.

Total beds 340

This home usually has availability

Lower occupancy suggests more openings may be available.

Lower demand than the California average
Occupancy rate 79.9%
Residents per day (avg) 44
Occupancy rate
79.9%
Residents per day (avg)
44

Who this home usually serves

TYPE OF STAY

Mostly short-term rehab stays

Most residents typically stay for a few weeks or months before returning home or moving on.

Might be optimal for
Short stays Recovery Medicare-covered care

Breakdown by payment type

Medicare

78% of new residents, usually for short-term rehab.

Typical stay 21 days

Private pay

21% of new residents, often for short stays.

Typical stay 9 - 10 months

Finances and operations

Voluntary non-profit community
Home revenue
$32.0M
Surplus of revenue
$3.6M
Voluntary non-profit community
Home revenue
$31,978,406.00
Surplus of revenue
$3,606,436.00
Payroll costs Info The portion of the home's budget spent on staff, including nurses, caregivers, and other employees who support care and operations.
$11.0M
34.4% of revenue
Other operating costs Info All remaining costs needed to run the home, such as food, utilities, building maintenance, supplies and administrative expenses.
$17.4M
Total costs $28.4M
Bed community size
340-bed community
A large-scale community that may provide a wide range of amenities, services, and structured programs.
Walk Score
Walk Score: 79 / 100
Very walkable. Most errands can be accomplished on foot, and many essentials are within a short walk.
BBB Rating
BBB Rating: A+ (Not Accredited)
An independent rating from the Better Business Bureau based on factors such as complaint history, transparency, and business practices.
How BBB ratings work

About this community

Occupancy

Occupancy rate
6%
92% lower than California average

California average: 73%

Occupied beds
19 / 340
Average residents 87 per day

License details

County: LOS ANGELES

Inspection History

In California, the Department of Social Services (for assisted living facilities) and the Department of Public Health (for nursing homes) conduct inspections to ensure resident safety and regulatory compliance.

9 visits

California average: 16 visits

Breakdown by visit type

3 total complaint visits

6 other visits Info Other visits include regulatory visits that are not routine inspections or complaint investigations, such as administrative check-ins, follow-up reviews, or licensing-related visits.

California average

13 total complaint visits

7 other visits

3 complaint investigations

Investigations can have many visits.

California average: 10 complaint investigations

5 official inspections

California average: 4 official inspections

10 total citations

Citations indicate regulatory violations. A higher number implies the facility had several areas requiring improvement.

California average: 10 citations

6 serious citations

A violation that poses an immediate risk to resident health or safety, or represents a substantial failure to comply with licensing requirements.

California average: 3 serious citations

4 moderate citations

A violation that does not pose an immediate risk to resident health or safety but requires correction to remain in compliance.

California average: 4 moderate citations

Health Inspection History

Inspections
Total health inspections 5

California average 12.5


Last Health inspection on Oct 2024

Total health citations 38

California average 50.2

Citations per inspection
7.6

California average 4.65


Health citations are formal notices following inspections when they fail to comply with safety and care standards.

34 of 38 citations resulted from standard inspections; and 4 of 38 resulted from complaint investigations.

Breakdown of citation severity (last 3 years)
Critical Health citations More info 0
100% better than California average

California average: 0.4


Serious Health citations More info 0
100% better than California average

California average: 1

0 critical citations More info California average: 0.4

0 serious citations More info California average: 1

38 moderate citations More info California average: 47.2

0 minor citations More info California average: 1.5
Citations history (last 3 years)
Environmental moderate citation Info Issues related to building safety, cleanliness, maintenance, and overall living conditions. Oct 04, 2024
Corrected

Infection Control moderate citation Info Issues related to preventing and controlling infections, including hygiene practices and safety protocols. Oct 04, 2024
Corrected

Nutrition moderate citation Info Issues related to food quality, meal service, and resident's nutritional needs. Oct 04, 2024
Corrected

Nutrition moderate citation Info Issues related to food quality, meal service, and resident's nutritional needs. Oct 04, 2024
Corrected

Compare Nursing Homes around Pasadena The information below is reported by the California Department of Social Services and Department of Public Health.

5 facilities compared · CMS & CA Dept. of Health data · Updated Mar 2026

Villa Gardens Health Center
AL

Assisted Living A licensed, long-term care setting for seniors or individuals with disabilities who need help with daily activities — like bathing, dressing, and medication management — but not 24-hour skilled nursing. Offers housing, meals, and around-the-clock support while aiming to maximize resident independence.

IL

Independent Living Lifestyle-focused communities for older adults offering dining, activities, and transportation with minimal personal care. Best for active, independent seniors who want community without medical support.

MC

Memory Care Secured, specialized care for people living with Alzheimer's or dementia. Staff trained in cognitive impairment, with higher staff-to-resident ratios and an environment designed to reduce confusion and wandering risk.

NH

Nursing Home Licensed facility providing 24/7 skilled nursing care for residents with complex, ongoing medical needs. Staffed by RNs, LPNs, and CNAs. Inspected and star-rated annually by CMS. Accepts Medicare (short-term rehab) and Medicaid (long-term care).

Pasadena
73
5.6%
-93%
5.18
-22%
+23%
0
38
0
44
A+
79
Rushforth, Shaun
$11,6M
$11,0M
95.3%
555429
1 Bed / 2 Bed
Foothill Heights Care Center
NH

Nursing Home Licensed facility providing 24/7 skilled nursing care for residents with complex, ongoing medical needs. Staffed by RNs, LPNs, and CNAs. Inspected and star-rated annually by CMS. Accepts Medicare (short-term rehab) and Medicaid (long-term care).

RC

Respite Care Short-term temporary care — days to weeks — to give family caregivers a break. Full care provided during the stay. Often used after hospitalization or to trial a facility before a permanent placement decision.

Pasadena (North Central)
49
86.1%
+2%
3.97
-12%
-6%
2
49
0
44
A+
69
Foothill Heights Care Center Llc
$9,2M
$3,1M
34%
555894
-
Brighton Care Center
NH

Nursing Home Licensed facility providing 24/7 skilled nursing care for residents with complex, ongoing medical needs. Staffed by RNs, LPNs, and CNAs. Inspected and star-rated annually by CMS. Accepts Medicare (short-term rehab) and Medicaid (long-term care).

Pasadena (North Central)
99
82.9%
-2%
4.17
-37%
-1%
0
63
1
89
-
62
Rodriquez, Rachel
$14,3M
$5,0M
35%
555338
-
Pasadena Nursing Center
NH

Nursing Home Licensed facility providing 24/7 skilled nursing care for residents with complex, ongoing medical needs. Staffed by RNs, LPNs, and CNAs. Inspected and star-rated annually by CMS. Accepts Medicare (short-term rehab) and Medicaid (long-term care).

RC

Respite Care Short-term temporary care — days to weeks — to give family caregivers a break. Full care provided during the stay. Often used after hospitalization or to trial a facility before a permanent placement decision.

Pasadena (North Central)
99
77.8%
-8%
4.14
-8%
-2%
2
85
4
59
-
64
Gardena Retirement Center, Inc.
$7,8M
$3,8M
48.7%
555213
-
Pasadena Villa Senior Living
-
NH

Nursing Home Licensed facility providing 24/7 skilled nursing care for residents with complex, ongoing medical needs. Staffed by RNs, LPNs, and CNAs. Inspected and star-rated annually by CMS. Accepts Medicare (short-term rehab) and Medicaid (long-term care).

AL

Assisted Living A licensed, long-term care setting for seniors or individuals with disabilities who need help with daily activities — like bathing, dressing, and medication management — but not 24-hour skilled nursing. Offers housing, meals, and around-the-clock support while aiming to maximize resident independence.

PASADENA
97
-
-
-
-
-
-
-
-
0
0
0
-
-
-
-
-
-
-
-
-

Places of interest near Villa Gardens Health Center

Address 1.2 miles from city center — 5.41 miles to nearest hospital (USC Arcadia Hospital)

Address 842 E Villa St, Pasadena, CA 91101

Calculate Travel Distance to Villa Gardens Health Center

Add your location

Address

Staffing Data (Q2 2025)

This data corresponds to Q2 2025 and is based on CMS Payroll-Based Journal.

Total staff 104
Employees 64
Contractors 40
Staff to resident ratio 2.81:1
2810711% better than California average

California average ratio: 0.00:1

Avg staff/day 36
Average shift 7.6 hours
0% compared with California average

California average: 7.7 hours

Total staff hours (quarter) 24,890
Nursing staff breakdown
Registered Nurse

Manages medical care and health needs.

Total count 7
Average shift length Info Average shift length. Calculated as total hours divided by days worked and average staff per day. 8.2 hours

This role is partially covered by contractors.

Licensed Practical Nurse

Assists with medical care and medications.

Total count 19
Average shift length Info Average shift length. Calculated as total hours divided by days worked and average staff per day. 8.4 hours

This role is partially covered by contractors.

Certified Nursing Assistant

Helps with daily care and mobility.

Total count 47
Average shift length Info Average shift length. Calculated as total hours divided by days worked and average staff per day. 7.7 hours

This role is partially covered by contractors.

Contractor staffing

Total hours from contractors

13.6%

3,385 contractor hours this quarter

Certified Nursing Assistant: 10 Physical Therapy Assistant: 5 Licensed Practical Nurse: 4 Registered Nurse: 4 Occupational Therapy Assistant: 4 Qualified Social Worker: 3 Speech Language Pathologist: 3 Respiratory Therapy Technician: 3 Physical Therapy Aide: 2 Mental Health Service Worker: 1 Other Physician: 1
Staff by category
Certified Nursing Assistant37104712,30691100%7.7
Licensed Practical Nurse154195,45991100%8.4
RN Director of Nursing4041,5416673%8.6
Physical Therapy Assistant0557737077%6.5
Registered Nurse3476677785%8.2
Speech Language Pathologist0336097481%6.2
Respiratory Therapy Technician0335607481%6.6
Other Dietary Services Staff1014906369%7.8
Nurse Practitioner1014886167%8
Occupational Therapy Aide1014806066%8
Mental Health Service Worker1124715965%7.3
Qualified Social Worker0333866774%4.6
Physical Therapy Aide0223725156%7.3
Administrator1012205560%4
Occupational Therapy Assistant04447910%5.2
Other Physician0112133%7
47 Certified Nursing Assistant
% of Days 100%
19 Licensed Practical Nurse
% of Days 100%
4 RN Director of Nursing
% of Days 73%
5 Physical Therapy Assistant
% of Days 77%
7 Registered Nurse
% of Days 85%
3 Speech Language Pathologist
% of Days 81%
3 Respiratory Therapy Technician
% of Days 81%
1 Other Dietary Services Staff
% of Days 69%
1 Nurse Practitioner
% of Days 67%
1 Occupational Therapy Aide
% of Days 66%
2 Mental Health Service Worker
% of Days 65%
3 Qualified Social Worker
% of Days 74%
2 Physical Therapy Aide
% of Days 56%
1 Administrator
% of Days 60%
4 Occupational Therapy Assistant
% of Days 10%
1 Other Physician
% of Days 3%

Facility Characteristics

Source: CMS Long-Term Care Facility Characteristics (Data as of Jan 2026)

Total census
37 residents
Residents by payment source
Medicare
12 residents (32.4%)
Medicaid
10 residents (27%)
Private pay or other
15 residents (40.5%)
Programs & Services
Residents' Group

Residents meet regularly to discuss policies, care quality, and activities

Nurse Aide Training

State-approved Nurse Aide Training and Competency Evaluation Program on-site

CCRC

Part of a Continuing Care Retirement Community offering multiple care levels

Active Resident Council

Organized group of residents that meets regularly to discuss facility policies, quality of life, and activities.

Quality of care over time

These measures show how residents usually do over time at this home, based on health outcomes and preventive care.

High-risk clinical events score Info A composite score based on pressure ulcers, falls with injury, weight loss, walking ability decline, and activities of daily living decline. 12.5
88% worse than California average

California average: 6.6

Functional decline score Info A composite score based on activities of daily living decline, walking ability decline, and incontinence. 25.6
126% worse than California average

California average: 11.3

Long-stay resident measures
Above average California avg: 4.3 Info CMS star rating based on long-stay quality measure performance. 5 stars = significantly above average, 1 star = significantly below average.
Need for Help with Daily Activities Increased Info Percent of long-stay residents whose need for help with daily activities has increased 24.3%
120% worse than California average

California average: 11.1%

Walking Ability Worsened Info Percent of long-stay residents whose ability to move independently worsened 23.5%
96% worse than California average

California average: 12.0%

Low Risk Residents with Bowel/Bladder Incontinence Info Percent of low risk long-stay residents who lose control of their bowels or bladder 29.1%
158% worse than California average

California average: 11.3%

Falls with Major Injury Info Percent of long-stay residents experiencing one or more falls with major injury 7.2%
334% worse than California average

California average: 1.7%

High Risk Residents with Pressure Ulcers Info Percent of long-stay high risk residents with pressure ulcers 3.9%
21% better than California average

California average: 5.0%

Urinary Tract Infection Info Percent of long-stay residents with a urinary tract infection 1.1%
15% better than California average

California average: 1.2%

Lost Too Much Weight Info Percent of long-stay residents who lose too much weight 3.4%
19% better than California average

California average: 4.2%

Depressive Symptoms Info Percent of long-stay residents who have depressive symptoms 0.0%
100% better than California average

California average: 6.7%

Antipsychotic Use Info Percent of long-stay residents who received an antipsychotic medication 0.0%
100% better than California average

California average: 10.1%

Pneumococcal Vaccine Info Percent of long-stay residents assessed and appropriately given the pneumococcal vaccine 100.0%
In line with California average

California average: 98.5%

Influenza Vaccine Info Percent of long-stay residents assessed and appropriately given the seasonal influenza vaccine 100.0%
In line with California average

California average: 98.2%

Hospitalizations per 1,000 days Info Number of hospitalizations per 1,000 long-stay resident days. 1.17
48% better than California average

California average: 2.25
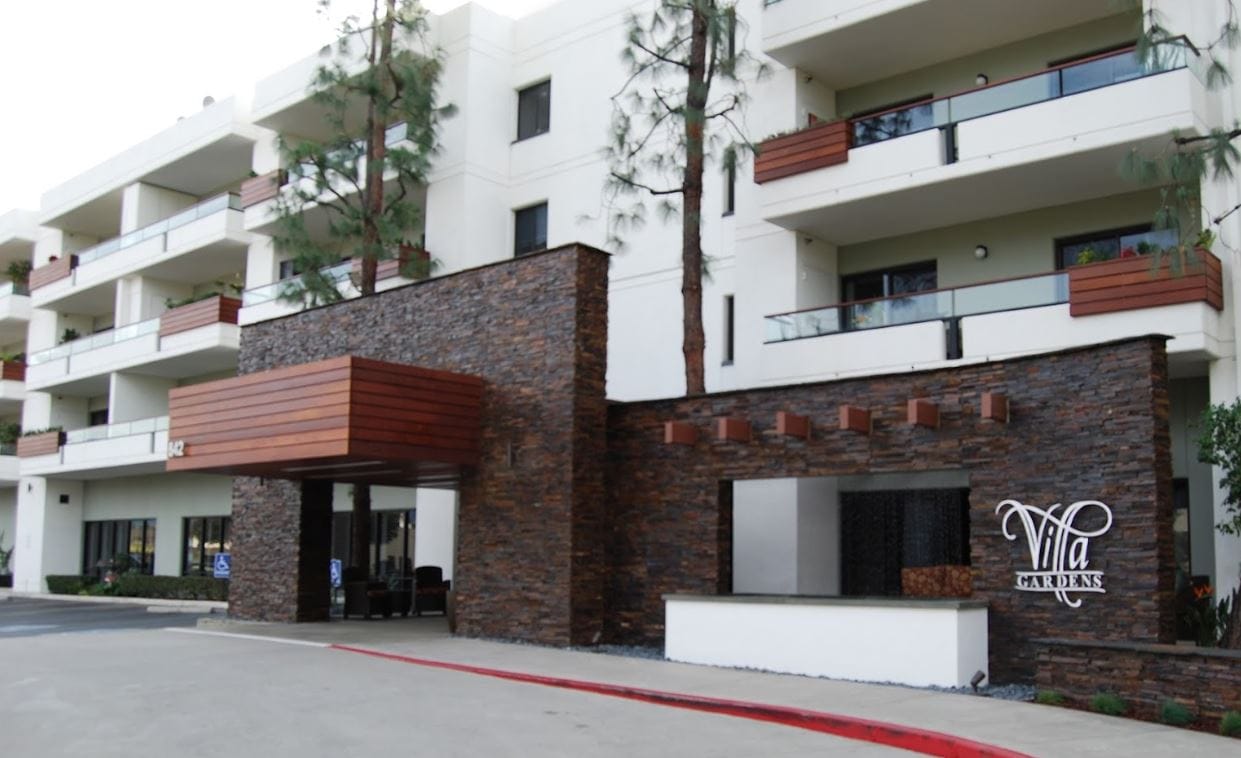
ED visits per 1,000 days Info Number of outpatient emergency department visits per 1,000 long-stay resident days. 0.20
87% better than California average

California average: 1.59

Short-stay resident measures
Significantly above average California avg: 3.5 Info CMS star rating based on short-stay quality measure performance. 5 stars = much above average, 1 star = much below average.
Pneumococcal Vaccine Info Percent of short-stay residents assessed and appropriately given the pneumococcal vaccine 98.0%
In line with California average

California average: 94.0%

Antipsychotic medication increase Info Percent of short-stay residents who newly received an antipsychotic medication 0.6%
57% better than California average

California average: 1.5%

Influenza Vaccine Info Percent of short-stay residents assessed and appropriately given the seasonal influenza vaccine 97.4%
In line with California average

California average: 93.2%

Re-hospitalized after SNF stay Info Percentage of short-stay residents who were re-hospitalized after their nursing home admission. 19.4%
16% better than California average

California average: 23.2%

Emergency department visits Info Percentage of short-stay residents who had an outpatient emergency department visit. 3.3%
71% better than California average

California average: 11.2%

Falls with major injury Info Percentage of SNF residents who experience falls with major injury during their stay. 0.5%
34% better than California average

California average: 0.8%

Ability to care for self at discharge Info Percentage of residents at or above expected ability to care for themselves at discharge. 52.1%
In line with California average

California average: 53.7%

Successful return to home or community Info Rate of successful return to home or community from a skilled nursing facility. 63.5%
26% better than California average

California average: 50.6%

Guides for Better Senior Living

Care Cost Calculator: See Prices in Your Area

Nursing Home Data Explorer

Don’t Wait Too Long: 7 Red Flag Signs Your Parent Needs Assisted Living Now

The True Cost of Assisted Living in 2025 – And How Families Are Paying For It

Understanding Senior Living Costs: Pricing Models, Discounts & Financial Assistance

Financial Aid for California Seniors

Get financial aid guidance

Multipurpose Senior Services Program

MSSP (Medi-Cal Waiver)

Age 65+, California resident, Medi-Cal eligible, nursing home risk.

~$2,829/month (300% FBR, individual).

$2,000 (individual), $3,000 (couple).

County-managed; waitlists possible.

In-Home Supportive Services (IHSS)

California IHSS

Age 65+, California resident, Medicaid-eligible or low-income.

~$1,732/month (individual, Medi-Cal threshold).

$2,000 (individual).

Can hire family as caregivers.

Multipurpose Senior Services Program (MSSP)

CA MSSP

Age 65+, California resident, Medi-Cal-eligible, nursing home-eligible but community-capable.

~$2,829/month (300% FBR, individual).

$2,000 (individual).

Available in 38 counties; waitlists common.

Property Tax Postponement Program (PTP)

CA PTP

Age 62+, California resident, own and live in home, 40% equity.

~$51,500/year (household, adjusted annually).

Equity-based; no strict asset cap.

Deferred taxes accrue interest (5% as of 2024); repaid upon sale/death.

Assisted Living Waiver (ALW)

CA ALW

Age 65+ or disabled, California resident, Medi-Cal-eligible, nursing home-eligible.

~$2,829/month (300% FBR, individual).

$2,000 (individual).

Available in 15 counties (e.g., LA, Sacramento); waitlists common.

California CARES Program

CA CARES

Caregivers of California residents 60+ needing help with 3+ daily activities; no caregiver age limit.

No strict limit; cost-sharing above ~$2,500/month threshold.

Not applicable; need-based.

High demand in urban areas; complements IHSS respite.

Low-Income Home Energy Assistance Program (LIHEAP)

CA LIHEAP

Age 60+ priority, California resident, low-income, utility/heating need.

~$2,510/month (200% of poverty level, individual).

Not applicable; income-focused.

High demand in inland/coastal extremes; weatherization capped at $5,000/home.

Tour Icon
Planning a tour? Check our touring checklist.
Chat Icon
Thinking of living here? We can help you speak to a current resident