Villa Manor Care Center
Nursing Home & Assisted Living · Lakewood, CO
CMS overall rating Info CMS (the Centers for Medicare & Medicaid Services) is the federal agency that rates nursing home quality. Its Overall Rating runs from 1 to 5 stars, combining health inspections, staffing, and quality measures, with inspections weighted most heavily.

Villa Manor Care Center

Nursing Home & Assisted Living · Lakewood, CO
CMS overall rating Info CMS (the Centers for Medicare & Medicaid Services) is the federal agency that rates nursing home quality. Its Overall Rating runs from 1 to 5 stars, combining health inspections, staffing, and quality measures, with inspections weighted most heavily.
Calculator: See prices in your area
Villa Manor Care Center accepts Medicare, Medicaid, and private pay.

Overview of Villa Manor Care Center

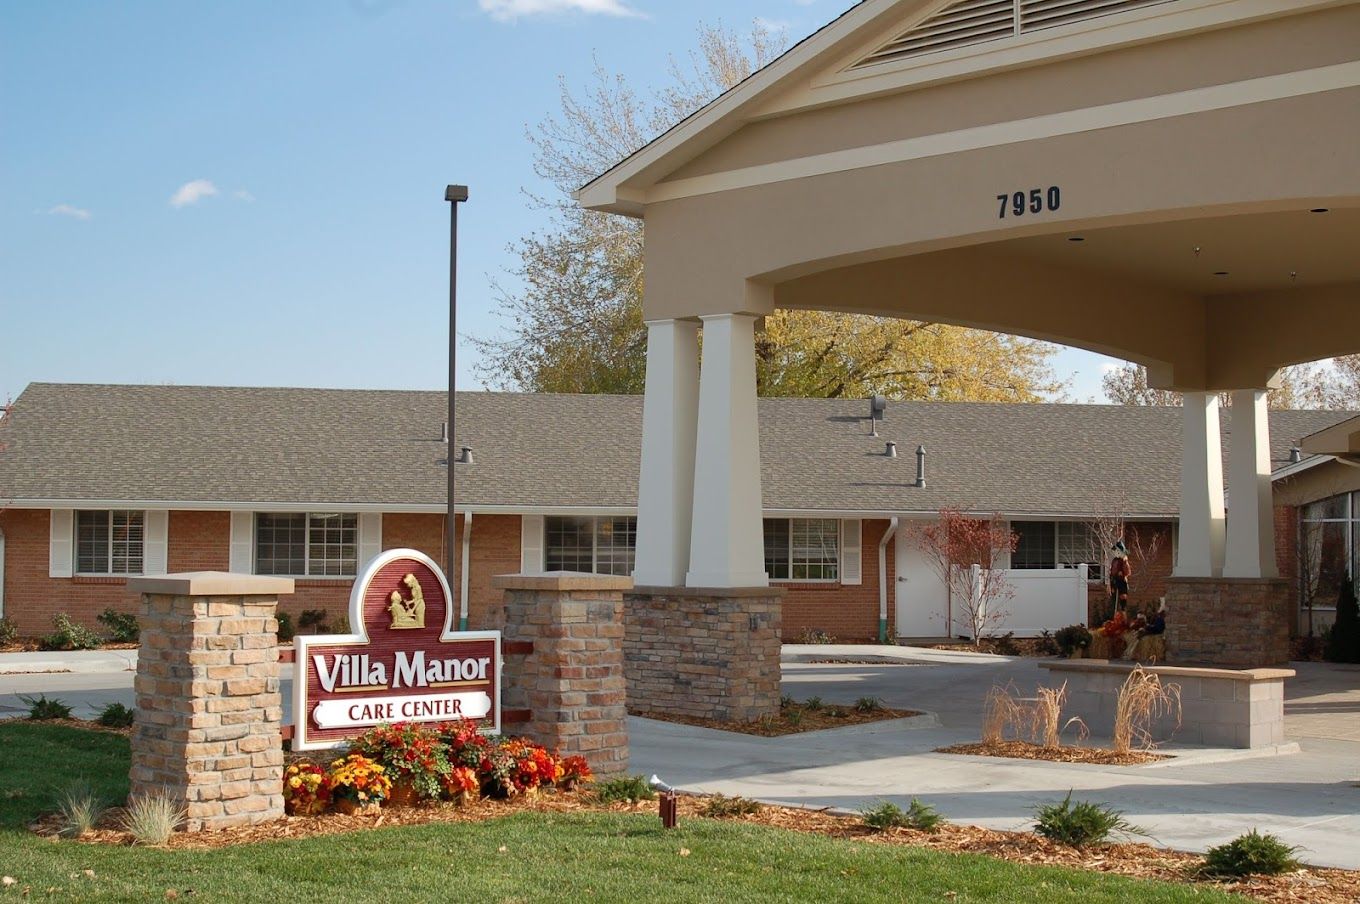
Villa Manor Care Center is an assisted living community that has been steadfastly serving the care needs of the Lakewood, Colorado, community. Over the years, Villa Manor Care Center has become an integral part of the community, dedicated to providing exceptional care and support to its residents. Their focus lies on delivering exceptional inpatient and outpatient rehabilitation services, complemented by 24/7 skilled nursing care. The center’s collaborative team approach fosters meaningful connections between dedicated nurses, therapists, and residents. To further elevate the rehabilitation experience, state-of-the-art rehab equipment, such as the AlterG® Anti-Gravity Treadmill®, is employed, ensuring residents receive top-notch care and support. 
Moreover, the presence of an on-site physician streamlines patient and resident care, ensuring faster and more convenient access to medical services. The dedicated associates at Villa Manor Care Center are committed to providing compassionate care and unparalleled service, exemplifying their dedication to each individual’s well-being and comfort. Situated within a convenient 6-mile radius of area hospitals, the center’s strategic location enhances accessibility for individuals seeking short-term rehabilitation, long-term care, or post-operative recovery. Furthermore, its close proximity to Lakewood Commons and Belmar Shopping Center offers added convenience and accessibility for residents and their families.

Quality ratings

Measured by Centers for Medicare & Medicaid Services (CMS)

Overall rating Info The Overall CMS Rating combines results from health inspections, staffing levels and quality measures. Health inspections carry the most weight. Staffing and quality scores can increase or decrease the final rating based on performance compared to state and national standards.
▲ 27.2% Above CO avg. ▲ 27.2% Above CO avg.CO average: 3.1Click the badge to see the full State ranking.Click here to see the full State ranking.
Health Inspection Info Based on the results of the facility's three most recent standard inspections and any complaint investigations. CMS reviews the number, scope, and severity of deficiencies, with more recent findings weighted more heavily.
▲ 8.3% Above CO avg. ▲ 8.3% Above CO avg.CO average: 2.8Click the badge to see the full State ranking.Click here to see the full State ranking.
Staffing Info Measures average nursing staff hours per resident per day, including Registered Nurses (RNs) and total nursing staff. Ratings are adjusted based on the level of care residents require and are compared to state and national benchmarks.
▲ 31.6% Above CO avg. ▲ 31.6% Above CO avg.CO average: 3.0Click the badge to see the full State ranking.Click here to see the full State ranking.
Quality Measures Info Based on clinical and physical health indicators reported to CMS, such as hospital readmissions, falls, pressure ulcers, and improvements in mobility. These measures reflect how well residents' health needs are being managed.
▲ 20.5% Above CO avg. ▲ 20.5% Above CO avg.CO average: 4.1Click the badge to see the full State ranking.Click here to see the full State ranking.

Staffing hours breakdown

Info Daily nursing hours per resident by staff type, reported to CMS. Higher is generally better — compare this facility to state and national averages to see where staffing stands.

Hours per resident per day — compared to Colorado state averages

Total nursing care / resident Info This home is ranked 80th out of 215 homes in Colorado for nurse hours. Total adjusted nursing hours per resident per day, combining RN, LPN, and aide time. CMS adjusts this for case-mix so facilities can be fairly compared.
3h 54m per day
Rank #80 / 215Nurse hours — State benchmarkedThis home is ranked 80th out of 215 homes in Colorado. Shows adjusted nurse hours per resident per day benchmarked to the Colorado average, with a ranking across 215 Colorado facilities. More hours mean more direct care. The national average is about 3.5 hrs; below 3.0 is a red flag.Rankings are based only on facilities in Colorado that report data for that category. Facilities without available data are excluded from the ranking.Click the rank badge to see the full State ranking.Click here to see the full State ranking.
This facility Colorado avg (3h 52m per day)
vs Colorado avg
+1%

0 of 6 metrics below state avg

Standout metric Weekend RN is +62% above state avg
Staff typeHours / Day / Residentvs state avg
Registered Nurse (RN) Info RNs hold the highest nursing license and can assess residents, interpret test results, and direct care plans. More RN hours per day often signals stronger clinical oversight and faster response to health changes. 1h 5m per day ▲ 33% State avg: 49m per day · National avg: 41m per day
LPN / LVN Info Licensed Practical Nurses (LPNs) or Licensed Vocational Nurses (LVNs) deliver routine hands-on care — medication administration, wound dressing, and monitoring vital signs. They work under RN supervision and make up a large share of daily bedside care. 55m per day ▲ 32% State avg: 41m per day · National avg: 52m per day
Nurse Aide Info Certified Nurse Aides (CNAs) provide the most direct day-to-day assistance: bathing, dressing, feeding, and mobility. Nurse aide hours are typically the largest staffing category and directly affect residents' quality of life. 2h 18m per day ▲ 6% State avg: 2h 11m per day · National avg: 2h 20m per day
Weekend Total Nursing Info Combined nursing hours (RN + LPN + Nurse Aide) per resident per day on weekends. Staffing often drops on weekends — this figure reveals whether the facility maintains adequate coverage outside of weekday hours. 3h 56m per day ▲ 20% State avg: 3h 16m per day · National avg: 3h 27m per day
Physical Therapist Info Hours per resident per day provided by licensed Physical Therapists (PTs) or PT Assistants. PT services help residents recover mobility after injury or illness and are especially important for post-acute (short-stay) rehabilitation. 6m per day ▲ 16% State avg: 5m per day · National avg: 4m per day
Weekend RN Info Registered nurse hours specifically on weekends. Facilities sometimes reduce RN presence on Saturdays and Sundays — a low weekend RN figure compared to weekday hours can indicate reduced clinical oversight when most administrative staff are absent. 58m per day ▲ 62% State avg: 36m per day · National avg: 29m per day

Capacity and availability

This home usually has availability

Lower occupancy than the Colorado average: 76.5%
Occupancy rate
71.5% Rank #141 / 221Occupancy rate — State benchmarkedThis home is ranked 141st out of 221 homes in Colorado. Shows this facility's occupancy rate versus the Colorado average, with its Statewide rank out of 221. Higher occupancy signals strong local demand and financial stability.Rankings are based only on facilities in Colorado that report data for that category. Facilities without available data are excluded from the ranking.Click the rank badge to see the full State ranking.Click here to see the full State ranking.
Avg. Length of Stay
58 days
Bed community size
110-bed community Rank #108 / 533Bed count — State benchmarkedThis home is ranked 108th out of 533 homes in Colorado. Shows this facility's certified or reported bed count compared to other Colorado facilities. Larger communities may offer more amenities, programs, and on-site services for residents and families.Rankings are based only on facilities in Colorado that report data for that category. Facilities without available data are excluded from the ranking.Click the rank badge to see the full State ranking.Click here to see the full State ranking.
A larger shared setting that may offer more common spaces and organized community services.
Walk Score
Walk Score: 70 / 100 Rank #227 / 872Walk Score — State benchmarkedThis home is ranked 227th out of 872 homes in Colorado. Shows how walkable this facility's neighborhood is compared to the average Walk Score across Colorado facilities. Higher scores benefit residents, families, and staff.Rankings are based only on facilities in Colorado that report data for that category. Facilities without available data are excluded from the ranking.Click the rank badge to see the full State ranking.Click here to see the full State ranking.
Very walkable. Most errands can be accomplished on foot, and many essentials are within a short walk.

About this community

Awards

Best Nursing Home
U.S. News & World Report 2026

Therapy & Rehabilitation

2 services
Rehabilitation Services
Short-Term Rehab

Amenities & Lifestyle

State-Of-The-Art Rehab Equipment Such As The Alterg® Anti-Gravity Treadmill®
Religious Services

Contact Villa Manor Care Center

Staffing Data

Reporting period: October 1 – December 31, 2025 (Q4 2025). Source: CMS Payroll-Based Journal report.

Total staff 121
Employees 117
Contractors 4
Staff to resident ratio 1.44 : 1
23% fewer staff per resident than Colorado average
Colorado average ratio: 1.88 : 1 Colorado average ratio: 1.88 : 1See full Colorado ranking
Avg staff/day 48
Average shift 8.4 hours
0% compared with Colorado average
Colorado average: 8.3 hours Colorado average shift: 8.3 hoursSee full Colorado ranking
Total staff hours (quarter) 36,901

Nursing staff breakdown

Q4 2025 · Oct 1 – Dec 31 More info This data comes from the CMS Payroll-Based Journal report covering October 1 – December 31, 2025.
Registered Nurse

Manages medical care and health needs.

RN Staff Info All 16 RN Staff are full-time employees. No contractors work on this role. 16
Average shift length Info Average shift length. Calculated as total hours divided by days worked and average staff per day. 9.6 hours
Licensed Practical Nurse

Assists with medical care and medications.

LPN Staff Info All 18 LPN Staff are full-time employees. No contractors work on this role. 18
Average shift length Info Average shift length. Calculated as total hours divided by days worked and average staff per day. 9.3 hours
Certified Nursing Assistant

Helps with daily care and mobility.

CNA Staff Info All 52 CNA Staff are full-time employees. No contractors work on this role. 52
Average shift length Info Average shift length. Calculated as total hours divided by days worked and average staff per day. 8.1 hours

Contractor staffing

Q4 2025 · Oct 1 – Dec 31 More info This data comes from the CMS Payroll-Based Journal report covering October 1 – December 31, 2025.

Total hours from contractors

0.2%

75 contractor hours this quarter

Occupational Therapy Assistant: 2 Physical Therapy Assistant: 1 Other Physician: 1

Staff by category

Q4 2025 · Oct 1 – Dec 31 More info This data comes from the CMS Payroll-Based Journal report covering October 1 – December 31, 2025.
Certified Nursing Assistant5205216,63092100%8.1
Registered Nurse160166,09292100%9.6
Licensed Practical Nurse180185,57992100%9.3
Clinical Nurse Specialist4041,3287379%7.9
RN Director of Nursing2021,0127885%8.2
Physical Therapy Assistant4159938087%6
Other Dietary Services Staff2028989199%8
Qualified Social Worker4047426368%7.5
Respiratory Therapy Technician3037208188%6.7
Speech Language Pathologist2025426874%7.7
Administrator1015286672%8
Mental Health Service Worker1014865964%8.2
Nurse Practitioner1014405560%8
Dietitian1014395863%7.6
Occupational Therapy Aide4043595762%6.3
Occupational Therapy Assistant0224167%6.8
Nurse Aide in Training1013155%6.2
Other Physician0112333%7.5
Physical Therapy Aide1012067%3.4
52 Certified Nursing Assistant
% of Days 100%
16 Registered Nurse
% of Days 100%
18 Licensed Practical Nurse
% of Days 100%
4 Clinical Nurse Specialist
% of Days 79%
2 RN Director of Nursing
% of Days 85%
5 Physical Therapy Assistant
% of Days 87%
2 Other Dietary Services Staff
% of Days 99%
4 Qualified Social Worker
% of Days 68%
3 Respiratory Therapy Technician
% of Days 88%
2 Speech Language Pathologist
% of Days 74%
1 Administrator
% of Days 72%
1 Mental Health Service Worker
% of Days 64%
1 Nurse Practitioner
% of Days 60%
1 Dietitian
% of Days 63%
4 Occupational Therapy Aide
% of Days 62%
2 Occupational Therapy Assistant
% of Days 7%
1 Nurse Aide in Training
% of Days 5%
1 Other Physician
% of Days 3%
1 Physical Therapy Aide
% of Days 7%

Penalties and fines

Federal penalties imposed by CMS for regulatory violations, including civil money penalties (fines) and denials of payment for new Medicare/Medicaid admissions.

Source: CMS Penalties Database

No penalties in the past 3 years

No civil money penalties or payment denials were reported in the last 3 years.

Quality of care over time

These measures show how residents usually do over time at this home, based on health outcomes and preventive care.

High-risk clinical events score Info A composite score based on pressure ulcers, falls with injury, weight loss, walking ability decline, and activities of daily living decline. 4.8
47% better than Colorado average

Colorado average: 9.0

Functional decline score Info A composite score based on activities of daily living decline, walking ability decline, and incontinence. 17.3
8% better than Colorado average

Colorado average: 18.8

Long-stay resident measures
Need for Help with Daily Activities Increased Info Percent of long-stay residents whose need for help with daily activities has increased 10.1%
37% better than Colorado average

Colorado average: 16.0%

Walking Ability Worsened Info Percent of long-stay residents whose ability to move independently worsened 10.0%
41% better than Colorado average

Colorado average: 17.0%

Low Risk Residents with Bowel/Bladder Incontinence Info Percent of low risk long-stay residents who lose control of their bowels or bladder 32.0%
38% worse than Colorado average

Colorado average: 23.2%

Falls with Major Injury Info Percent of long-stay residents experiencing one or more falls with major injury 0.5%
86% better than Colorado average

Colorado average: 3.3%

High Risk Residents with Pressure Ulcers Info Percent of long-stay high risk residents with pressure ulcers 0.9%
77% better than Colorado average

Colorado average: 3.9%

Urinary Tract Infection Info Percent of long-stay residents with a urinary tract infection 4.8%
231% worse than Colorado average

Colorado average: 1.4%

Lost Too Much Weight Info Percent of long-stay residents who lose too much weight 2.6%
50% better than Colorado average

Colorado average: 5.2%

Depressive Symptoms Info Percent of long-stay residents who have depressive symptoms 5.4%
25% better than Colorado average

Colorado average: 7.2%

Antipsychotic Use Info Percent of long-stay residents who received an antipsychotic medication 15.9%
16% better than Colorado average

Colorado average: 18.8%

Pneumococcal Vaccine Info Percent of long-stay residents assessed and appropriately given the pneumococcal vaccine 97.2%
In line with Colorado average

Colorado average: 93.3%

Influenza Vaccine Info Percent of long-stay residents assessed and appropriately given the seasonal influenza vaccine 92.9%
In line with Colorado average

Colorado average: 94.7%

Short-stay resident measures
Pneumococcal Vaccine Info Percent of short-stay residents assessed and appropriately given the pneumococcal vaccine 85.8%
12% better than Colorado average

Colorado average: 76.6%

Antipsychotic medication increase Info Percent of short-stay residents who newly received an antipsychotic medication 0.0%
100% better than Colorado average

Colorado average: 1.4%

Influenza Vaccine Info Percent of short-stay residents assessed and appropriately given the seasonal influenza vaccine 83.3%
10% better than Colorado average

Colorado average: 75.6%

Breakdown by payment type

Medicare

27% of new residents, usually for short-term rehab.

Typical stay 1 months

Private pay

63% of new residents, often for short stays.

Typical stay 1 months

Medicaid

10% of new residents, often for long-term daily care.

Typical stay 9 - 10 months

Facility Characteristics

Source: CMS Long-Term Care Facility Characteristics (Data as of Jan 2026)

Total residents 84
Medicare
24
28.6% of residents
Medicaid
60
71.4% of residents
Programs & Services
Residents Group

Residents meet regularly to discuss policies, care quality, and activities

Active Resident Council

Organized group of residents that meets regularly to discuss facility policies, quality of life, and activities.

Finances and operations

Based on CMS SNF Cost Report for fiscal year ending in 12/2023.

For-profit
Corporation
Net patient revenue Info Net patient revenue — what the home actually collects for resident care, after contractual allowances, bad debt and discounts are subtracted from its gross charges (CMS cost report, Worksheet G-3). It covers resident care only; money the home earns from other sources is shown separately as "Other income."
$11.3M
Net patient income Info Net patient income: net patient revenue minus the home's total operating expenses. A positive figure means it earns more from resident care than it spends to deliver it; a negative figure means the opposite. It excludes non-operating "other income."
-$854.7K
For-profit Corporation
Net patient revenue Info Net patient revenue — what the home actually collects for resident care, after contractual allowances, bad debt and discounts are subtracted from its gross charges (CMS cost report, Worksheet G-3). It covers resident care only; money the home earns from other sources is shown separately as "Other income."
$11.3M Rank #76 / 221Revenue — State benchmarkedThis home is ranked 76th out of 221 homes in Colorado. Shows this facility's annual revenue compared to the Colorado average. Higher revenue generally means more resources for staffing and capital — read alongside Payroll %.Rankings are based only on facilities in Colorado that report data for that category. Facilities without available data are excluded from the ranking.Click the rank badge to see the full State ranking.Click here to see the full State ranking.
Net patient income Info Net patient income: net patient revenue minus the home's total operating expenses. A positive figure means it earns more from resident care than it spends to deliver it; a negative figure means the opposite. It excludes non-operating "other income."
-$854.7K
Other income Info Money the home earns outside of resident care — such as investments, grants, rentals and other non-operating sources (CMS cost report, Worksheet G-3). It is tracked separately from net patient revenue: it is not part of that figure, and it is not included in net patient income.
$240.0K
Payroll costs Info Staff salaries plus wage-related costs — benefits such as payroll taxes, health insurance and retirement — from the home's own accounting records (CMS cost report, Worksheet A). Contract or agency labor is counted separately, under other operating costs. Rank #58 / 221Payroll — State benchmarkedThis home is ranked 58th out of 221 homes in Colorado. Shows total annual staff payroll benchmarked to the Colorado average. Higher payroll investment relative to peers often signals better staffing and less reliance on cheaper contract labor.Rankings are based only on facilities in Colorado that report data for that category. Facilities without available data are excluded from the ranking.Click the rank badge to see the full State ranking.Click here to see the full State ranking.
$7.4M 65.4% of net patient revenue Info Payroll as a share of revenue: staff salaries and wage-related benefits divided by net patient revenue. A higher figure means more of each revenue dollar goes to staff pay. Rank #73 / 221Payroll % — State benchmarkedThis home is ranked 73rd out of 221 homes in Colorado. Shows payroll as a percentage of revenue versus the Colorado average. Well-run Colorado facilities typically land around 59–66% — the top third Statewide. Below 25% may signal understaffing or heavy agency use — read with Staffing ratings.Rankings are based only on facilities in Colorado that report data for that category. Facilities without available data are excluded from the ranking.Click the rank badge to see the full State ranking.Click here to see the full State ranking.
Other operating costs Info Everything it costs to run the home apart from payroll — food, utilities, supplies, maintenance, contract labor and administration. Calculated as total operating expense minus payroll (staff salaries and wage-related benefits).
$4.8M
Total costs Info The home's total operating expense for the year — all the costs of running it, salaries included (CMS cost report, Worksheet G-3).
$12.2M

Who this home usually serves

TYPE OF STAY

Primarily short stays

Residents typically stay for brief periods, with frequent admissions and discharges throughout the year.

Most new residents arrive under private pay (63% of admissions), and a typical private pay stay runs around 1 months.

Admissions
494 total

Coverage residents most often arrive under.

Medicare 27%
Private pay 63%
Medicaid 10%
Discharges
498 total

Coverage residents most often leave under.

Medicare 18%
Private pay 72%
Medicaid 10%

Compare Nursing Homes around Lakewood

The information below is reported by the Colorado Department of Public Health and Environment, Health Facilities Division.

2 facilities compared · CMS & CO Dept. of Health data

Villa Manor Care Center
NH
AL
Lakewood
110
Facility 110
CO AVG 76
Rank #108 / 533
71.5%
Facility 71.5%
CO AVG 76.5%
Rank #141 / 221
-7%
3.91
Facility 3.91
CO AVG 3.86
Rank #80 / 215
-6%+1%
$0
Facility $0
CO AVG $39.2k
Rank #1 / 221
27
Facility 27
CO AVG 24.8
Rank #139 / 221
4.5
Facility 4.5
CO AVG 5.2
Rank #89 / 221
-79-
70
Facility 70
CO AVG 51
Rank #227 / 872
Developers Investment Company Inc
$11.3M
Facility $11.3M
CO AVG $11.2M
Rank #76 / 221
$7.4M
Facility $7.4M
CO AVG $4.9M
Rank #58 / 221
65.4%
Facility 65.4%
CO AVG 46.6%
Rank #73 / 221
65092
Cambridge Care Center
NH
AL
Lakewood (South Alameda)
100
Facility 100
CO AVG 76
Rank #161 / 533
29.0%
Facility 29.0%
CO AVG 76.5%
Rank #208 / 221
-62%
3.50
Facility 3.50
CO AVG 3.86
Rank #117 / 215
-5%-9%
$8.2k
Facility $8.2k
CO AVG $39.2k
Rank #98 / 221
16
Facility 16
CO AVG 24.8
Rank #54 / 221
2.7
Facility 2.7
CO AVG 5.2
Rank #24 / 221
129A+
85
Facility 85
CO AVG 51
Rank #56 / 872
Pamela Smith
$9.3M
Facility $9.3M
CO AVG $11.2M
Rank #120 / 221
$5.3M
Facility $5.3M
CO AVG $4.9M
Rank #114 / 221
57.3%
Facility 57.3%
CO AVG 46.6%
Rank #120 / 221
65296

Financial Assistance for
Nursing Home in Colorado

Villa Manor Care Center is located in Lakewood, Colorado.
Here are the financial assistance programs available to residents in Colorado.

Get Financial aid guidance

Elderly, Blind, and Disabled Waiver

Colorado Medicaid EBD Waiver

Age 65+ or disabled
General Colorado resident, Medicaid- eligible, nursing home-level care need.
Income Limits (2025) ~$2,829/month 300% FBR, individual
Asset Limits $2,000 (individual), $3,000 (couple).
CO

Requires level-of-care assessment by case manager.

Benefits
Personal care (5-7 hours/day) Respite care (up to 240 hours/year) Adult day care ($65/day) Home modifications ($1,500 avg.)

Old Age Pension (OAP) Health Care Program

Colorado OAP

Age 60+
General Colorado resident.
Income Limits ~$1,215/month individual
Asset Limits $2,000 individual
CO

Supplements SSI; limited medical coverage.

Benefits
Cash (~$100-$800/month) Limited in-home care (2-3 hours/week) Medical assistance

Program of All-Inclusive Care for the Elderly (PACE)

Colorado Medicaid PACE

Age 55+
General Colorado resident, nursing home-level care need, safe with PACE support.
Income Limits (2025) ~$2,829/month 300% FBR
Asset Limits $2,000 (individual), $3,000 (couple).
CO

Limited to specific regions (e.g., Denver, Pueblo).

Benefits
All-inclusive care—personal care (5-7 hours/day) Meals Transportation Therapy Medical visits

Home Care Allowance (HCA)

Colorado Home Care Allowance (HCA)

Age
General Seniors typically 65+, Age 5+ with disability, Colorado resident, financial/functional need.
Income Limits (2025) ~$1,004/month individual, stricter than waivers
Asset Limits $2,000 (individual), $3,000 (couple).
CO

Must need help with ADLs; not Medicaid-waiver eligible.

Benefits
Personal care (~4-6 hours/day, paid to provider) E.g. Bathing Dressing

Frequently Asked Questions about Villa Manor Care Center

Is Villa Manor Care Center in a walkable area?

Villa Manor Care Center has a walk score of 70. Very walkable. Most errands can be accomplished on foot, and many essentials are within a short walk.

What is the occupancy rate at Villa Manor Care Center?

Villa Manor Care Center's occupancy is 71.5%.

Does Villa Manor Care Center operate as a for-profit or non-profit?

Villa Manor Care Center is registered as a for-profit.

Are there photos of Villa Manor Care Center?

Yes — there are 7 photos of Villa Manor Care Center in the photo gallery on this page.

What is the phone number of Villa Manor Care Center?

(303) 986-4511 will put you in contact with the team at Villa Manor Care Center.

Is Villa Manor Care Center Medicare or Medicaid certified?

Yes — Villa Manor Care Center is a CMS-certified provider of Medicare and Medicaid.

Guides for Better Senior Living

Care Cost Calculator: See Prices in Your Area

Nursing Home Data Explorer

Don’t Wait Too Long: 7 Red Flag Signs Your Parent Needs Assisted Living Now

The True Cost of Assisted Living in 2025 – And How Families Are Paying For It

Understanding Senior Living Costs: Pricing Models, Discounts & Financial Assistance