Explore Open Rooms

1 Contact details
2 What type of senior care service are you looking for?
3 What budget do you have in mind for senior care?
4 How soon do you need to find care?
5 Additional details

Thank you for your interest!

Our team will be in touch shortly to help with next steps.

Assisted Living Home

Village Green of Bristol Rehabilitation and Health Center

Assisted Living Home

Village Green of Bristol Rehabilitation and Health Center

23 Fair St, Bristol, CT 06010 View map
Overview of Village Green of Bristol Rehabilitation and Health Center

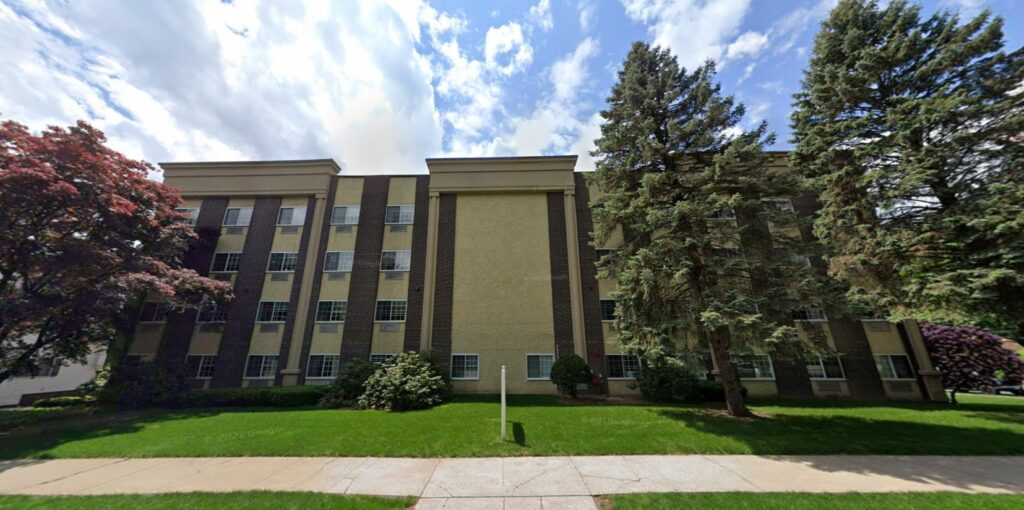
With a commitment to personalized care and holistic well-being, the Village Green of Bristol Rehabilitation and Health Center offers services intended to keep the residents comfortable and satisfied. Village Green ensures that every individual receives the highest level of support and attention from its trained staff.

The facility is built with social activities designed to enhance quality of life for their residents during. In addition to this, the facility is also meticulously designed when it comes to the medical needs of their residents. The goal of Village Green is to enhance the living experience of its residents, making sure that not only are their needs met, but they are also happy with their life.

(860) 589-2923

Quality ratings

Measured by Centers for Medicare & Medicaid Services (CMS)

Overall rating Info The Overall CMS Rating combines results from health inspections, staffing levels and quality measures. Health inspections carry the most weight. Staffing and quality scores can increase or decrease the final rating based on performance compared to state and national standards.
2/5
Connecticut average: 3.4/5
Health Inspection Info Based on the results of the facility's three most recent standard inspections and any complaint investigations. CMS reviews the number, scope, and severity of deficiencies, with more recent findings weighted more heavily.
2/5
Connecticut average: 3.1/5
Staffing Info Measures average nursing staff hours per resident per day, including Registered Nurses (RNs) and total nursing staff. Ratings are adjusted based on the level of care residents require and are compared to state and national benchmarks.
3/5
Connecticut average: 3.4/5
Quality Measures Info Based on clinical and physical health indicators reported to CMS, such as hospital readmissions, falls, pressure ulcers, and improvements in mobility. These measures reflect how well residents' health needs are being managed.
2/5
Connecticut average: 3.6/5

Nursing care per resident

Info This shows how many total hours of nursing staff time are available per resident each day. Higher numbers usually mean more staff support.
3h 19m per day

This home provides 18% less nursing time per resident than the Connecticut average.

Connecticut average: 4h 4m per day

Capacity and availability

Smaller home

May offer a more intimate, personalized care environment.

Total beds 95

This home usually has availability

Lower occupancy suggests more openings may be available.

Lower demand than the Connecticut average
Occupancy rate 80%
Residents per day (avg) 75
Occupancy rate
80%
Residents per day (avg)
75

Who this home usually serves

TYPE OF STAY

Mostly long-term care residents

Most residents stay for extended periods and receive ongoing daily care.

Might be optimal for
Long-term daily care Ongoing support needs

Breakdown by payment type

Medicare

6% of new residents, usually for short-term rehab.

Typical stay 8 - 9 months

Private pay

63% of new residents, often for short stays.

Typical stay 2 - 3 months

Medicaid

31% of new residents, often for long-term daily care.

Typical stay 1 years

Finances and operations

Privately-owned community
Operated by a business corporation.
Home revenue
$22.4M
Operating loss
-$223.4K
Privately-owned community Operated by a business corporation.
Home revenue
$22,424,213.00
Operating loss
$-223,405.00
Payroll costs Info The portion of the home's budget spent on staff, including nurses, caregivers, and other employees who support care and operations.
$5.1M
22.7% of revenue
Other operating costs Info All remaining costs needed to run the home, such as food, utilities, building maintenance, supplies and administrative expenses.
$17.6M
Total costs $22.6M
Years in operation
1 year in operation
A newer community that may feature more recent facilities and programs.
Walk Score
Walk Score: 44 / 100
Somewhat walkable. A few nearby services may be reachable on foot, but most trips require transportation.

About this community

Occupancy

Occupancy rate
80%
In line with Connecticut average
Occupied beds
76 / 95
Average residents 102 per day

License details

Facility type
Chronic & Convalescent Nursing Home
Status Active
Issuance February 27, 2025
Expiration December 31, 2026

Additional licensing details

License number: 2511

Staffing

Key information about the people who lead and staff this community.

Staff Composition (State Data)

Admin 3 FTE

What does this home offer?

Pets allowed icon
Pets allowed icon

Pets Allowed: Yes, Pets Allowed

Housing options icon

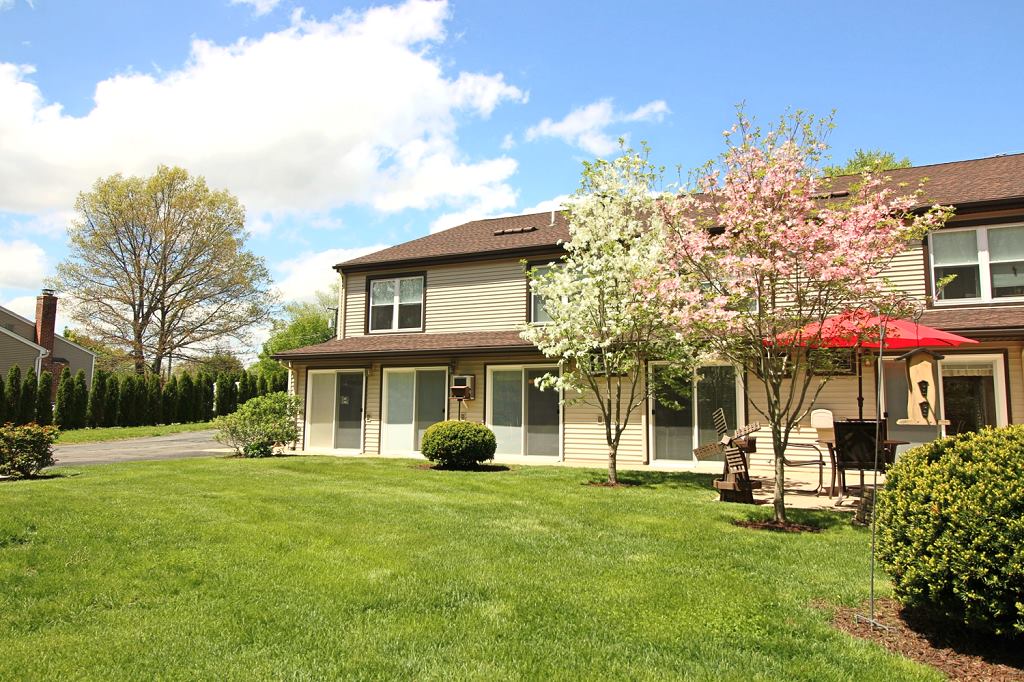
Housing Options: Private Rooms

Transportation services icon

Transportation Services

Fitness and recreation icon

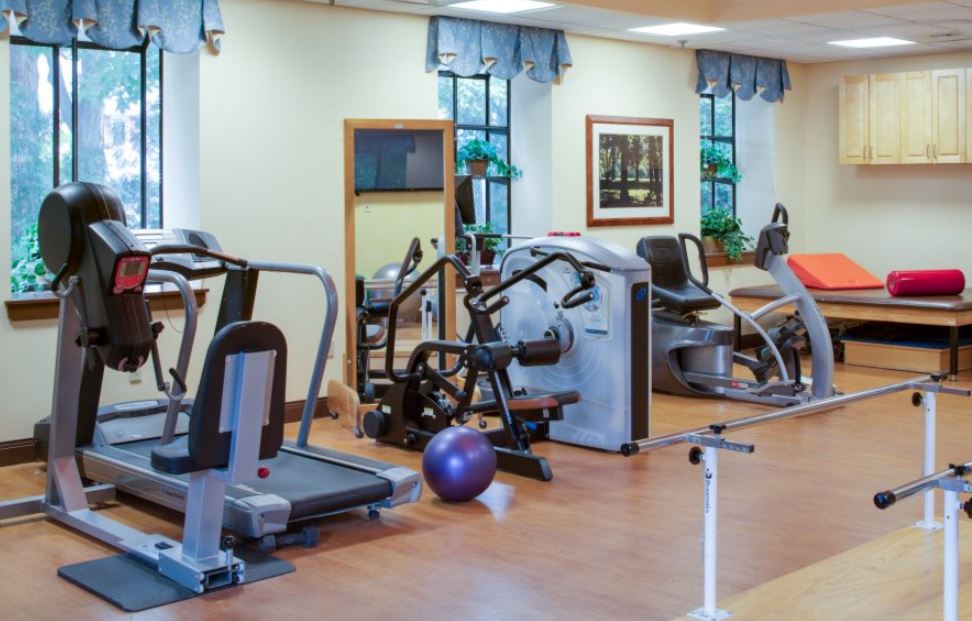
Fitness and Recreation

Types of Care at Village Green of Bristol Rehabilitation and Health Center

Assisted Living Nursing Home Memory Care Hospice Care
Contact Village Green of Bristol Rehabilitation and Health Center

Inspection History

In Connecticut, the Department of Public Health, Facility Licensing and Investigations Section conducts mandatory inspections and unannounced surveys to monitor the quality of care in long-term facilities.

2 visits/inspections

2 routine inspections

Connecticut average: 13 visits/inspections

Latest inspection

Date:May 8, 2025

Inspection history

05-08-2025 Inspection Report

Inspection Report Summary for Village Green of Bristol Rehabilitation and Health Center

The most recent inspection on May 8, 2025, found that all previously identified violations had been corrected. Earlier inspections in March 2025 confirmed no current deficiencies, following a period of initial licensing and regulatory setup in February 2025. Prior issues involved compliance with licensing requirements and operational standards, which were addressed through a Plan of Correction. No complaint investigations were noted during this time, and enforcement actions such as fines or license suspensions were not listed in the available reports. The inspection history shows improvement, with the facility resolving earlier deficiencies and maintaining compliance in recent visits.

Health Inspection History

Inspections
Total health inspections 8

Connecticut average 5.7


Last Health inspection on Mar 2025

Total health citations 37

Connecticut average 32

Citations per inspection
4.62

Connecticut average 5.82


Health citations are formal notices following inspections when they fail to comply with safety and care standards.

26 of 37 citations resulted from standard inspections; 9 of 37 resulted from complaint investigations; and 2 of 37 came from combined inspections (standard and complaint).

Breakdown of citation severity (last 3 years)
Critical Health citations More info 0
100% better than Connecticut average

Connecticut average: 0.3


Serious Health citations More info 1
43% worse than Connecticut average

Connecticut average: 0.7

0 critical citations More info Connecticut average: 0.3

1 serious citation More info Connecticut average: 0.7

32 moderate citations More info Connecticut average: 28.8

4 minor citations More info Connecticut average: 2.3
Citations history (last 3 years)
Environmental moderate citation Info Issues related to building safety, cleanliness, maintenance, and overall living conditions. Mar 12, 2025
Corrected

Environmental moderate citation Info Issues related to building safety, cleanliness, maintenance, and overall living conditions. Mar 12, 2025
Corrected

Infection Control moderate citation Info Issues related to preventing and controlling infections, including hygiene practices and safety protocols. Mar 12, 2025
Corrected

Nursing Services moderate citation Info Issues related to the availability and quality of nursing staff and the care they provide. Mar 12, 2025
Corrected

Compare Assisted Living around Bristol The information below is reported by the Connecticut Department of Public Health, Facility Licensing and Investigations Section.

The Pines at Bristol Center for Health and Rehabilitation
AL

Assisted Living A licensed, long-term care setting for seniors or individuals with disabilities who need help with daily activities — like bathing, dressing, and medication management — but not 24-hour skilled nursing. Offers housing, meals, and around-the-clock support while aiming to maximize resident independence.

HC

Home Care Professional care delivered in the person's own home — from companionship and errands to skilled nursing and therapy. Allows seniors to age in place. Medicare covers skilled home health when medically necessary.

MC

Memory Care Secured, specialized care for people living with Alzheimer's or dementia. Staff trained in cognitive impairment, with higher staff-to-resident ratios and an environment designed to reduce confusion and wandering risk.

NH

Nursing Home Licensed facility providing 24/7 skilled nursing care for residents with complex, ongoing medical needs. Staffed by RNs, LPNs, and CNAs. Inspected and star-rated annually by CMS. Accepts Medicare (short-term rehab) and Medicaid (long-term care).

Bristol (Federal Hill)
132
Yes
-
68
Private Rooms
Village Green of Bristol Rehabilitation and Health Center
AL

Assisted Living A licensed, long-term care setting for seniors or individuals with disabilities who need help with daily activities — like bathing, dressing, and medication management — but not 24-hour skilled nursing. Offers housing, meals, and around-the-clock support while aiming to maximize resident independence.

HC

Home Care Professional care delivered in the person's own home — from companionship and errands to skilled nursing and therapy. Allows seniors to age in place. Medicare covers skilled home health when medically necessary.

MC

Memory Care Secured, specialized care for people living with Alzheimer's or dementia. Staff trained in cognitive impairment, with higher staff-to-resident ratios and an environment designed to reduce confusion and wandering risk.

NH

Nursing Home Licensed facility providing 24/7 skilled nursing care for residents with complex, ongoing medical needs. Staffed by RNs, LPNs, and CNAs. Inspected and star-rated annually by CMS. Accepts Medicare (short-term rehab) and Medicaid (long-term care).

Bristol (Forestville)
95
Yes
-
44
Private Rooms
Countryside Manor of Bristol
AL

Assisted Living A licensed, long-term care setting for seniors or individuals with disabilities who need help with daily activities — like bathing, dressing, and medication management — but not 24-hour skilled nursing. Offers housing, meals, and around-the-clock support while aiming to maximize resident independence.

HC

Home Care Professional care delivered in the person's own home — from companionship and errands to skilled nursing and therapy. Allows seniors to age in place. Medicare covers skilled home health when medically necessary.

HC

Home Care Professional care delivered in the person's own home — from companionship and errands to skilled nursing and therapy. Allows seniors to age in place. Medicare covers skilled home health when medically necessary.

NH

Nursing Home Licensed facility providing 24/7 skilled nursing care for residents with complex, ongoing medical needs. Staffed by RNs, LPNs, and CNAs. Inspected and star-rated annually by CMS. Accepts Medicare (short-term rehab) and Medicaid (long-term care).

Bristol
90
Yes
A+
13
Private Rooms
KindCare Assisted Living at Bristol
AL

Assisted Living A licensed, long-term care setting for seniors or individuals with disabilities who need help with daily activities — like bathing, dressing, and medication management — but not 24-hour skilled nursing. Offers housing, meals, and around-the-clock support while aiming to maximize resident independence.

MC

Memory Care Secured, specialized care for people living with Alzheimer's or dementia. Staff trained in cognitive impairment, with higher staff-to-resident ratios and an environment designed to reduce confusion and wandering risk.

Bristol
-
No
-
75
Suite
Shady Oaks Assisted Living
AL

Assisted Living A licensed, long-term care setting for seniors or individuals with disabilities who need help with daily activities — like bathing, dressing, and medication management — but not 24-hour skilled nursing. Offers housing, meals, and around-the-clock support while aiming to maximize resident independence.

NH

Nursing Home Licensed facility providing 24/7 skilled nursing care for residents with complex, ongoing medical needs. Staffed by RNs, LPNs, and CNAs. Inspected and star-rated annually by CMS. Accepts Medicare (short-term rehab) and Medicaid (long-term care).

Bristol
-
Yes
A+
15
Private Rooms

Places of interest near Village Green of Bristol Rehabilitation and Health Center

Address 3.2 miles from city center — 5.1 miles to nearest hospital (Hospital for Special Care)
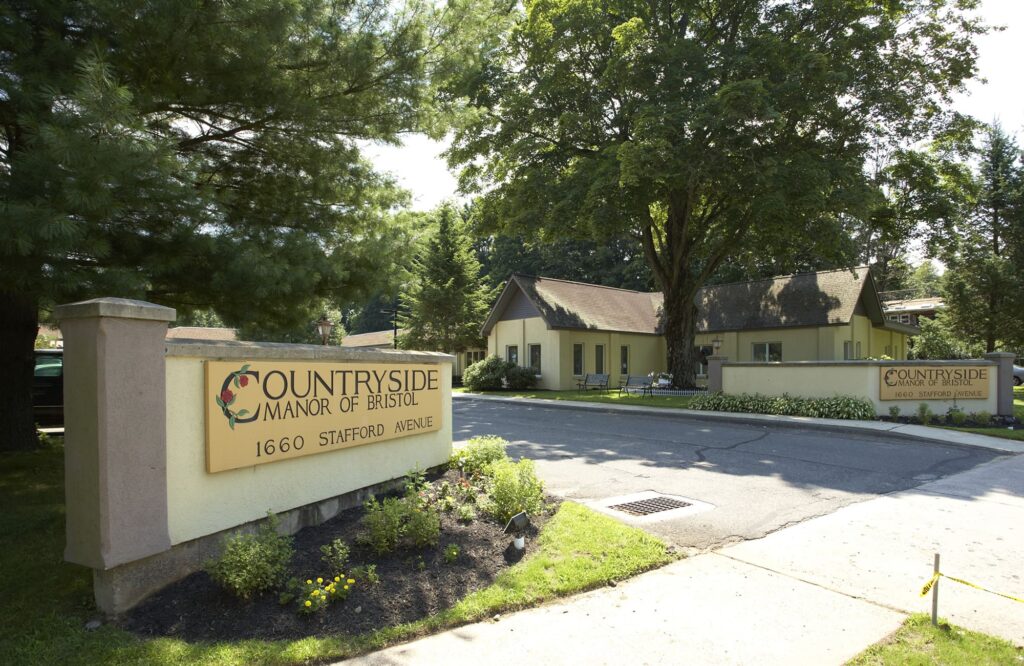
Address 23 Fair St, Bristol, CT 06010

Calculate Travel Distance to Village Green of Bristol Rehabilitation and Health Center

Add your location

Address

Staffing Data (Q2 2025)

This data corresponds to Q2 2025 and is based on CMS Payroll-Based Journal.

Total staff 171
Employees 128
Contractors 43
Staff to resident ratio 2.38:1
26% better than Connecticut average

Connecticut average ratio: 1.88:1

Avg staff/day 49
Average shift 7.2 hours
0% compared with Connecticut average

Connecticut average: 7.5 hours

Total staff hours (quarter) 31,995
Nursing staff breakdown
Registered Nurse

Manages medical care and health needs.

Total count 16
Average shift length Info Average shift length. Calculated as total hours divided by days worked and average staff per day. 7.9 hours

No contractors work on this role.

Licensed Practical Nurse

Assists with medical care and medications.

Total count 50
Average shift length Info Average shift length. Calculated as total hours divided by days worked and average staff per day. 7.4 hours

This role is partially covered by contractors.

Certified Nursing Assistant

Helps with daily care and mobility.

Total count 80
Average shift length Info Average shift length. Calculated as total hours divided by days worked and average staff per day. 7 hours

This role is partially covered by contractors.

Contractor staffing

Total hours from contractors

1.9%

623 contractor hours this quarter

Certified Nursing Assistant: 22 Licensed Practical Nurse: 18 Occupational Therapy Assistant: 1 Occupational Therapy Aide: 1 Medical Director: 1
Staff by category
Certified Nursing Assistant58228014,01991100%7
Licensed Practical Nurse3218506,90491100%7.4
Registered Nurse160164,21991100%7.9
RN Director of Nursing3031,2797380%7.6
Clinical Nurse Specialist2029096571%7.4
Physical Therapy Aide2027207481%6.1
Physical Therapy Assistant3035497380%7.2
Speech Language Pathologist2025257279%6.9
Other Social Services Staff1014925864%8.5
Other Dietary Services Staff1014606066%7.7
Nurse Practitioner1014435965%7.5
Administrator2024355763%7.5
Mental Health Service Worker1014355864%7.5
Dental Services Staff1012895459%5.3
Respiratory Therapy Technician2021553033%5.2
Occupational Therapy Aide0111202527%4.8
Occupational Therapy Assistant0112333%7.5
Medical Director01118910%2
Qualified Social Worker101411%3.8
80 Certified Nursing Assistant
% of Days 100%
50 Licensed Practical Nurse
% of Days 100%
16 Registered Nurse
% of Days 100%
3 RN Director of Nursing
% of Days 80%
2 Clinical Nurse Specialist
% of Days 71%
2 Physical Therapy Aide
% of Days 81%
3 Physical Therapy Assistant
% of Days 80%
2 Speech Language Pathologist
% of Days 79%
1 Other Social Services Staff
% of Days 64%
1 Other Dietary Services Staff
% of Days 66%
1 Nurse Practitioner
% of Days 65%
2 Administrator
% of Days 63%
1 Mental Health Service Worker
% of Days 64%
1 Dental Services Staff
% of Days 59%
2 Respiratory Therapy Technician
% of Days 33%
1 Occupational Therapy Aide
% of Days 27%
1 Occupational Therapy Assistant
% of Days 3%
1 Medical Director
% of Days 10%
1 Qualified Social Worker
% of Days 1%

Facility Characteristics

Source: CMS Long-Term Care Facility Characteristics (Data as of Jan 2026)

Total census
72 residents
Residents by payment source
Medicare
9 residents (12.5%)
Medicaid
47 residents (65.3%)
Private pay or other
16 residents (22.2%)
Programs & Services
Residents' Group

Residents meet regularly to discuss policies, care quality, and activities

Active Resident Council

Organized group of residents that meets regularly to discuss facility policies, quality of life, and activities.

Quality of care over time

These measures show how residents usually do over time at this home, based on health outcomes and preventive care.

High-risk clinical events score Info A composite score based on pressure ulcers, falls with injury, weight loss, walking ability decline, and activities of daily living decline. 12.7
22% worse than Connecticut average

Connecticut average: 10.4

Functional decline score Info A composite score based on activities of daily living decline, walking ability decline, and incontinence. 24.4
16% worse than Connecticut average

Connecticut average: 21.1

Long-stay resident measures
Need for Help with Daily Activities Increased Info Percent of long-stay residents whose need for help with daily activities has increased 22.8%
21% worse than Connecticut average

Connecticut average: 18.9%

Walking Ability Worsened Info Percent of long-stay residents whose ability to move independently worsened 21.0%
10% worse than Connecticut average

Connecticut average: 19.2%

Low Risk Residents with Bowel/Bladder Incontinence Info Percent of low risk long-stay residents who lose control of their bowels or bladder 29.5%
18% worse than Connecticut average

Connecticut average: 24.9%

Falls with Major Injury Info Percent of long-stay residents experiencing one or more falls with major injury 1.4%
59% better than Connecticut average

Connecticut average: 3.5%

High Risk Residents with Pressure Ulcers Info Percent of long-stay high risk residents with pressure ulcers 13.4%
193% worse than Connecticut average

Connecticut average: 4.6%

Urinary Tract Infection Info Percent of long-stay residents with a urinary tract infection 1.1%
35% better than Connecticut average

Connecticut average: 1.7%

Lost Too Much Weight Info Percent of long-stay residents who lose too much weight 4.9%
21% better than Connecticut average

Connecticut average: 6.3%

Depressive Symptoms Info Percent of long-stay residents who have depressive symptoms 3.9%
74% better than Connecticut average

Connecticut average: 15.2%

Antipsychotic Use Info Percent of long-stay residents who received an antipsychotic medication 17.0%
In line with Connecticut average

Connecticut average: 17.2%

Pneumococcal Vaccine Info Percent of long-stay residents assessed and appropriately given the pneumococcal vaccine 66.4%
24% worse than Connecticut average

Connecticut average: 87.5%

Influenza Vaccine Info Percent of long-stay residents assessed and appropriately given the seasonal influenza vaccine 84.3%
10% worse than Connecticut average

Connecticut average: 93.5%

Short-stay resident measures
Pneumococcal Vaccine Info Percent of short-stay residents assessed and appropriately given the pneumococcal vaccine 27.4%
61% worse than Connecticut average

Connecticut average: 70.1%

Antipsychotic medication increase Info Percent of short-stay residents who newly received an antipsychotic medication 2.5%
64% worse than Connecticut average

Connecticut average: 1.5%

Influenza Vaccine Info Percent of short-stay residents assessed and appropriately given the seasonal influenza vaccine 21.8%
69% worse than Connecticut average

Connecticut average: 69.8%

Penalties and fines

Federal penalties imposed by CMS for regulatory violations, including civil money penalties (fines) and denials of payment for new Medicare/Medicaid admissions.

Source: CMS Penalties Database (Data as of Jan 2026)

Total fines amount $22K
49% lower than Connecticut average

Connecticut average: $44K

Number of fines 2
15% more fines than Connecticut average

Connecticut average: 1.7

Payment Denials Info Serious action where Medicare and/or Medicaid temporarily stops payments for new residents until issues are fixed. 0
100% fewer payment denials than Connecticut average

Connecticut average: 0.1

Fines amount comparison
This facility $22K
Connecticut average $44K
Penalty History

Penalties are imposed by CMS for violations of federal nursing home regulations.

Civil Money Penalty Info Fines imposed for noncompliance, which can be assessed per day or per instance of violation. Mar 7, 2025
$14K
Civil Money Penalty Info Fines imposed for noncompliance, which can be assessed per day or per instance of violation. Jul 8, 2024
$8K

Last updated: Jan 2026

Guides for Better Senior Living

Care Cost Calculator: See Prices in Your Area

Nursing Home Data Explorer

Don’t Wait Too Long: 7 Red Flag Signs Your Parent Needs Assisted Living Now

The True Cost of Assisted Living in 2025 – And How Families Are Paying For It

Understanding Senior Living Costs: Pricing Models, Discounts & Financial Assistance

Financial Aid for Connecticut Seniors

Get financial aid guidance

Connecticut Home Care Program for Elders

CHCPE

Age 65+, Connecticut resident, at risk of nursing home placement.

State-funded: ~$1,600/month; Medicaid: ~$2,829/month (300% FBR).

$1,600 (state), $2,000 (Medicaid, individual).

Two tiers (state and Medicaid); waitlists possible.

Statewide Respite Care Program

CT Respite Care

Caregiver of senior with dementia, Connecticut resident.

~$2,500/month (individual, varies).

$40,000 (individual).

Limited to dementia caregivers; capped funding.

Congregate Housing Services Program (CHSP)

Connecticut Congregate Housing Services Program

Age 62+, Connecticut resident, frail but not needing 24/7 care, resides in CHSP-eligible housing.

~$41,000/year (individual, adjusted annually).

Not specified; focus is income-based.

Limited to 14 state-subsidized sites; participants pay 10% of service costs.

Medicare Savings Program (MSP)

Connecticut Medicare Savings Program

Age 65+ or disabled, Connecticut resident, enrolled in Medicare Part A/B.

~$2,510/month (individual, QMB); ~$3,380/month (SLMB); ~$3,598/month (ALMB)—adjusted annually.

None since 2023 policy change.

Three tiers (Qualified Medicare Beneficiary, Specified Low-Income, Additional Low-Income); no asset test.

Senior Community Service Employment Program (SCSEP)

Connecticut SCSEP (federally funded, state-administered)

Age 55+, unemployed, low-income, Connecticut resident.

~$1,983/month (125% FPL, individual).

Not specified; income-focused.

Priority for veterans, rural residents; limited slots (~500/year).