


Village Manor
Nursing Home, Assisted Living, Independent Living, Memory Care & Skilled Nursing · Bowling Green, KY


Village Manor
Nursing Home, Assisted Living, Independent Living, Memory Care & Skilled Nursing · Bowling Green, KY
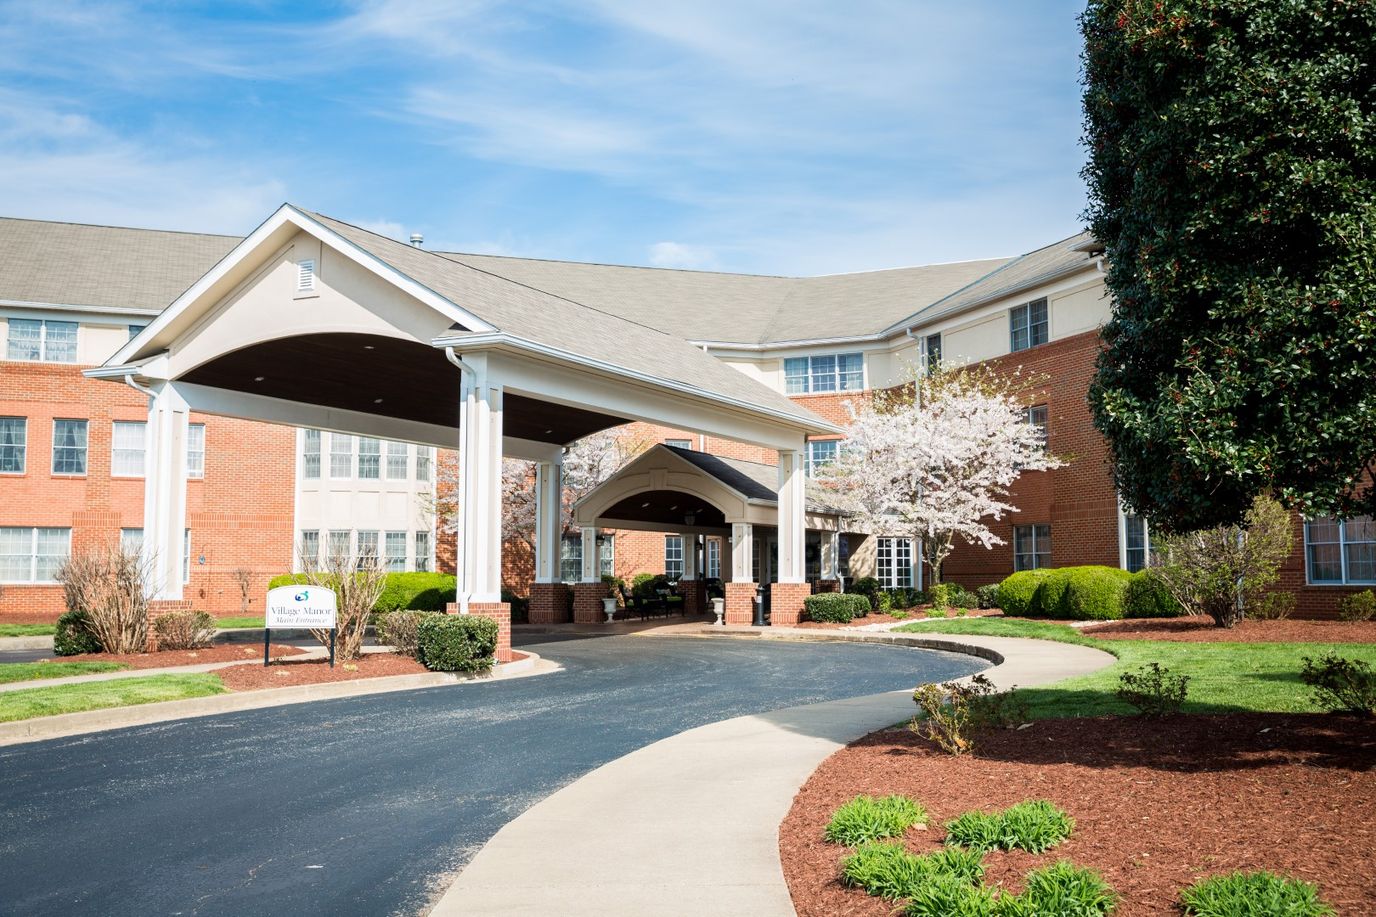
Overview of Village Manor
About 2.1 miles from the city center, Village Manor is an extensive senior living community at 1800 Westen St in Bowling Green, Kentucky. It operates a 50-bed facility with an 84.6 percent occupancy rate and caters to seniors through five care levels: nursing home, skilled nursing, assisted living, independent living, and memory care. This breadth of services lets residents access appropriate care levels without relocating to another community as needs evolve.
For 28 years, Village Manor has operated in the region, maintaining a full-time staff providing 2.67 nursing hours per resident day. The Bowling Green location has a Walk Score of 28, so a few nearby services are walkable, with most errands and activities needing transportation. When shopping, dining, or seeking entertainment and medical services beyond the immediate area, families must plan for a car.
Interested occupants can reach Village Manor directly to schedule tours or inquire about care options, room types, and programs. For families assessing senior living options, an on-site visit remains the best way to examine the home’s daily rhythms, care standards, amenities, and cultural fit. Tours let you meet staff, see resident spaces, and know what daily life looks and feels like there.
28 years in operation Rank #17 / 161Years in operation — State benchmarkedThis home is ranked 17th out of 161 homes in Kentucky for years in operation. Shows how long this facility has been in operation compared to other Kentucky facilities. Longer operating histories may benefit residents, families, and staff.Facilities with the same value for a metric share the same rank. Rankings are based only on facilities in Kentucky that report data for that category. Facilities without available data are excluded from the ranking.Click the rank badge to see the full State ranking.Click here to see the full State ranking.
A longer operating history, which may indicate experience navigating regulations and delivering ongoing care.
Walk Score: 28 / 100 Rank #292 / 403Walk Score — State benchmarkedThis home is ranked 292nd out of 403 homes in Kentucky for walk score. Shows how walkable this facility's neighborhood is compared to the average walk score across Kentucky facilities. Higher scores benefit residents, families, and staff.Facilities with the same value for a metric share the same rank. Rankings are based only on facilities in Kentucky that report data for that category. Facilities without available data are excluded from the ranking.Click the rank badge to see the full State ranking.Click here to see the full State ranking.
Somewhat walkable. A few nearby services may be reachable on foot, but most trips require transportation.
Pets not allowed
Places of interest near Village Manor
![]() 2.1 miles from city center
2.1 miles from city center
![]() Estimated distance in miles from Bowling Green's city center to Village Manor's address, calculated via Google Maps.
Estimated distance in miles from Bowling Green's city center to Village Manor's address, calculated via Google Maps.
Calculate Travel Distance to Village Manor
Add your location
Compare Nursing Homes around Bowling Green
Info below is compiled from CMS reports & the KY Cabinet for Health & Family Services (CHFS), senior community websites & trusted data sources such as Walk Score & BBB.
Communities are listed from highest to lowest based on our ranking methodology.
| Magnolia Village | NH SNF | Bowling Green (Eastland Park) | 60
Facility
60
KY AVG
82
Rank
#223 / 341 |
96.7%
Facility
96.7%
KY AVG
84.3
Rank
#15 / 168 | +15% | 2.56
Facility
2.56
KY AVG
3.75
Rank
#176 / 189 | -32% | -32% | $0
Facility
$0
KY AVG
$65.4k
Rank
#1 / 195 | 8
Facility
8
KY AVG
13.5
Rank
#47 / 191 | 4.0
Facility
4.0
KY AVG
4.4
Rank
#89 / 191 | - | 58 | - |
37
Facility
37
KY AVG
43
Rank
#237 / 403 | Magnolia Village Health Center LLC | $6.8MFiscal year ending 12/2023
Facility
$6.8MFiscal year ending 12/2023
KY AVG
$9.8M
Rank
#139 / 184 | $2.8MFiscal year ending 12/2023
Facility
$2.8MFiscal year ending 12/2023
KY AVG
$4.8M
Rank
#154 / 184 | 41.2%Fiscal year ending 12/2023
Facility
41.2%Fiscal year ending 12/2023
KY AVG
48.9%
Rank
#145 / 184 | 185435 | ||||
| Edmonson Center | NH SNF | Brownsville | 74
Facility
74
KY AVG
82
Rank
#181 / 341 |
97.3%
Facility
97.3%
KY AVG
84.3
Rank
#13 / 168 | +15% | 3.47
Facility
3.47
KY AVG
3.75
Rank
#66 / 189 | -41% | -8% | $0
Facility
$0
KY AVG
$65.4k
Rank
#1 / 195 | 11
Facility
11
KY AVG
13.5
Rank
#87 / 191 | 5.5
Facility
5.5
KY AVG
4.4
Rank
#142 / 191 | 3 | 72 | - |
43
Facility
43
KY AVG
43
Rank
#206 / 403 | Edmonson Health Center LLC | $8.4MFiscal year ending 12/2023
Facility
$8.4MFiscal year ending 12/2023
KY AVG
$9.8M
Rank
#114 / 184 | $3.5MFiscal year ending 12/2023
Facility
$3.5MFiscal year ending 12/2023
KY AVG
$4.8M
Rank
#126 / 184 | 42%Fiscal year ending 12/2023
Facility
42%Fiscal year ending 12/2023
KY AVG
48.9%
Rank
#141 / 184 | 185401 | ||||
| Hopkins Center | NH SNF | Woodburn | 50
Facility
50
KY AVG
82
Rank
#258 / 341 |
84.6%
Facility
84.6%
KY AVG
84.3
Rank
#108 / 168 | 0% | 2.67
Facility
2.67
KY AVG
3.75
Rank
#173 / 189 | -33% | -29% | $0
Facility
$0
KY AVG
$65.4k
Rank
#1 / 195 | 8
Facility
8
KY AVG
13.5
Rank
#47 / 191 | 2.7
Facility
2.7
KY AVG
4.4
Rank
#36 / 191 | - | 42 | - |
7
Facility
7
KY AVG
43
Rank
#382 / 403 | - | $5.4M*Fiscal year ending 10/2022These figures are from this home's most recent complete cost report — an older period than most facilities report. Compare with that in mind. | $2.6M*Fiscal year ending 10/2022These figures are from this home's most recent complete cost report — an older period than most facilities report. Compare with that in mind. | 47.7%*Fiscal year ending 10/2022These figures are from this home's most recent complete cost report — an older period than most facilities report. Compare with that in mind. | 185167 | ||||
| Signature Healthcare of Bowling Green | NH HOS MC PC RC SNF | Bowling Green | 176
Facility
176
KY AVG
82
Rank
#11 / 341 |
79.1%
Facility
79.1%
KY AVG
84.3
Rank
#133 / 168 | -6% | 3.27
Facility
3.27
KY AVG
3.75
Rank
#91 / 189 | -34% | -13% | $0
Facility
$0
KY AVG
$65.4k
Rank
#1 / 195 | 13
Facility
13
KY AVG
13.5
Rank
#103 / 191 | 4.3
Facility
4.3
KY AVG
4.4
Rank
#101 / 191 | - | 139 | A+ |
64
Facility
64
KY AVG
43
Rank
#79 / 403 | Shc Ky Holdings LLC | $15.3MFiscal year ending 12/2023
Facility
$15.3MFiscal year ending 12/2023
KY AVG
$9.8M
Rank
#16 / 184 | $5.2MFiscal year ending 12/2023
Facility
$5.2MFiscal year ending 12/2023
KY AVG
$4.8M
Rank
#59 / 184 | 34%Fiscal year ending 12/2023
Facility
34%Fiscal year ending 12/2023
KY AVG
48.9%
Rank
#173 / 184 | 185089 |
Financial Assistance for
Nursing Home in Kentucky
Village Manor is located in Bowling Green, Kentucky.
Here are the financial assistance programs available to residents in Kentucky.
Frequently Asked Questions about Village Manor
Is Village Manor in a walkable area?
Village Manor has a walk score of 28. Somewhat walkable. A few nearby services may be reachable on foot, but most trips require transportation.
How long has Village Manor been in business?
Village Manor has been operating for approximately 28 years, based on available licensing and registration records.
Are pets allowed at Village Manor?
No, Village Manor has a no-pet policy.
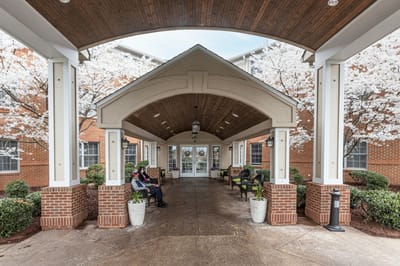
Are there photos of Village Manor?
Yes — there are 5 photos of Village Manor in the photo gallery on this page.
What is the address of Village Manor?
Village Manor is located at 1800 Westen St, Bowling Green, KY 42104.
What is the phone number of Village Manor?
(270) 796-6643 will put you in contact with the team at Village Manor.
Is Village Manor Medicare or Medicaid certified?
Village Manor is not currently listed as a CMS-certified provider of Medicare or Medicaid.
Guides for Better Senior Living
Care Cost Calculator: See Prices in Your Area
Nursing Home Data Explorer
Don’t Wait Too Long: 7 Red Flag Signs Your Parent Needs Assisted Living Now
The True Cost of Assisted Living in 2025 – And How Families Are Paying For It
Understanding Senior Living Costs: Pricing Models, Discounts & Financial Assistance
Updated on
