


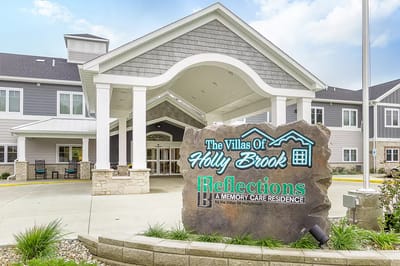
Villas of Holly Brook & Reflections Springfield
Assisted Living, Nursing Home & Memory Care · Springfield, IL


Villas of Holly Brook & Reflections Springfield
Assisted Living, Nursing Home & Memory Care · Springfield, IL
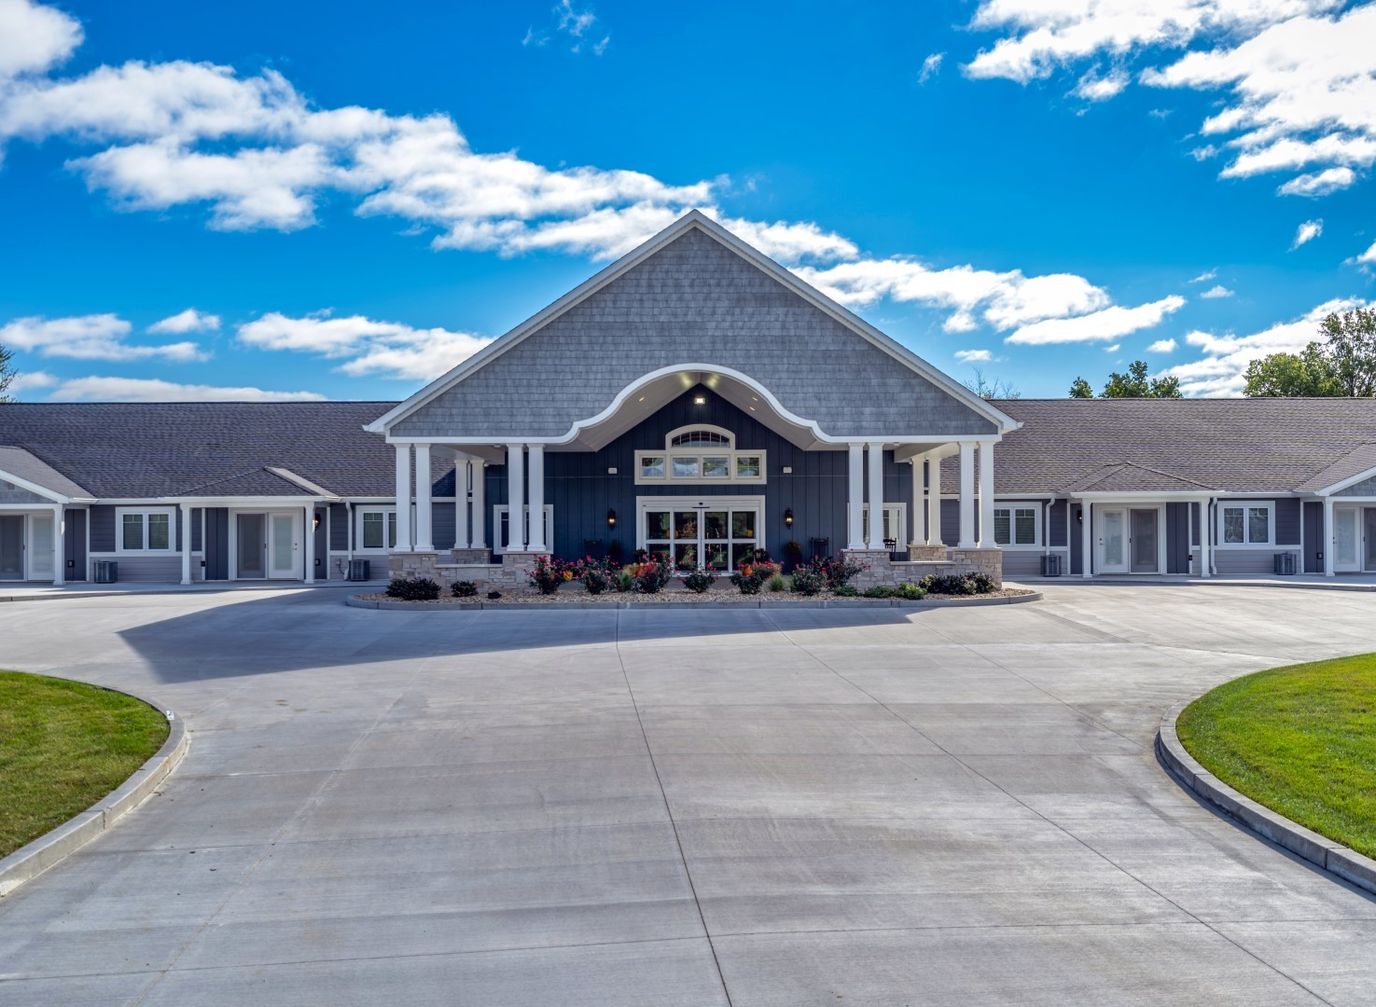
The Sister community of the Reflections in Chatham, Villas of Holly Brook also encourages its residential assisted living and memory care residents to find independence amid the quality service they receive. The continuum of care provides a stimulating environment where their compassionate and professional care staff meets their holistic needs. It’s a home-like environment that ensures residents experience the acclaimed resort-like hospitality that makes them feel like they are home away from home. Reflections is a person-centered community that guarantees seniors live life at ease.
As a proud new member of the Premier Senior Living community, Villas of Holly Brook created a lifestyle filled with endless possibilities that interest them with the amenities and services that cater to their day-to-day living: social and cultural events, recreational activities, and enriching programs.
97-bed community Rank #131 / 424Bed count — State benchmarkedThis home is ranked 131st out of 424 homes in Illinois for Bed Count. Shows this facility's certified or reported bed count compared to other Illinois facilities. Larger communities may offer more amenities, programs, and on-site services for residents and families.Facilities with the same value for a metric share the same rank. Rankings are based only on facilities in Illinois that report data for that category. Facilities without available data are excluded from the ranking.Click the rank badge to see the full State ranking.Click here to see the full State ranking.
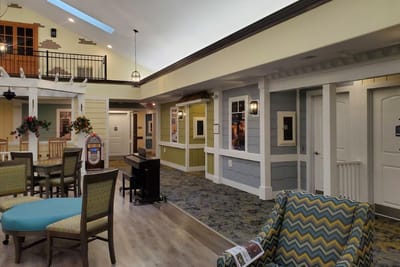
A larger shared setting that may offer more common spaces and organized community services.
Walk Score: 52 / 100 Rank #310 / 648Walk Score — State benchmarkedThis home is ranked 310th out of 648 homes in Illinois for Walk Score. Shows how walkable this facility's neighborhood is compared to the average Walk Score across Illinois facilities. Higher scores benefit residents, families, and staff.Facilities with the same value for a metric share the same rank. Rankings are based only on facilities in Illinois that report data for that category. Facilities without available data are excluded from the ranking.Click the rank badge to see the full State ranking.Click here to see the full State ranking.
Moderately walkable. Some errands can be accomplished on foot, with a mix of nearby amenities.
About this community
Facility TypeAssisted Living/shared Housing Establishment
StatusActive
IssuanceFebruary 3, 2026
ExpirationFebruary 2, 2027
CountySangamon
License Number5107195
Villas of Holly Brook & Reflections Springfield is legally operated by Phillips Investments LLC-Springfield Facility Series.
Permanent Units
73 units
Alzheimer's Units
24 units
Total beds
97 units
Respite Care
Specific ProgramsShort Term Care (Respite Care), Community Activity Calendars
Inspection History
In Illinois, the Department of Public Health, Office of Health Care Regulation conducts annual unannounced surveys to assess compliance with state and federal healthcare facility standards.
Since 2024 · 2 years of data
2 deficiencies
18 inspections
Inspection Scorecard
 This scorecard compares key inspection, deficiency, and complaint metrics at this facility against the Illinois state average. Metrics rated ≥15% worse than average are highlighted in red; those ≥15% better are highlighted in green.
Since 2024 vs. Illinois state average
Overall vs. IL average
0 Worse
No metrics in this bucket.
3 Better
Metrics better than Illinois average:
• Total deficiencies (71% below)
• Deficiencies per year (71% below)
• Deficiencies per inspection (88% below)
• Total deficiencies (71% below)
• Deficiencies per year (71% below)
• Deficiencies per inspection (88% below)
Latest Inspection
March 31, 2026
Complaint Original Investigation
Inspection
Deficiencies
| This Facility | IL Average | vs. IL Avg |
|---|---|---|---|
|
Total deficiencies
| 2 | 7 | This facility has 71% fewer total deficiencies than a typical Illinois assisted living residence (2 vs. IL avg 7).↓ 71% better |
|
Deficiencies per year
| 1 | 3.5 | This facility has 71% fewer deficiencies per year than a typical Illinois assisted living residence (1 vs. IL avg 3.5).↓ 71% better |
|
Deficiencies per inspection
| 0.1 | 0.8 | This facility has 88% fewer deficiencies per inspection than a typical Illinois assisted living residence (0.1 vs. IL avg 0.8).↓ 88% better |
Inspections
| This Facility | IL Average | vs. IL Avg |
|---|---|---|---|
|
Total inspections
| 18 | 9 | This facility has had 100% more total inspections than the Illinois average (18 vs. IL avg 9). More inspections can mean more regulatory scrutiny rather than worse care.↑ 100% more |
Inspection Reports Summary
An editor-reviewed summary of the themes and findings across this facility's recent inspection reports.
- September 25, 2025 complaint investigation found two deficiencies for failing to revise and implement fall prevention service plans, resulting in harm including a vertebral compression fracture.
- November 17, 2025 follow-up survey found the facility in full compliance with assisted living regulations and no deficiencies.
- Prior complaint investigations from November 2024 through May 2025 were unsubstantiated with no violations cited, showing mixed findings over time.
What does this home offer?
Pets Allowed
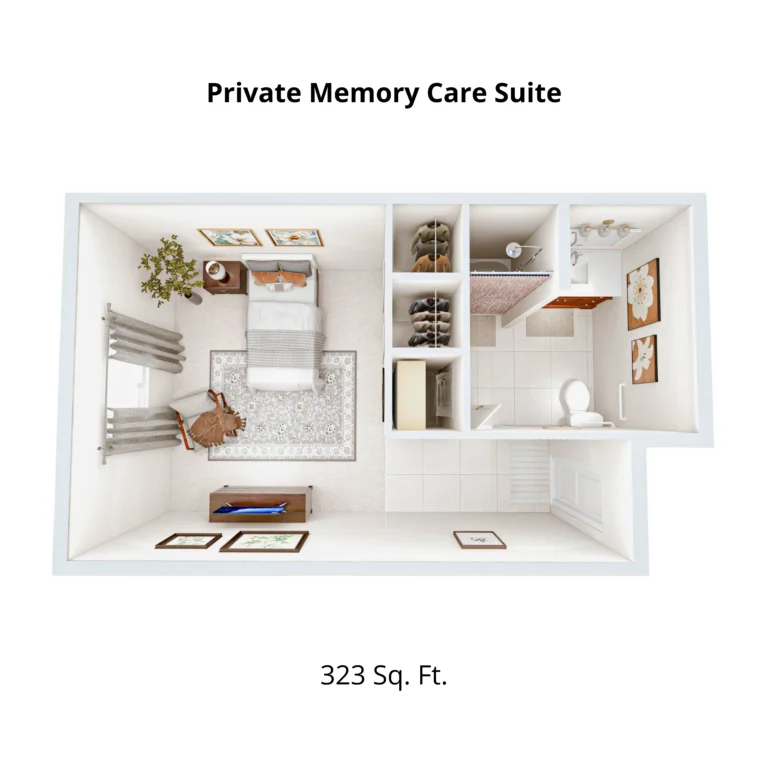
Room Sizes: 323 / 434 / 559 / 832 / 1,061 sq. ft
Housing Options: Studio / 1 Bed / 2 Bed
Building Type: Single-story
Transportation Services
Fitness and Recreation
Living Spaces & Floor Plans for Villas of Holly Brook & Reflections Springfield
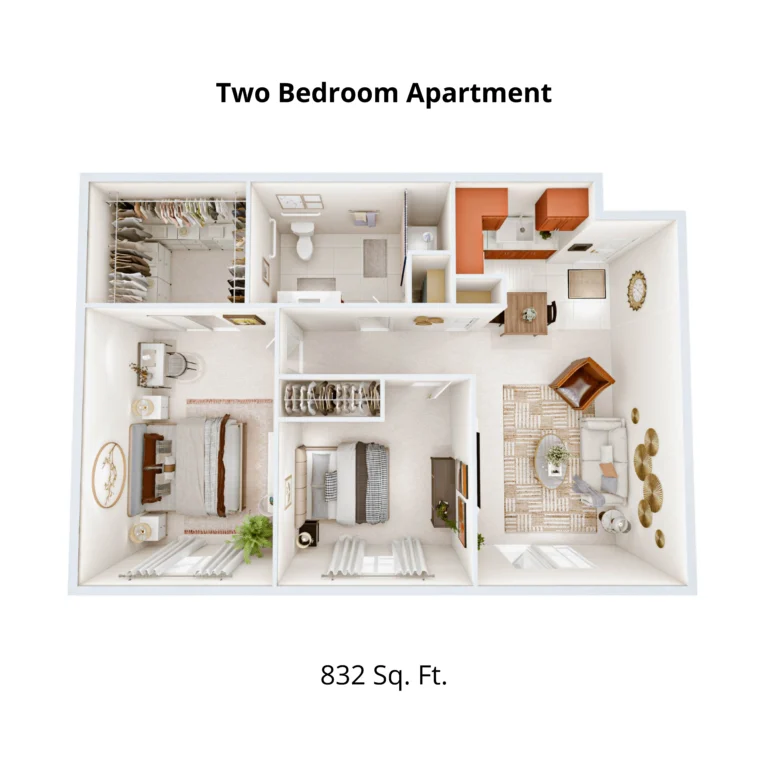
2 bedroom
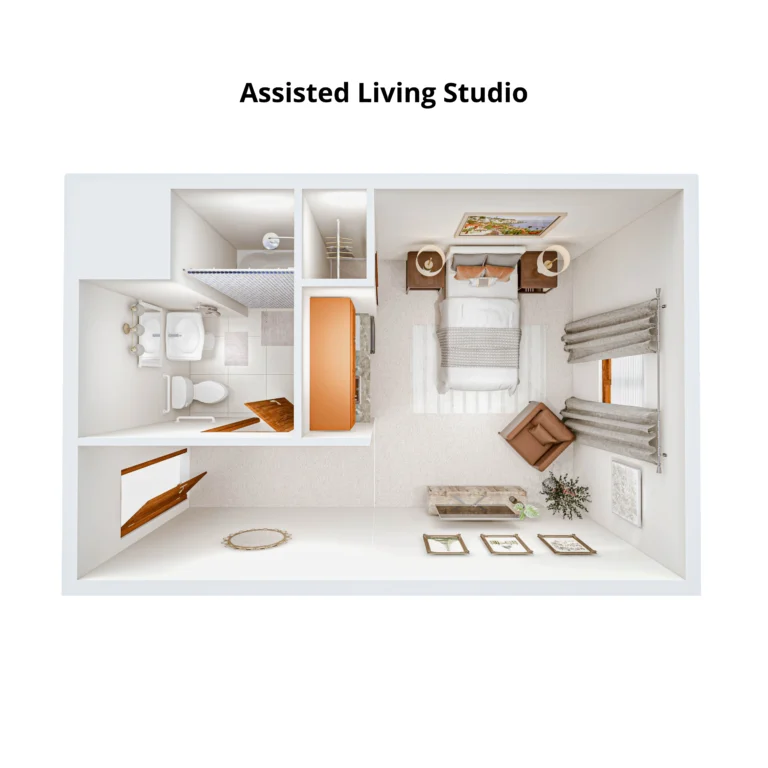
Studio
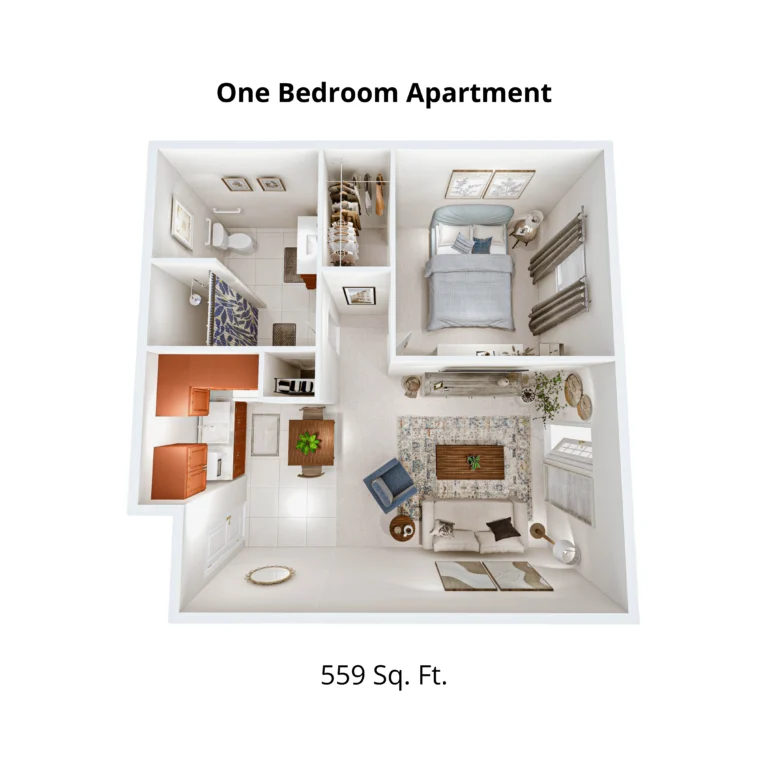
1 Bedroom
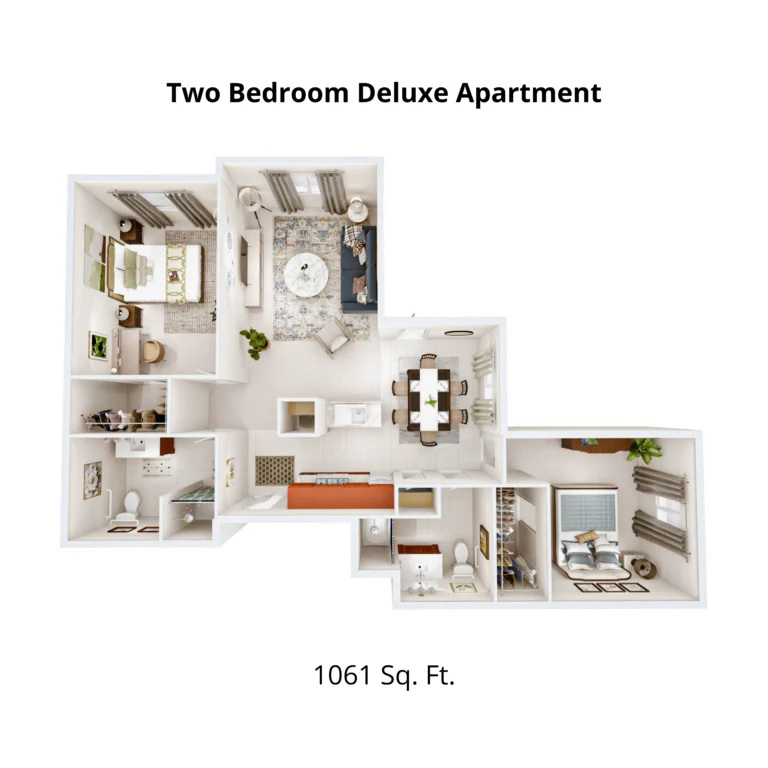
2 bedroom
Places of interest near Villas of Holly Brook & Reflections Springfield
![]() 5.0 miles from city center
5.0 miles from city center
![]() Estimated distance in miles from Springfield's city center to Villas of Holly Brook & Reflections Springfield's address, calculated via Google Maps.
Estimated distance in miles from Springfield's city center to Villas of Holly Brook & Reflections Springfield's address, calculated via Google Maps.
Calculate Travel Distance to Villas of Holly Brook & Reflections Springfield
Add your location
Financial Assistance for
Assisted Living in Illinois
Villas of Holly Brook & Reflections Springfield is located in Springfield, Illinois.
Here are the financial assistance programs available to residents in Illinois.
Frequently Asked Questions about Villas of Holly Brook & Reflections Springfield
Who is the owner of Villas of Holly Brook & Reflections Springfield?
Villas of Holly Brook & Reflections Springfield is legally operated by Phillips Investments LLC-Springfield Facility Series.
Is Villas of Holly Brook & Reflections Springfield in a walkable area?
Villas of Holly Brook & Reflections Springfield has a walk score of 52. Moderately walkable. Some errands can be accomplished on foot, with a mix of nearby amenities.
What is the license number of Villas of Holly Brook & Reflections Springfield?
According to IL state health department records, Villas of Holly Brook & Reflections Springfield's license number is 5107195.
When does Villas of Holly Brook & Reflections Springfield's license expire?
According to IL state health department records, Villas of Holly Brook & Reflections Springfield's license expires on February 2, 2027.
Are pets allowed at Villas of Holly Brook & Reflections Springfield?
Yes, Villas of Holly Brook & Reflections Springfield allows residents to bring their pets.
How many beds does Villas of Holly Brook & Reflections Springfield have?
Villas of Holly Brook & Reflections Springfield has 97 beds.
Are there photos of Villas of Holly Brook & Reflections Springfield?
Yes — there are 6 photos of Villas of Holly Brook & Reflections Springfield in the photo gallery on this page.
Guides for Better Senior Living
Care Cost Calculator: See Prices in Your Area
Nursing Home Data Explorer
Don’t Wait Too Long: 7 Red Flag Signs Your Parent Needs Assisted Living Now
The True Cost of Assisted Living in 2025 – And How Families Are Paying For It
Understanding Senior Living Costs: Pricing Models, Discounts & Financial Assistance
Updated on
