Mostly short-term rehab stays
Most residents typically stay for a few weeks or months before returning home or moving on.
Most new residents arrive under Medicare (67% of admissions), and a typical Medicare stay runs around 26 days.
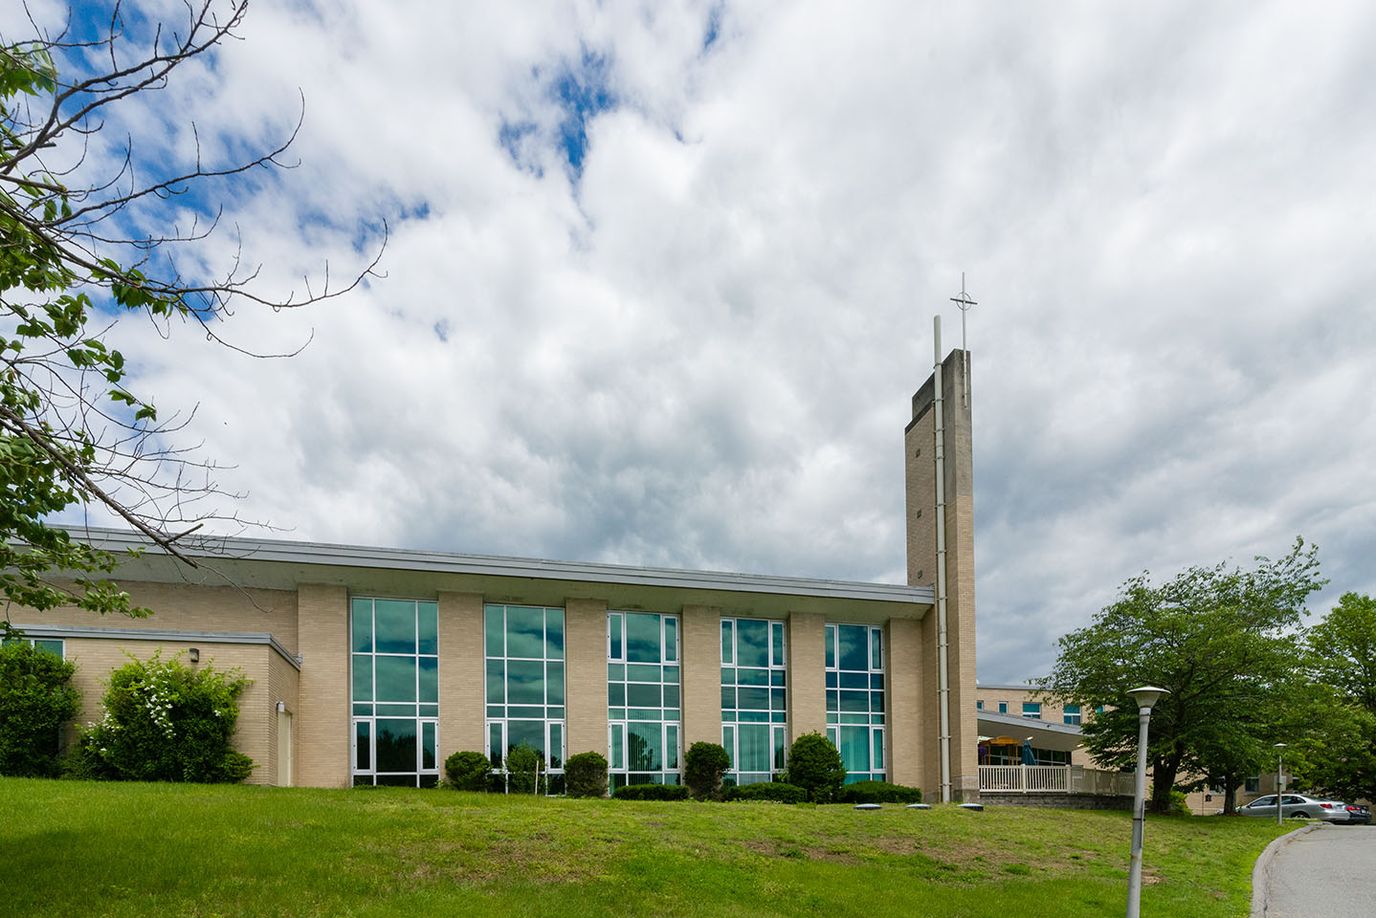
Warde Senior Living in Windham, New Hampshire, provides multiple levels of support, including independent living, assisted living, nursing care, palliative care, and respite services. This continuum of care can help older adults remain within the same community as their needs change. The community is owned by NH Catholic Charities Inc. and administered by Shari L. Laroche.
With 32 licensed beds and 31 currently occupied, the community has reached a high occupancy rate during its first year of operation. Residents may use Medicare, Medicaid, or private pay to cover care costs, and the average stay of approximately 197 days reflects a combination of short-term and longer-term residents.
Clinical support includes more than five hours of nursing care per resident each day, delivered through a combination of registered nurses, licensed practical or vocational nurses, and nurse aides. Rehabilitation services, respite care, and around-the-clock staffing further support residents who require ongoing assistance.
Residents have access to restaurant-style dining featuring seasonal ingredients, with meals available throughout the day. Social opportunities include games, music, entertainment, and regular religious services. The building is wheelchair accessible and equipped with security systems, alarm monitoring, and an on-site defibrillator. Pets are also welcome.
State inspections have identified a limited number of moderate issues related to care planning and administrative documentation, with no serious-level citations reported. All cited concerns were corrected. Families considering the community may wish to ask how resident care plans are reviewed and updated to ensure they remain current.
Standout metric: Physical therapist is +136% above New Hampshire average
2 of 6 metrics below New Hampshire average
87% of staff hours were worked by the facility's own employees
New Hampshire average: 87% · Contractors this quarter: Registered Nurse (5), Licensed Practical Nurse (4), Physical Therapy Assistant (2), Certified Nursing Assistant (2), Qualified Social Worker (2), Speech Language Pathologist (2), Respiratory Therapy Technician (1), Medical Director (1), Occupational Therapy Assistant (1), Physical Therapy Aide (1)
Why it matters: employees work here week after week and get to know each resident's routines and needs. Agency contractors often rotate between facilities, so a higher employee share usually means more consistent care.
Smaller home · May offer a more intimate, personalized care environment.
Source: CMS Provider Information, average daily residents
Warde Senior Living is administered by Shari L Laroche.
7 points above the New Hampshire average for CMS-certified facilities (84/100)
Category breakdown
5 severity-weighted points (3 deficiencies) · 6× lower than the typical CMS-certified NH facility (median: 29)
No fines on record · 0 enforcement actions
41 days to fix issues · slower than the typical CMS-certified NH facility (median: 31)
Latest inspection: Mar 04, 2026 · 1 citation (Pharmacy, moderate), corrected
Most cited category: Resident Assessment & Care Planning, 2 of 3 citations · 2 categories in total
Health citations are formal notices following inspections when they fail to comply with safety and care standards.
All 3 citations resulted from standard inspections.
Includes all CMS health inspection records for this property, which could include management/ownership changes.
Data sourced from CMS Health Deficiencies reports. Citation severity codes range from A (least serious) to L (most serious). Immediate Jeopardy (J-L) citations indicate situations where the facility's noncompliance has placed residents at risk of death or serious harm.
Source: CMS Penalties Database · Data as of Aug 2026
No penalties in the past 3 years
No civil money penalties or payment denials on record since Aug 2023.
How residents at this home fare on health outcomes and preventive care, compared with the New Hampshire average.
11 long-stay measures: 4 better, 5 worse, 2 near NH average
3 short-stay measures: 3 better
People who live at the home · 11 measures
Rehab and recovery after a hospital stay · 3 measures
Arrows show whether a figure is above or below the average. Green is better for residents, red is worse, and yellow means within 5% of the average. The line on each bar marks the average.
Quality measures are calculated by CMS from Minimum Data Set (MDS) resident assessments and Medicare claims.
67% of new residents, usually for short-term rehab.
17% of new residents, often for short stays.
15% of new residents, often for long-term daily care.
Source: CMS Long-Term Care Facility Characteristics (Data as of Jun 2026)
Residents meet regularly to discuss policies, care quality, and activities
Organized group of residents that meets regularly to discuss facility policies, quality of life, and activities.
Warde Senior Living’s finances from its CMS cost report for the fiscal year ending March 2025, compared with 58 New Hampshire nursing homes that filed a recent report. Includes all financial data for this property, which could include management/ownership changes.
Is it financially stable?
Losing money on care, but less than last year
−20.7% operating margin
+0.3 pts vs prior year
An operating loss in 8 of the last 8 reported years. Other income ($0.1M) trims the net loss to −$0.9M. Watch for cost-cutting that reaches staffing.
Does it invest in staff?
Spends more on payroll than most New Hampshire homes
68.7% payroll share of revenue
NH average 55.5%Rank #8 / 58Payroll % of net patient revenue — State benchmarked This nursing home is ranked 8th out of 58 nursing homes we track in New Hampshire for payroll % of net patient revenue. Shows payroll as a percentage of net patient revenue versus the New Hampshire average, among facilities reporting a recent fiscal year. Below 25% may signal understaffing or heavy agency use — read with Staffing ratings. Communities with the same value for a metric share the same rank. Rankings compare like with like: every nursing home we track in New Hampshire that reports data for that category. Nursing homes without available data are excluded, so the pool size varies from metric to metric.
Payroll rose $0.7M while revenue fell $0.1M. Check hours per resident in the staffing section to confirm it reaches the floor.
FY 2025 scorecard
Each row shows the FY 2025 figure, the change since the prior report, the trend, and how it compares with New Hampshire homes.
Losing money on care
| Metric | FY 2025 | vs prior year | Trend 2018 → 2025Trend | NH median | Compared with NH homesRank in NH | In short |
|---|---|---|---|---|---|---|
| Net patient revenue What the home earns from resident care, after discounts and bad debt. | $4.8M | −$0.1M | Trend 20182025 | NH median $11.2M | Rank in NH Rank #53 / 58Net patient revenue — State benchmarked This nursing home is ranked 53rd out of 58 nursing homes we track in New Hampshire for net patient revenue. Shows this facility's net patient revenue compared to the New Hampshire average, among facilities reporting a recent fiscal year. Higher revenue generally means more resources for staffing and capital — read alongside Payroll %. Communities with the same value for a metric share the same rank. Rankings compare like with like: every nursing home we track in New Hampshire that reports data for that category. Nursing homes without available data are excluded, so the pool size varies from metric to metric. Higher than 9% of homes | Below NH median Higher net patient revenue than 9% of NH homes that filed a recent report. Revenue mostly follows how big a home is. |
| Operating expenses Everything it costs to run the home: staff, supplies, rent, admin. | $5.8M | −$0.1M | Trend 20182025 | NH median — | Rank in NH Not ranked | Exceeds revenue Operating expenses are higher than net patient revenue, so resident care runs at a loss. |
| Net patient income Revenue minus operating expenses. Negative means care loses money. | −$1.0M | +$0.0M | Trend 20182025 | NH median — | Rank in NH Not ranked | Loss, narrowing Resident care lost money this year, less than in the prior report. |
| Operating margin Net patient income as a share of revenue. The clearest health signal. | −20.7% | +0.3 pts | Trend 20182025 | NH median — | Rank in NH Not ranked | Loss A negative margin means resident care costs more than it earns. |
| Other income Money not from resident care: investments, grants, services. | $0.1M | — | Trend — | NH median — | Rank in NH Not ranked | Offsets part of the loss Income from outside resident care covers part of the loss on care. |
| Net income The bottom line after other income. | −$0.9M | −$0.0M | Trend — | NH median — | Rank in NH Not ranked | Loss The bottom line is below zero even after other income. |
Spends more of revenue on staff than most New Hampshire homes
| Metric | FY 2025 | vs prior year | Trend 2018 → 2025Trend | NH median | Compared with NH homesRank in NH | In short |
|---|---|---|---|---|---|---|
| Payroll costs Salaries and wage-related benefits, not counting contract labor. | $3.3M | +$0.7M | Trend 20182025 | NH median $6.1M | Rank in NH Rank #51 / 58Payroll costs — State benchmarked This nursing home is ranked 51st out of 58 nursing homes we track in New Hampshire for payroll costs. Shows total staff payroll — salaries plus wage-related benefits — benchmarked to the New Hampshire average, among facilities reporting a recent fiscal year. Higher payroll relative to peers often signals better staffing and less reliance on contract labor. Communities with the same value for a metric share the same rank. Rankings compare like with like: every nursing home we track in New Hampshire that reports data for that category. Nursing homes without available data are excluded, so the pool size varies from metric to metric. Higher than 12% of homes | Below NH median Higher payroll than 12% of NH homes. Payroll in dollars mostly follows how big a home is, so this compares size, not staffing levels. |
| Payroll share of revenue Payroll divided by revenue. Higher usually means more staff per resident. | 68.7% | +16.2 pts | Trend 20182025 | NH median 51.4% | Rank in NH Rank #8 / 58Payroll % of net patient revenue — State benchmarked This nursing home is ranked 8th out of 58 nursing homes we track in New Hampshire for payroll % of net patient revenue. Shows payroll as a percentage of net patient revenue versus the New Hampshire average, among facilities reporting a recent fiscal year. Below 25% may signal understaffing or heavy agency use — read with Staffing ratings. Communities with the same value for a metric share the same rank. Rankings compare like with like: every nursing home we track in New Hampshire that reports data for that category. Nursing homes without available data are excluded, so the pool size varies from metric to metric. Higher than 88% of homes | 13.2 pts over NH average The NH average is 55.5% of revenue. Within 3 points of it reads as near the average. |
USD, millions
Net patient revenue Operating expenses Net patient income
% of net patient revenue
Payroll share Operating margin NH payroll average
| Metric | 2018 | 2019 | 2020 | 2021 | 2022 | 2023 | 2024 | 2025 |
|---|---|---|---|---|---|---|---|---|
| Net patient revenue | $3.7M | $3.6M | $3.9M | $4.1M | $4.0M | $4.6M | $4.9M | $4.8M |
| Operating expenses | $4.6M | $4.3M | $4.6M | $4.7M | $4.7M | $5.6M | $5.9M | $5.8M |
| Net patient income | −$0.9M | −$0.7M | −$0.7M | −$0.6M | −$0.6M | −$1.0M | −$1.0M | −$1.0M |
| Operating margin | −24.7% | −19.5% | −17.9% | −15.1% | −15.7% | −21.6% | −20.9% | −20.7% |
| Net income | −$0.8M | −$0.6M | −$3.5M | −$0.1M | $0.0M | −$0.9M | −$0.9M | −$0.9M |
| Payroll costs | $2.3M | $2.2M | $2.3M | $2.2M | $2.1M | $2.2M | $2.6M | $3.3M |
| Payroll share of revenue | 62.3% | 61.2% | 58.3% | 54.0% | 52.1% | 48.5% | 52.5% | 68.7% |
| Beds | 32 | 32 | 32 | 32 | 32 | 32 | 32 | 32 |
| Gross revenue | $4.7M | $4.8M | $5.1M | $5.0M | $4.8M | $5.4M | $5.8M | $5.9M |
| Salaries | $1.8M | $1.8M | $1.8M | $1.7M | $1.7M | $1.8M | $2.1M | $2.6M |
| Wage-related costs | $0.5M | $0.4M | $0.4M | $0.5M | $0.4M | $0.4M | $0.5M | $0.7M |
| Contract labor | $0.5M | $0.7M | $0.9M | $1.1M | $1.2M | $1.9M | $1.7M | $0.8M |
| Other operating costs | $2.3M | $2.1M | $2.3M | $2.5M | $2.6M | $3.4M | $3.3M | $2.5M |
| Net patient revenue per day | $343 | $342 | $365 | $414 | $430 | $429 | $427 | $422 |
| Cost per day | $428 | $409 | $430 | $476 | $497 | $521 | $516 | $509 |
| Average length of stay | 87.0 days | 79.0 days | 111.8 days | 126.8 days | 151.5 days | 133.8 days | 197.4 days | 155.7 days |
Showing 2025–2023 · scroll sideways for 5 earlier years
Earlier and partial years are in the download. Download CSV
Most residents typically stay for a few weeks or months before returning home or moving on.
Most new residents arrive under Medicare (67% of admissions), and a typical Medicare stay runs around 26 days.
Coverage residents most often arrive under.
Coverage residents most often leave under.
Shari LaRoche, MS, LNHA, serves as the Administrator at Warde Senior Living, overseeing all operations of the Independent, Assisted Living, and Skilled Nursing/Long-term Care communities. With over 27 years of experience, she is dedicated to supporting her associates and ensuring exceptional care and customer service for residents and their families.
0.3 miles from city center
Estimated distance in miles from Windham's city center to Warde Senior Living's address, calculated via Google Maps.
— 5.32 miles to nearest hospital (Parkland Medical Center)
Add your location
Warde Senior Living is located in Windham, New Hampshire.
Here are the financial assistance programs available to residents in New Hampshire.
Warde Senior Living has a walk score of 36. Car-dependent. A few nearby services may be reachable on foot, but most trips require transportation.
According to NH state health department records, Warde Senior Living's license number is 4086.
Warde Senior Living's occupancy is 97.3%.
Warde Senior Living has been operating for approximately 1 year, based on available licensing and registration records.
Yes, Warde Senior Living allows residents to bring their pets.
The team at Warde Senior Living can be reached at slaroche@nh-cc.org.
Warde Senior Living is registered as a non-profit in NH.
Care Cost Calculator: See Prices in Your Area
Nursing Home Data Explorer
Don’t Wait Too Long: 7 Red Flag Signs Your Parent Needs Assisted Living Now
The True Cost of Assisted Living in 2025 – And How Families Are Paying For It
Understanding Senior Living Costs: Pricing Models, Discounts & Financial Assistance