Total health inspections
11
Illinois average 10.4
Last Health inspection on Jun 2025

We arrange tours, appointments, and even moving support so you don’t have to
Thank you for your interest!
Our team will be in touch shortly to help with next steps.
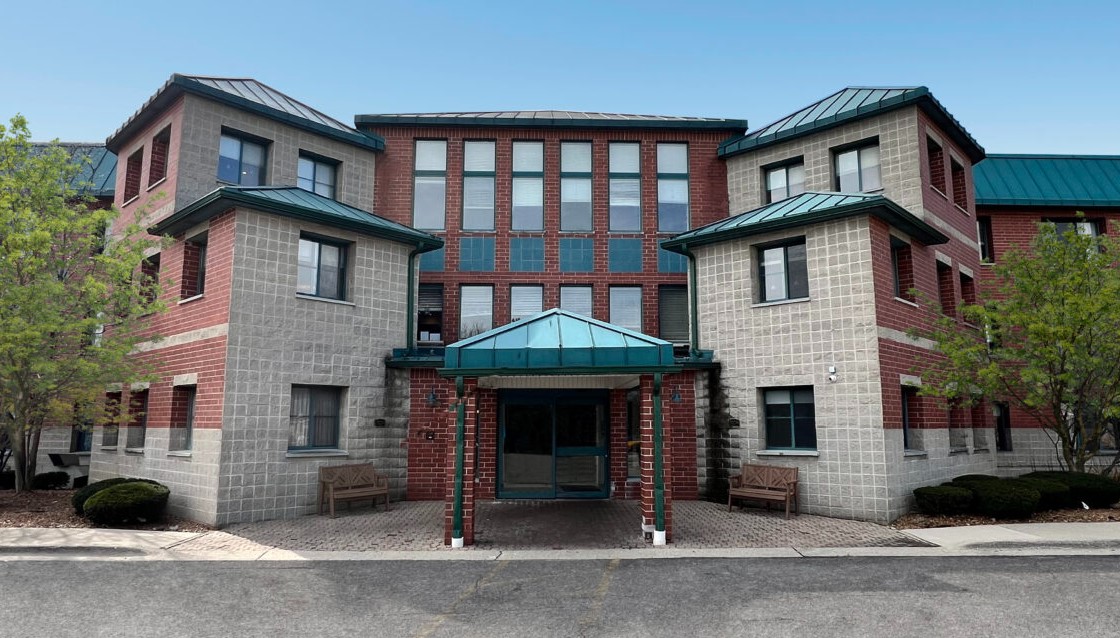

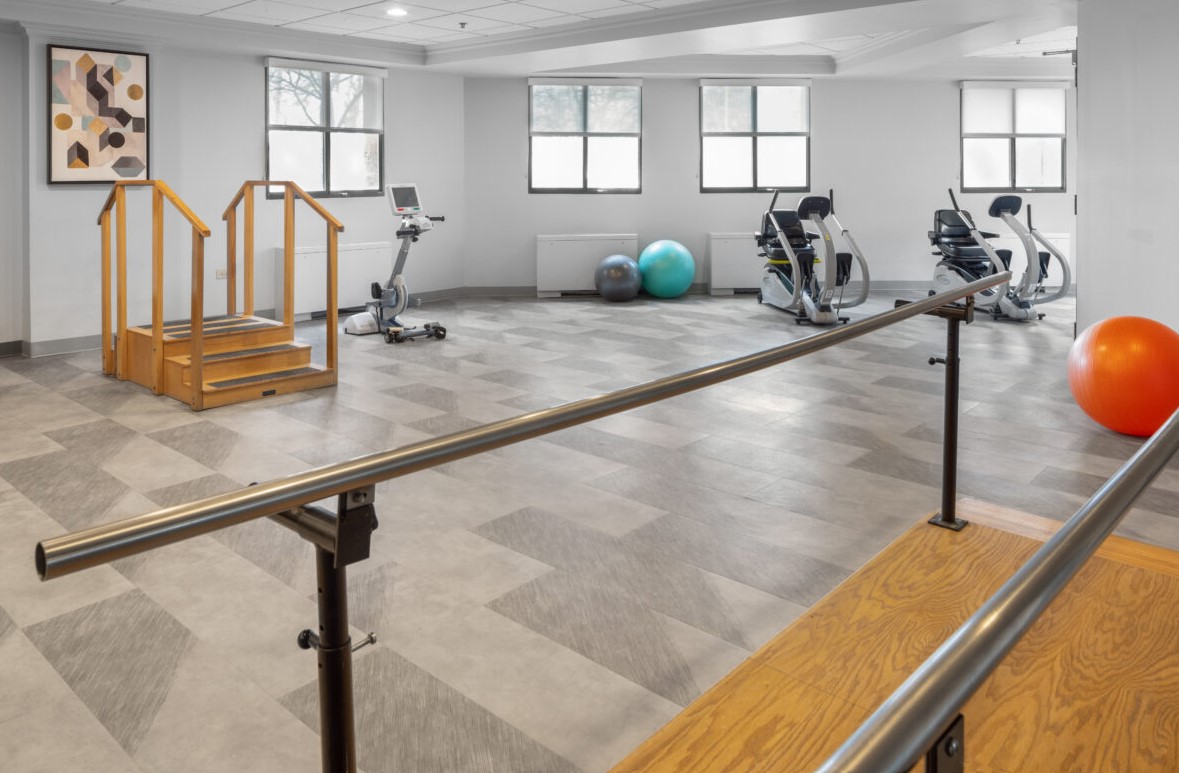
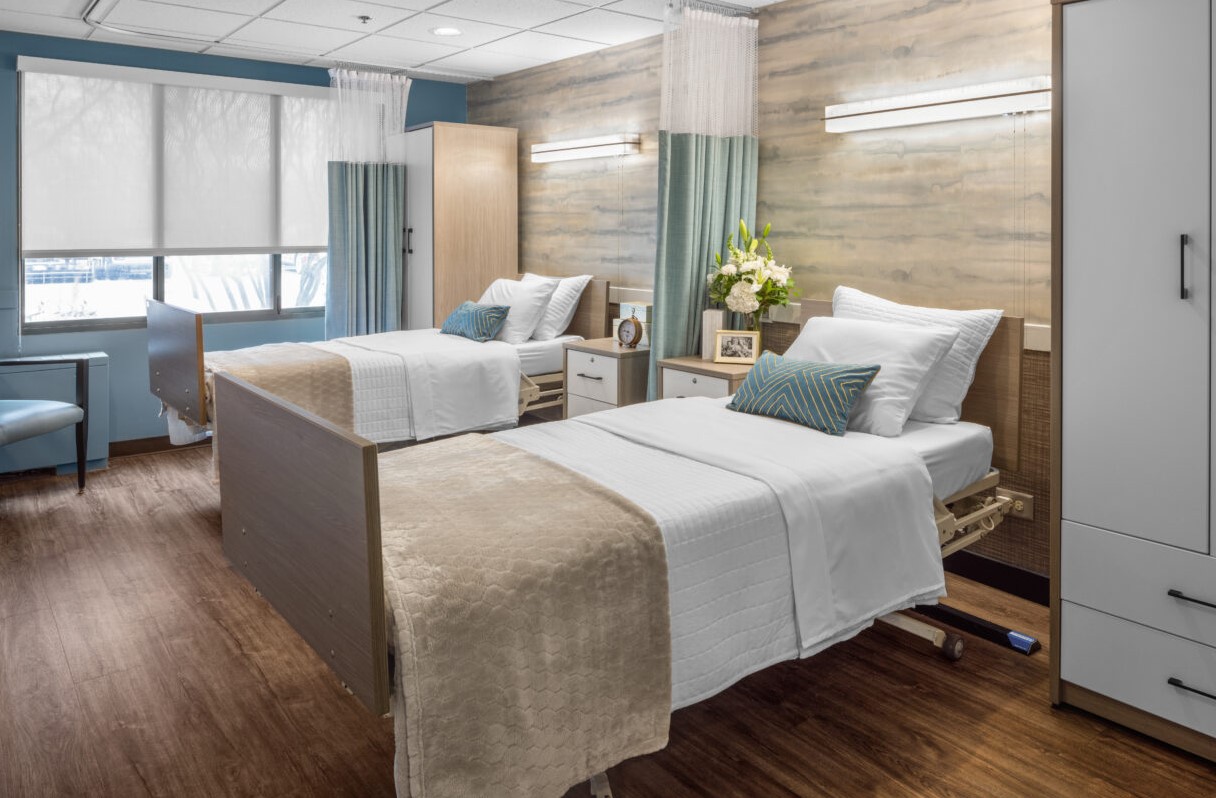
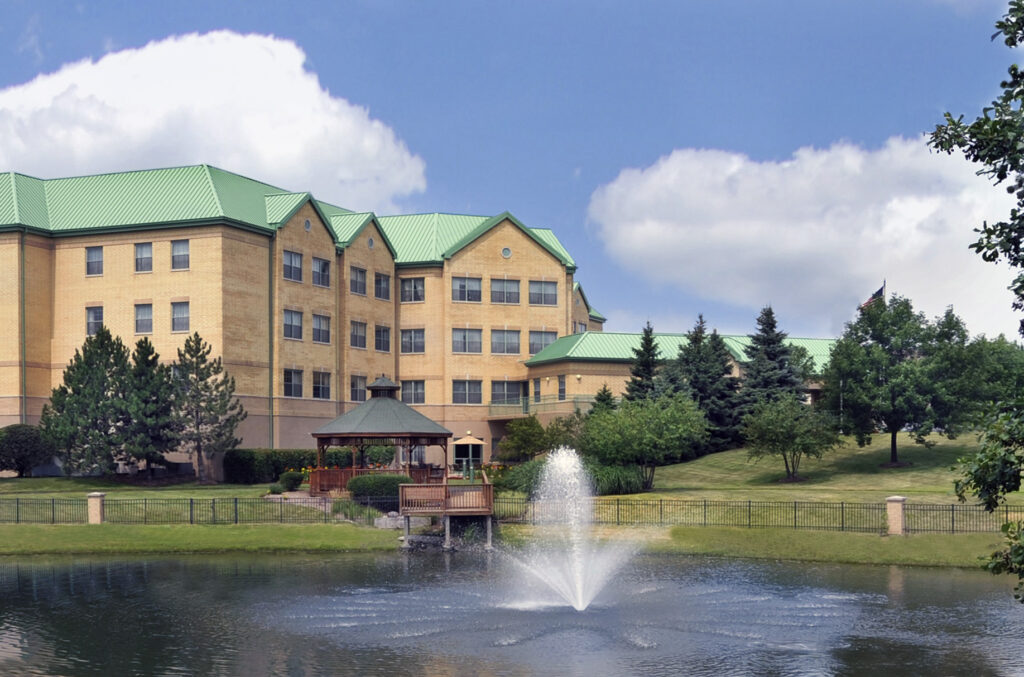
Warren Barr Orland Park, located in the heart of Orland Park, IL is a vibrant community specializing in short-term rehabilitation, skilled nursing, and memory care, and offering personalized services to support recovery and enhance quality of life. Residents can select from newly renovated private suites designed for comfort and privacy, spacious layouts and modern furnishings.
One of the community’s highlights is its wide range of amenities and services wherein residents can rejuvenate with on-site spa and salon services, unwind in inviting family lounges, or stay connected with high-speed Wi-Fi. The beautifully landscaped grounds and tranquil environment inspire a sense of calm, complementing the expert care delivered by a dedicated team. With an unwavering focus on well-being and independence, Warren Barr Orland Park creates an uplifting environment where every residents is empowered to thrive.
May provide extensive amenities, services and programs.
Lower occupancy suggests more openings may be available.
This home supports both short-term rehab and long-term care, with residents staying for a wide range of durations.
39% of new residents, usually for short-term rehab.
52% of new residents, often for short stays.
8% of new residents, often for long-term daily care.
Accept Medicaid: Yes, Accept
Total Residents: 275 Residents
Housing Options: Private / Semi-Private Rooms
Building Type: 3-story
Illinois average 10.4
Last Health inspection on Jun 2025
Illinois average 36.8
Illinois average 3.68
Health citations are formal notices following inspections when they fail to comply with safety and care standards.
25 of 35 citations resulted from standard inspections; and 10 of 35 resulted from complaint investigations.
Illinois average: 0.7
Illinois average: 3.6
Data sourced from CMS Health Deficiencies reports. Citation severity codes range from A (least serious) to L (most serious). Immediate Jeopardy (J-L) citations indicate situations where the facility's noncompliance has placed residents at risk of death or serious harm.
Assisted Living A licensed, long-term care setting for seniors or individuals with disabilities who need help with daily activities — like bathing, dressing, and medication management — but not 24-hour skilled nursing. Offers housing, meals, and around-the-clock support while aiming to maximize resident independence.
Independent Living Lifestyle-focused communities for older adults offering dining, activities, and transportation with minimal personal care. Best for active, independent seniors who want community without medical support.
Memory Care Secured, specialized care for people living with Alzheimer's or dementia. Staff trained in cognitive impairment, with higher staff-to-resident ratios and an environment designed to reduce confusion and wandering risk.
Nursing Home Licensed facility providing 24/7 skilled nursing care for residents with complex, ongoing medical needs. Staffed by RNs, LPNs, and CNAs. Inspected and star-rated annually by CMS. Accepts Medicare (short-term rehab) and Medicaid (long-term care).
Nursing Home Licensed facility providing 24/7 skilled nursing care for residents with complex, ongoing medical needs. Staffed by RNs, LPNs, and CNAs. Inspected and star-rated annually by CMS. Accepts Medicare (short-term rehab) and Medicaid (long-term care).
Assisted Living A licensed, long-term care setting for seniors or individuals with disabilities who need help with daily activities — like bathing, dressing, and medication management — but not 24-hour skilled nursing. Offers housing, meals, and around-the-clock support while aiming to maximize resident independence.
Nursing Home Licensed facility providing 24/7 skilled nursing care for residents with complex, ongoing medical needs. Staffed by RNs, LPNs, and CNAs. Inspected and star-rated annually by CMS. Accepts Medicare (short-term rehab) and Medicaid (long-term care).
Respite Care Short-term temporary care — days to weeks — to give family caregivers a break. Full care provided during the stay. Often used after hospitalization or to trial a facility before a permanent placement decision.
![]() 0.7 miles from city center
0.7 miles from city center
![]() 14601 John Humphrey Dr, Orland Park, IL 60462
14601 John Humphrey Dr, Orland Park, IL 60462
Add your location
This data corresponds to Q2 2025 and is based on CMS Payroll-Based Journal.
Illinois average ratio: 1.90:1
Illinois average: 7.6 hours
Manages medical care and health needs.
This role is partially covered by contractors.
Assists with medical care and medications.
This role is partially covered by contractors.
Helps with daily care and mobility.
This role is partially covered by contractors.
Total hours from contractors
10,725 contractor hours this quarter
| Certified Nursing Assistant | 117 | 218 | 335 | 34,409 | 91 | 100% | 7.1 |
| Licensed Practical Nurse | 27 | 24 | 51 | 11,581 | 91 | 100% | 7.9 |
| Registered Nurse | 21 | 119 | 140 | 9,058 | 91 | 100% | 7.7 |
| Other Dietary Services Staff | 8 | 0 | 8 | 2,945 | 91 | 100% | 6.8 |
| Clinical Nurse Specialist | 6 | 0 | 6 | 2,920 | 90 | 99% | 6.2 |
| Dental Services Staff | 5 | 0 | 5 | 2,411 | 91 | 100% | 5.8 |
| RN Director of Nursing | 6 | 0 | 6 | 2,062 | 91 | 100% | 5.7 |
| Speech Language Pathologist | 0 | 7 | 7 | 1,603 | 52 | 57% | 7.1 |
| Physical Therapy Aide | 0 | 5 | 5 | 1,171 | 44 | 48% | 7 |
| Physical Therapy Assistant | 0 | 3 | 3 | 675 | 61 | 67% | 7.9 |
| Respiratory Therapy Technician | 0 | 2 | 2 | 608 | 60 | 66% | 9 |
| Administrator | 2 | 0 | 2 | 512 | 89 | 98% | 5.7 |
| Nurse Practitioner | 1 | 0 | 1 | 504 | 89 | 98% | 5.7 |
| Occupational Therapy Aide | 1 | 0 | 1 | 504 | 89 | 98% | 5.7 |
| Dietitian | 1 | 0 | 1 | 504 | 89 | 98% | 5.7 |
| Qualified Social Worker | 0 | 3 | 3 | 330 | 38 | 42% | 8.7 |
| Qualified Activities Professional | 1 | 0 | 1 | 64 | 12 | 13% | 5.3 |
Source: CMS Long-Term Care Facility Characteristics (Data as of Jan 2026)
Residents meet regularly to discuss policies, care quality, and activities
Organized group of residents that meets regularly to discuss facility policies, quality of life, and activities.
Data sourced from CMS Long-Term Care Facility Characteristics quarterly report. Payer mix reflects the current resident census by primary payment source.
These measures show how residents usually do over time at this home, based on health outcomes and preventive care.
Illinois average: 9.7
Illinois average: 18.6
Illinois average: 15.5%
Illinois average: 18.4%
Illinois average: 21.6%
Illinois average: 3.4%
Illinois average: 5.3%
Illinois average: 1.8%
Illinois average: 6.5%
Illinois average: 48.1%
Illinois average: 20.2%
Illinois average: 89.2%
Illinois average: 91.6%
Illinois average: 2.05
Illinois average: 2.25
Illinois average: 68.3%
Illinois average: 2.3%
Illinois average: 63.0%
Illinois average: 26.2%
Illinois average: 14.0%
Illinois average: 0.8%
Illinois average: 53.7%
Illinois average: 50.6%
Quality measures are calculated from Minimum Data Set (MDS) assessments. For most measures, lower percentages indicate better care quality.
Federal penalties imposed by CMS for regulatory violations, including civil money penalties (fines) and denials of payment for new Medicare/Medicaid admissions.
Source: CMS Penalties Database (Data as of Jan 2026)
Illinois average: $143K
Illinois average: 3.0
Illinois average: 1.1
Penalties are imposed by CMS for violations of federal nursing home regulations.
Last updated: Jan 2026
Historical financial and operational data for Warren Barr Orland Park based on CMS SNF Cost Reports.
Loading trend charts...
Care Cost Calculator: See Prices in Your Area
Nursing Home Data Explorer
Don’t Wait Too Long: 7 Red Flag Signs Your Parent Needs Assisted Living Now
The True Cost of Assisted Living in 2025 – And How Families Are Paying For It
Understanding Senior Living Costs: Pricing Models, Discounts & Financial Assistance

Touring a community? Use this expert-backed checklist to stay organized, ask the right questions, and find the perfect fit.
We'll send you a PDF version of the touring checklist.