Warren Barr Orland Park
Nursing Home & Memory Care · Orland Park, IL
CMS overall rating Info CMS (the Centers for Medicare & Medicaid Services) is the federal agency that rates nursing home quality. Its Overall Rating runs from 1 to 5 stars, combining health inspections, staffing, and quality measures, with inspections weighted most heavily.

Warren Barr Orland Park

Nursing Home & Memory Care · Orland Park, IL
CMS overall rating Info CMS (the Centers for Medicare & Medicaid Services) is the federal agency that rates nursing home quality. Its Overall Rating runs from 1 to 5 stars, combining health inspections, staffing, and quality measures, with inspections weighted most heavily.
Calculator: See prices in your area
Warren Barr Orland Park accepts Medicare, Medicaid, and private pay.

Overview of Warren Barr Orland Park

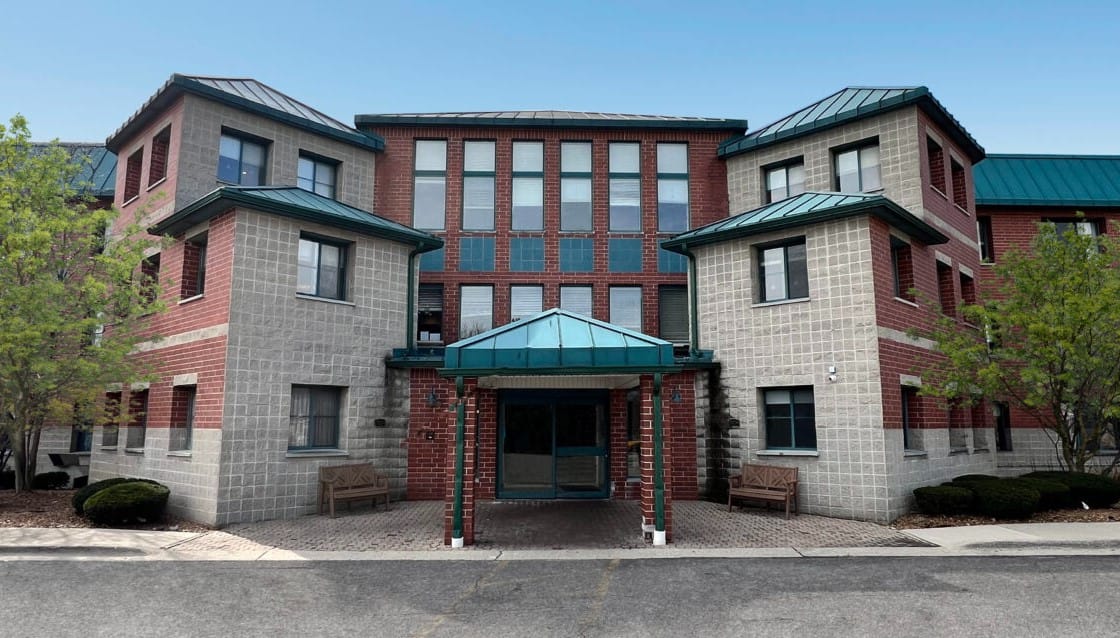
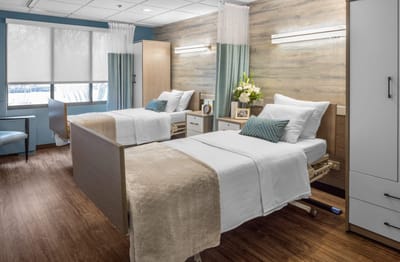
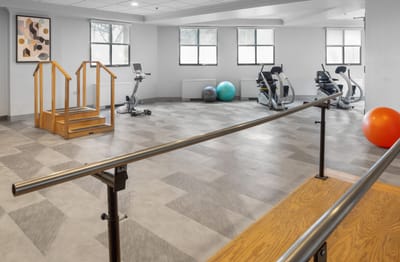
Warren Barr Orland Park, located in the heart of Orland Park, IL is a vibrant community specializing in short-term rehabilitation, skilled nursing, and memory care, and offering personalized services to support recovery and enhance quality of life. Residents can select from newly renovated private suites designed for comfort and privacy, spacious layouts and modern furnishings.

One of the community’s highlights is its wide range of amenities and services wherein residents can rejuvenate with on-site spa and salon services, unwind in inviting family lounges, or stay connected with high-speed Wi-Fi. The beautifully landscaped grounds and tranquil environment inspire a sense of calm, complementing the expert care delivered by a dedicated team. With an unwavering focus on well-being and independence, Warren Barr Orland Park creates an uplifting environment where every residents is empowered to thrive.

(708) 349-8300

Quality ratings

Measured by Centers for Medicare & Medicaid Services (CMS)

Overall rating Info The Overall CMS Rating combines results from health inspections, staffing levels and quality measures. Health inspections carry the most weight. Staffing and quality scores can increase or decrease the final rating based on performance compared to state and national standards.
▲ 19.0% Above IL avg. ▲ 19.0% Above IL avg.IL average: 2.5Click the badge to see the full State ranking.Click here to see the full State ranking.
Health Inspection Info Based on the results of the facility's three most recent standard inspections and any complaint investigations. CMS reviews the number, scope, and severity of deficiencies, with more recent findings weighted more heavily.
▲ 8.1% Above IL avg. ▲ 8.1% Above IL avg.IL average: 2.8Click the badge to see the full State ranking.Click here to see the full State ranking.
Staffing Info Measures average nursing staff hours per resident per day, including Registered Nurses (RNs) and total nursing staff. Ratings are adjusted based on the level of care residents require and are compared to state and national benchmarks.
▼ 6.4% Below IL avg. ▼ 6.4% Below IL avg.IL average: 2.1Click the badge to see the full State ranking.Click here to see the full State ranking.
Quality Measures Info Based on clinical and physical health indicators reported to CMS, such as hospital readmissions, falls, pressure ulcers, and improvements in mobility. These measures reflect how well residents' health needs are being managed.
▲ 42.1% Above IL avg. ▲ 42.1% Above IL avg.IL average: 2.8Click the badge to see the full State ranking.Click here to see the full State ranking.

Staffing hours breakdown

Info Daily nursing hours per resident by staff type, reported to CMS. Higher is generally better — compare this facility to state and national averages to see where staffing stands.

Hours per resident per day — compared to Illinois state averages

Total nursing care / resident Info This home is ranked 74th out of 172 homes in Illinois for nurse hours. Total adjusted nursing hours per resident per day, combining RN, LPN, and aide time. CMS adjusts this for case-mix so facilities can be fairly compared.
3h 1m per day
Rank #74 / 172Nurse hours — State benchmarkedThis home is ranked 74th out of 172 homes in Illinois. Shows adjusted nurse hours per resident per day benchmarked to the Illinois average, with a ranking across 172 Illinois facilities. More hours mean more direct care. The national average is about 3.5 hrs; below 3.0 is a red flag.Rankings are based only on facilities in Illinois that report data for that category. Facilities without available data are excluded from the ranking.Click the rank badge to see the full State ranking.Click here to see the full State ranking.
This facility Illinois avg (3h 6m per day)
vs Illinois avg
-3%

1 of 6 metrics below state avg

Standout metric LPN / LVN is +41% above state avg
Staff typeHours / Day / Residentvs state avg
Registered Nurse (RN) Info RNs hold the highest nursing license and can assess residents, interpret test results, and direct care plans. More RN hours per day often signals stronger clinical oversight and faster response to health changes. 43m per day ▼ 3% State avg: 44m per day · National avg: 41m per day
LPN / LVN Info Licensed Practical Nurses (LPNs) or Licensed Vocational Nurses (LVNs) deliver routine hands-on care — medication administration, wound dressing, and monitoring vital signs. They work under RN supervision and make up a large share of daily bedside care. 54m per day ▲ 41% State avg: 38m per day · National avg: 52m per day
Nurse Aide Info Certified Nurse Aides (CNAs) provide the most direct day-to-day assistance: bathing, dressing, feeding, and mobility. Nurse aide hours are typically the largest staffing category and directly affect residents' quality of life. 2h 6m per day ■ Avg State avg: 2h 8m per day · National avg: 2h 21m per day
Weekend Total Nursing Info Combined nursing hours (RN + LPN + Nurse Aide) per resident per day on weekends. Staffing often drops on weekends — this figure reveals whether the facility maintains adequate coverage outside of weekday hours. 3h 35m per day ▲ 16% State avg: 3h 5m per day · National avg: 3h 26m per day
Physical Therapist Info Hours per resident per day provided by licensed Physical Therapists (PTs) or PT Assistants. PT services help residents recover mobility after injury or illness and are especially important for post-acute (short-stay) rehabilitation. 4m per day ▲ 21% State avg: 3m per day · National avg: 4m per day
Weekend RN Info Registered nurse hours specifically on weekends. Facilities sometimes reduce RN presence on Saturdays and Sundays — a low weekend RN figure compared to weekday hours can indicate reduced clinical oversight when most administrative staff are absent. 44m per day ▲ 28% State avg: 34m per day · National avg: 29m per day

Capacity and availability

This home usually has availability

Lower occupancy than the Illinois average: 69.3%
Occupancy rate
62.1% Rank #146 / 204Occupancy rate — State benchmarkedThis home is ranked 146th out of 204 homes in Illinois. Shows this facility's occupancy rate versus the Illinois average, with its Statewide rank out of 204. Higher occupancy signals strong local demand and financial stability.Rankings are based only on facilities in Illinois that report data for that category. Facilities without available data are excluded from the ranking.Click the rank badge to see the full State ranking.Click here to see the full State ranking.
Avg. Length of Stay
56 days
Bed community size
275-bed community Rank #5 / 426Bed count — State benchmarkedThis home is ranked 5th out of 426 homes in Illinois. Shows this facility's certified or reported bed count compared to other Illinois facilities. Larger communities may offer more amenities, programs, and on-site services for residents and families.Rankings are based only on facilities in Illinois that report data for that category. Facilities without available data are excluded from the ranking.Click the rank badge to see the full State ranking.Click here to see the full State ranking.
A large-scale community that may provide a wide range of amenities, services, and structured programs.
Walk Score
Walk Score: 68 / 100 Rank #163 / 648Walk Score — State benchmarkedThis home is ranked 163rd out of 648 homes in Illinois. Shows how walkable this facility's neighborhood is compared to the average Walk Score across Illinois facilities. Higher scores benefit residents, families, and staff.Rankings are based only on facilities in Illinois that report data for that category. Facilities without available data are excluded from the ranking.Click the rank badge to see the full State ranking.Click here to see the full State ranking.
Moderately walkable. Some errands can be accomplished on foot, with a mix of nearby amenities.

Contact Warren Barr Orland Park

Staffing Data

Reporting period: October 1 – December 31, 2025 (Q4 2025). Source: CMS Payroll-Based Journal report.

Total staff 533
Employees 188
Contractors 345
Staff to resident ratio 3.17 : 1
77% more staff per resident than Illinois average
Illinois average ratio: 1.80 : 1 Illinois average ratio: 1.80 : 1See full Illinois ranking
Avg staff/day 110
Average shift 7.3 hours
0% compared with Illinois average
Illinois average: 7.6 hours Illinois average shift: 7.6 hoursSee full Illinois ranking
Total staff hours (quarter) 73,861

Nursing staff breakdown

Q4 2025 · Oct 1 – Dec 31 More info This data comes from the CMS Payroll-Based Journal report covering October 1 – December 31, 2025.
Registered Nurse

Manages medical care and health needs.

RN Staff Info 112 total: 24 full-time employees and 88 contractors. 112
Average shift length Info Average shift length. Calculated as total hours divided by days worked and average staff per day. 8 hours
Licensed Practical Nurse

Assists with medical care and medications.

LPN Staff Info 64 total: 31 full-time employees and 33 contractors. 64
Average shift length Info Average shift length. Calculated as total hours divided by days worked and average staff per day. 8.1 hours
Certified Nursing Assistant

Helps with daily care and mobility.

CNA Staff Info 302 total: 99 full-time employees and 203 contractors. 302
Average shift length Info Average shift length. Calculated as total hours divided by days worked and average staff per day. 7.4 hours

Contractor staffing

Q4 2025 · Oct 1 – Dec 31 More info This data comes from the CMS Payroll-Based Journal report covering October 1 – December 31, 2025.

Total hours from contractors

14.7%

10,870 contractor hours this quarter

Certified Nursing Assistant: 203 Registered Nurse: 88 Licensed Practical Nurse: 33 Speech Language Pathologist: 6 Physical Therapy Aide: 5 Physical Therapy Assistant: 4 Qualified Social Worker: 3 Respiratory Therapy Technician: 3

Staff by category

Q4 2025 · Oct 1 – Dec 31 More info This data comes from the CMS Payroll-Based Journal report covering October 1 – December 31, 2025.
Certified Nursing Assistant9920330234,63192100%7.4
Licensed Practical Nurse31336412,35492100%8.1
Registered Nurse24881128,27992100%8
Clinical Nurse Specialist100102,9629199%6.3
Other Dietary Services Staff8082,73192100%6.9
RN Director of Nursing6062,3889098%5.5
Dental Services Staff5052,3399098%5.8
Speech Language Pathologist0662,0266672%7.2
Physical Therapy Aide0551,7766672%7
Respiratory Therapy Technician0339949098%9.8
Physical Therapy Assistant0447698795%8.8
Qualified Social Worker0335846166%9.6
Dietitian1015089098%5.6
Administrator1014928896%5.6
Nurse Practitioner1014928896%5.6
Occupational Therapy Aide1014928896%5.6
Qualified Activities Professional101471011%4.7
302 Certified Nursing Assistant
% of Days 100%
64 Licensed Practical Nurse
% of Days 100%
112 Registered Nurse
% of Days 100%
10 Clinical Nurse Specialist
% of Days 99%
8 Other Dietary Services Staff
% of Days 100%
6 RN Director of Nursing
% of Days 98%
5 Dental Services Staff
% of Days 98%
6 Speech Language Pathologist
% of Days 72%
5 Physical Therapy Aide
% of Days 72%
3 Respiratory Therapy Technician
% of Days 98%
4 Physical Therapy Assistant
% of Days 95%
3 Qualified Social Worker
% of Days 66%
1 Dietitian
% of Days 98%
1 Administrator
% of Days 96%
1 Nurse Practitioner
% of Days 96%
1 Occupational Therapy Aide
% of Days 96%
1 Qualified Activities Professional
% of Days 11%

Penalties and fines

Includes penalties issued in 2023-2024

Federal penalties imposed by CMS for regulatory violations, including civil money penalties (fines) and denials of payment for new Medicare/Medicaid admissions.

Source: CMS Penalties Database (Data as of Jan 2026)

Total fines amount $60K Rank #112 / 173Federal fines — State benchmarkedThis home is ranked 112th out of 173 homes in Illinois. Shows this facility's cumulative CMS federal fine dollars versus the Illinois average among facilities with fines, and where it ranks among 173 facilities in the pool. Lower total dollars mean a better rank.Rankings are based only on facilities in Illinois that report data for that category. Facilities without available data are excluded from the ranking.Click the rank badge to see the full State ranking.Click here to see the full State ranking.
58% lower than Illinois average

Illinois average: $143K

Number of fines 3
In line with Illinois average

Illinois average: 3.0

Payment Denials Info Serious action where Medicare and/or Medicaid temporarily stops payments for new residents until issues are fixed. 1
6% fewer payment denials than Illinois average

Illinois average: 1.1

Fines amount comparison
This facility $60K
Illinois average $143K
Penalty History

Penalties are imposed by CMS for violations of federal nursing home regulations.

4 penalties in the past 3 years

Multiple penalties were reported in the last 3 years.

Civil Money Penalty Info Fines imposed for noncompliance, which can be assessed per day or per instance of violation. Jan 22, 2024
$14K
Civil Money Penalty Info Fines imposed for noncompliance, which can be assessed per day or per instance of violation. Dec 26, 2023
$10K
Civil Money Penalty Info Fines imposed for noncompliance, which can be assessed per day or per instance of violation. Sep 29, 2023
$37K
Payment Denial Info Serious action where Medicare and/or Medicaid temporarily stops payments for new residents until issues are fixed. Sep 29, 2023
39 days

Last updated: Jan 2026

Quality of care over time

These measures show how residents usually do over time at this home, based on health outcomes and preventive care.

High-risk clinical events score Info A composite score based on pressure ulcers, falls with injury, weight loss, walking ability decline, and activities of daily living decline. 8.4
13% better than Illinois average

Illinois average: 9.7

Functional decline score Info A composite score based on activities of daily living decline, walking ability decline, and incontinence. 13.7
26% better than Illinois average

Illinois average: 18.6

Long-stay resident measures
Above average Illinois avg: 3.6 Info CMS star rating based on long-stay quality measure performance. 5 stars = significantly above average, 1 star = significantly below average.
Need for Help with Daily Activities Increased Info Percent of long-stay residents whose need for help with daily activities has increased 10.0%
35% better than Illinois average

Illinois average: 15.5%

Walking Ability Worsened Info Percent of long-stay residents whose ability to move independently worsened 9.2%
50% better than Illinois average

Illinois average: 18.4%

Low Risk Residents with Bowel/Bladder Incontinence Info Percent of low risk long-stay residents who lose control of their bowels or bladder 22.0%
In line with Illinois average

Illinois average: 21.6%

Falls with Major Injury Info Percent of long-stay residents experiencing one or more falls with major injury 3.8%
14% worse than Illinois average

Illinois average: 3.4%

High Risk Residents with Pressure Ulcers Info Percent of long-stay high risk residents with pressure ulcers 8.0%
52% worse than Illinois average

Illinois average: 5.3%

Urinary Tract Infection Info Percent of long-stay residents with a urinary tract infection 0.2%
88% better than Illinois average

Illinois average: 1.8%

Lost Too Much Weight Info Percent of long-stay residents who lose too much weight 11.1%
70% worse than Illinois average

Illinois average: 6.5%

Depressive Symptoms Info Percent of long-stay residents who have depressive symptoms 96.2%
100% worse than Illinois average

Illinois average: 48.1%

Antipsychotic Use Info Percent of long-stay residents who received an antipsychotic medication 23.3%
15% worse than Illinois average

Illinois average: 20.2%

Pneumococcal Vaccine Info Percent of long-stay residents assessed and appropriately given the pneumococcal vaccine 79.0%
11% worse than Illinois average

Illinois average: 89.2%

Influenza Vaccine Info Percent of long-stay residents assessed and appropriately given the seasonal influenza vaccine 65.4%
29% worse than Illinois average

Illinois average: 91.6%

Hospitalizations per 1,000 days Info Number of hospitalizations per 1,000 long-stay resident days. 1.65
20% better than Illinois average

Illinois average: 2.05

ED visits per 1,000 days Info Number of outpatient emergency department visits per 1,000 long-stay resident days. 1.89
16% better than Illinois average

Illinois average: 2.25

Short-stay resident measures
Below average Illinois avg: 2.3 Info CMS star rating based on short-stay quality measure performance. 5 stars = much above average, 1 star = much below average.
Pneumococcal Vaccine Info Percent of short-stay residents assessed and appropriately given the pneumococcal vaccine 13.2%
81% worse than Illinois average

Illinois average: 68.3%

Antipsychotic medication increase Info Percent of short-stay residents who newly received an antipsychotic medication 2.2%
7% better than Illinois average

Illinois average: 2.3%

Influenza Vaccine Info Percent of short-stay residents assessed and appropriately given the seasonal influenza vaccine 15.7%
75% worse than Illinois average

Illinois average: 63.0%

Re-hospitalized after SNF stay Info Percentage of short-stay residents who were re-hospitalized after their nursing home admission. 28.3%
8% worse than Illinois average

Illinois average: 26.2%

Emergency department visits Info Percentage of short-stay residents who had an outpatient emergency department visit. 15.5%
11% worse than Illinois average

Illinois average: 14.0%

Falls with major injury Info Percentage of SNF residents who experience falls with major injury during their stay. 1.1%
45% worse than Illinois average

Illinois average: 0.8%

Ability to care for self at discharge Info Percentage of residents at or above expected ability to care for themselves at discharge. 53.8%
In line with Illinois average

Illinois average: 53.7%

Successful return to home or community Info Rate of successful return to home or community from a skilled nursing facility. 60.4%
19% better than Illinois average

Illinois average: 50.6%

Breakdown by payment type

Medicare

39% of new residents, usually for short-term rehab.

Typical stay 22 days

Private pay

52% of new residents, often for short stays.

Typical stay 2 - 3 months

Medicaid

8% of new residents, often for long-term daily care.

Typical stay 5 - 6 months

Facility Characteristics

Source: CMS Long-Term Care Facility Characteristics (Data as of Jan 2026)

Total residents 168
Medicare
10
6% of residents
Medicaid
107
63.7% of residents
Private pay or other
51
30.4% of residents
Programs & Services
Residents Group

Residents meet regularly to discuss policies, care quality, and activities

Active Resident Council

Organized group of residents that meets regularly to discuss facility policies, quality of life, and activities.

Finances and operations

Based on CMS SNF Cost Report for fiscal year ending in 12/2023.

Privately-owned community
Operated by a single business entity.
Net patient revenue Info Net patient revenue — what the home actually collects for resident care, after contractual allowances, bad debt and discounts are subtracted from its gross charges (CMS cost report, Worksheet G-3). It covers resident care only; money the home earns from other sources is shown separately as "Other income."
$24.7M
Net patient income Info Net patient income: net patient revenue minus the home's total operating expenses. A positive figure means it earns more from resident care than it spends to deliver it; a negative figure means the opposite. It excludes non-operating "other income."
$1.8M
Privately-owned community Operated by a single business entity.
Net patient revenue Info Net patient revenue — what the home actually collects for resident care, after contractual allowances, bad debt and discounts are subtracted from its gross charges (CMS cost report, Worksheet G-3). It covers resident care only; money the home earns from other sources is shown separately as "Other income."
$24.7M Rank #8 / 171Revenue — State benchmarkedThis home is ranked 8th out of 171 homes in Illinois. Shows this facility's annual revenue compared to the Illinois average. Higher revenue generally means more resources for staffing and capital — read alongside Payroll %.Rankings are based only on facilities in Illinois that report data for that category. Facilities without available data are excluded from the ranking.Click the rank badge to see the full State ranking.Click here to see the full State ranking.
Net patient income Info Net patient income: net patient revenue minus the home's total operating expenses. A positive figure means it earns more from resident care than it spends to deliver it; a negative figure means the opposite. It excludes non-operating "other income."
$1.8M
Other income Info Money the home earns outside of resident care — such as investments, grants, rentals and other non-operating sources (CMS cost report, Worksheet G-3). It is tracked separately from net patient revenue: it is not part of that figure, and it is not included in net patient income.
$405.5K
Payroll costs Info Staff salaries plus wage-related costs — benefits such as payroll taxes, health insurance and retirement — from the home's own accounting records (CMS cost report, Worksheet A). Contract or agency labor is counted separately, under other operating costs. Rank #21 / 171Payroll — State benchmarkedThis home is ranked 21st out of 171 homes in Illinois. Shows total annual staff payroll benchmarked to the Illinois average. Higher payroll investment relative to peers often signals better staffing and less reliance on cheaper contract labor.Rankings are based only on facilities in Illinois that report data for that category. Facilities without available data are excluded from the ranking.Click the rank badge to see the full State ranking.Click here to see the full State ranking.
$8.6M 34.9% of net patient revenue Info Payroll as a share of revenue: staff salaries and wage-related benefits divided by net patient revenue. A higher figure means more of each revenue dollar goes to staff pay. Rank #156 / 171Payroll % — State benchmarkedThis home is ranked 156th out of 171 homes in Illinois. Shows payroll as a percentage of revenue versus the Illinois average. Well-run Illinois facilities typically land around 54–67% — the top third Statewide. Below 25% may signal understaffing or heavy agency use — read with Staffing ratings.Rankings are based only on facilities in Illinois that report data for that category. Facilities without available data are excluded from the ranking.Click the rank badge to see the full State ranking.Click here to see the full State ranking.
Other operating costs Info Everything it costs to run the home apart from payroll — food, utilities, supplies, maintenance, contract labor and administration. Calculated as total operating expense minus payroll (staff salaries and wage-related benefits).
$14.3M
Total costs Info The home's total operating expense for the year — all the costs of running it, salaries included (CMS cost report, Worksheet G-3).
$22.9M

What does this home offer?

Housing options icon

Housing Options: Private / Semi-Private Rooms

Building type icon
Building type icon

Building Type: 3-story

Who this home usually serves

TYPE OF STAY

Mix of rehab and long-term care

This home supports both short-term rehab and long-term care, with residents staying for a wide range of durations.

Most new residents arrive under private pay (52% of admissions), and a typical private pay stay runs around 2 - 3 months.

Admissions
1,122 total

Coverage residents most often arrive under.

Medicare 39%
Private pay 52%
Medicaid 8%
Discharges
1,111 total

Coverage residents most often leave under.

Medicare 28%
Private pay 60%
Medicaid 12%

Places of interest near Warren Barr Orland Park

Address 0.7 miles from city center Info Estimated distance in miles from Orland Park's city center to Warren Barr Orland Park's address, calculated via Google Maps.

Calculate Travel Distance to Warren Barr Orland Park

Add your location

Address

Compare Nursing Homes around Orland Park

The information below is reported by the Illinois Department of Public Health, Office of Health Care Regulation.

4 facilities compared · CMS & IL Dept. of Health data

Victorian Village Health and Wellness Center
NH
AL
RC
Homer Glen
50
Facility 50
IL AVG 86
Rank #294 / 426
96.0%
Facility 96.0%
IL AVG 69.3%
Rank #20 / 204
+39%
4.63
Facility 4.63
IL AVG 3.10
Rank #24 / 172
+43%+49%
$0
Facility $0
IL AVG $151.3k
Rank #1 / 173
21
Facility 21
IL AVG 36.8
Rank #45 / 172
5.3
Facility 5.3
IL AVG 3.7
Rank #154 / 172
-52-
50
Facility 50
IL AVG 51
Rank #332 / 648
Kyle Yonker
$9.8M
Facility $9.8M
IL AVG $12.2M
Rank #119 / 171
$4.3M
Facility $4.3M
IL AVG $4.8M
Rank #112 / 171
44%
Facility 44%
IL AVG 44.3%
Rank #60 / 171
146178
SMITH CROSSING (Assisted Living)
NH
AL
IL
MC
Orland Park (Orland Township)
62
Facility 62
IL AVG 86
Rank #244 / 426
85.6%
Facility 85.6%
IL AVG 69.3%
Rank #54 / 204
+24%
5.19
Facility 5.19
IL AVG 3.10
Rank #15 / 172
-50%+67%
$142.4k
Facility $142.4k
IL AVG $151.3k
Rank #139 / 173
31
Facility 31
IL AVG 36.8
Rank #88 / 172
5.2
Facility 5.2
IL AVG 3.7
Rank #150 / 172
477A+
1
Facility 1
IL AVG 51
Rank #634 / 648
Andrew Anello
$15.2M
Facility $15.2M
IL AVG $12.2M
Rank #12 / 171
$8.5M
Facility $8.5M
IL AVG $4.8M
Rank #13 / 171
56%
Facility 56%
IL AVG 44.3%
Rank #126 / 171
146110
Warren Barr Orland Park
NH
MC
Orland Park (Orland Square Mall)
275
Facility 275
IL AVG 86
Rank #5 / 426
62.1%
Facility 62.1%
IL AVG 69.3%
Rank #146 / 204
-10%
3.02
Facility 3.02
IL AVG 3.10
Rank #74 / 172
+48%-3%
$60.3k
Facility $60.3k
IL AVG $151.3k
Rank #112 / 173
35
Facility 35
IL AVG 36.8
Rank #99 / 172
3.2
Facility 3.2
IL AVG 3.7
Rank #64 / 172
4179-
68
Facility 68
IL AVG 51
Rank #163 / 648
Scott Morton
$24.7M
Facility $24.7M
IL AVG $12.2M
Rank #8 / 171
$8.6M
Facility $8.6M
IL AVG $4.8M
Rank #21 / 171
34.9%
Facility 34.9%
IL AVG 44.3%
Rank #156 / 171
145899
Alden Estates of Orland Park
NH
HC
MC
NC
RC
Orland Park
200
Facility 200
IL AVG 86
Rank #30 / 426
74.8%
Facility 74.8%
IL AVG 69.3%
Rank #101 / 204
+8%
2.80
Facility 2.80
IL AVG 3.10
Rank #93 / 172
-15%-10%
$30.2k
Facility $30.2k
IL AVG $151.3k
Rank #100 / 173
60
Facility 60
IL AVG 36.8
Rank #145 / 172
3.0
Facility 3.0
IL AVG 3.7
Rank #45 / 172
7172-
31
Facility 31
IL AVG 51
Rank #487 / 648
Jeffrey Mussman
$18.9M
Facility $18.9M
IL AVG $12.2M
Rank #58 / 171
$10.6M
Facility $10.6M
IL AVG $4.8M
Rank #40 / 171
56%
Facility 56%
IL AVG 44.3%
Rank #59 / 171
145963

Financial Assistance for
Nursing Home in Illinois

Warren Barr Orland Park is located in Orland Park, Illinois.
Here are the financial assistance programs available to residents in Illinois.

Get Financial aid guidance

Community Care Program

Illinois CCP

Age 60+
General Illinois resident, at risk of nursing home placement.
Income Limits (2025) ~$1,215/month individual
Asset Limits $17,500 individual, excludes home, car
IL

High demand in urban areas; waitlists possible.

Benefits
In-home care (3-5 hours/day) Adult day services ($65/day) Emergency home response systems ($30/month)

Illinois Respite Program

IL Respite (via NFCSP)

Age Caregiver of someone 60+ (or with dementia)
General Illinois resident.
Income Limits No strict limit; prioritizes low-income.
Asset Limits Not applicable.
IL

Limited slots; urban/rural balance.

Benefits
In-home respite (4-6 hours/day) Adult day care (~$65/day) Short-term facility care (up to 5 days)

Supportive Living Program (SLP)

Illinois Medicaid Supportive Living Program

Age 65+ or 22-64 with disability
General Illinois resident, Medicaid-eligible, needs moderate assistance (not nursing home-level).
Income Limits (2025) ~$2,829/month (300% FBR, individual); QIT allowed.
Asset Limits $2,000 (individual), $3,000 (couple) (excludes home, car).
IL

~200 SLP sites statewide; room/board not covered.

Benefits
Personal care (5-7 hours/day, e.g., bathing, mobility) Meals Housekeeping Medication management Respite (~240 hours/year)

Persons Who Are Elderly Waiver

Illinois Medicaid Elderly Waiver

Age 65+
General Illinois resident, Medicaid-eligible, nursing home-level care need.
Income Limits (2025) ~$2,829/month 300% FBR, individual
Asset Limits $2,000 (individual), $3,000 (couple).
IL

Part of HealthChoice Illinois; consumer-directed options available.

Benefits
Personal care (5-7 hours/day, e.g., dressing, eating) Homemaker Adult day care (~$60/day) Respite (240 hours/year) Home mods ($1,000 avg.)

Medicare Savings Program (MSP)

Illinois Medicare Savings Program

Age 65+ or disabled
General Illinois resident, Medicare Part A/B.
Income Limits (2025) ~$2,510/month (QMB), ~$3,380/month (SLMB), ~$3,598/month (QI)—individual.
Asset Limits $9,430 (individual), $14,130 (couple).
IL

Three tiers; no waitlist.

Benefits
Covers Part B premiums ($174.70/month) Deductibles ($240/year) Copays (~20%)

Optional State Supplementation (OSS)

Illinois Optional State Supplementation

Age 65+ or disabled
General Illinois resident, in approved facility, SSI recipient or low-income.
Income Limits (2025) ~$1,004/month including SSI
Asset Limits $2,000 (individual), $3,000 (couple).
IL

~$50-$500/month based on facility type.

Benefits
Cash (~$50-$500/month) for room/board in personal care homes or SLFs

VA Aid and Attendance (A&A) and Housebound Benefits

Illinois VA Aid and Attendance/Housebound

Age 65+ or disabled veteran/spouse
General Illinois resident, wartime service, need for ADL help (A&A) or homebound.
Income Limits (2025) Net income < ~$1,984/month (veteran with dependent, A&A); pension offsets income.
Asset Limits ~$155,356 net worth limit
IL

High veteran demand in urban/rural areas.

Benefits
Cash (~$1,433-$2,642/month veteran, ~$951-$1,318 spouse) for care costs (e.g., in-home, assisted living)

Frequently Asked Questions about Warren Barr Orland Park

What neighborhood is Warren Barr Orland Park in?

Warren Barr Orland Park is in the Orland Square Mall neighborhood.

Is Warren Barr Orland Park in a walkable area?

Warren Barr Orland Park has a walk score of 68. Moderately walkable. Some errands can be accomplished on foot, with a mix of nearby amenities.

What is the occupancy rate at Warren Barr Orland Park?

Warren Barr Orland Park's occupancy is 62.1%.

Are there photos of Warren Barr Orland Park?

Yes — there are 4 photos of Warren Barr Orland Park in the photo gallery on this page.

What is the address of Warren Barr Orland Park?

Warren Barr Orland Park is located at 14601 John Humphrey Dr, Orland Park, IL 60462.

What is the phone number of Warren Barr Orland Park?

(708) 349-8300 will put you in contact with the team at Warren Barr Orland Park.

Is Warren Barr Orland Park Medicare or Medicaid certified?

Yes — Warren Barr Orland Park is a CMS-certified provider of Medicare and Medicaid.

Guides for Better Senior Living

Care Cost Calculator: See Prices in Your Area

Nursing Home Data Explorer

Don’t Wait Too Long: 7 Red Flag Signs Your Parent Needs Assisted Living Now

The True Cost of Assisted Living in 2025 – And How Families Are Paying For It

Understanding Senior Living Costs: Pricing Models, Discounts & Financial Assistance