


Weatherly Inn Renton
Assisted Living, Nursing Home & Memory Care · Renton, WA


Weatherly Inn Renton
Assisted Living, Nursing Home & Memory Care · Renton, WA
Weatherly Inn Renton accepts Medicaid.
Overview of Weatherly Inn Renton
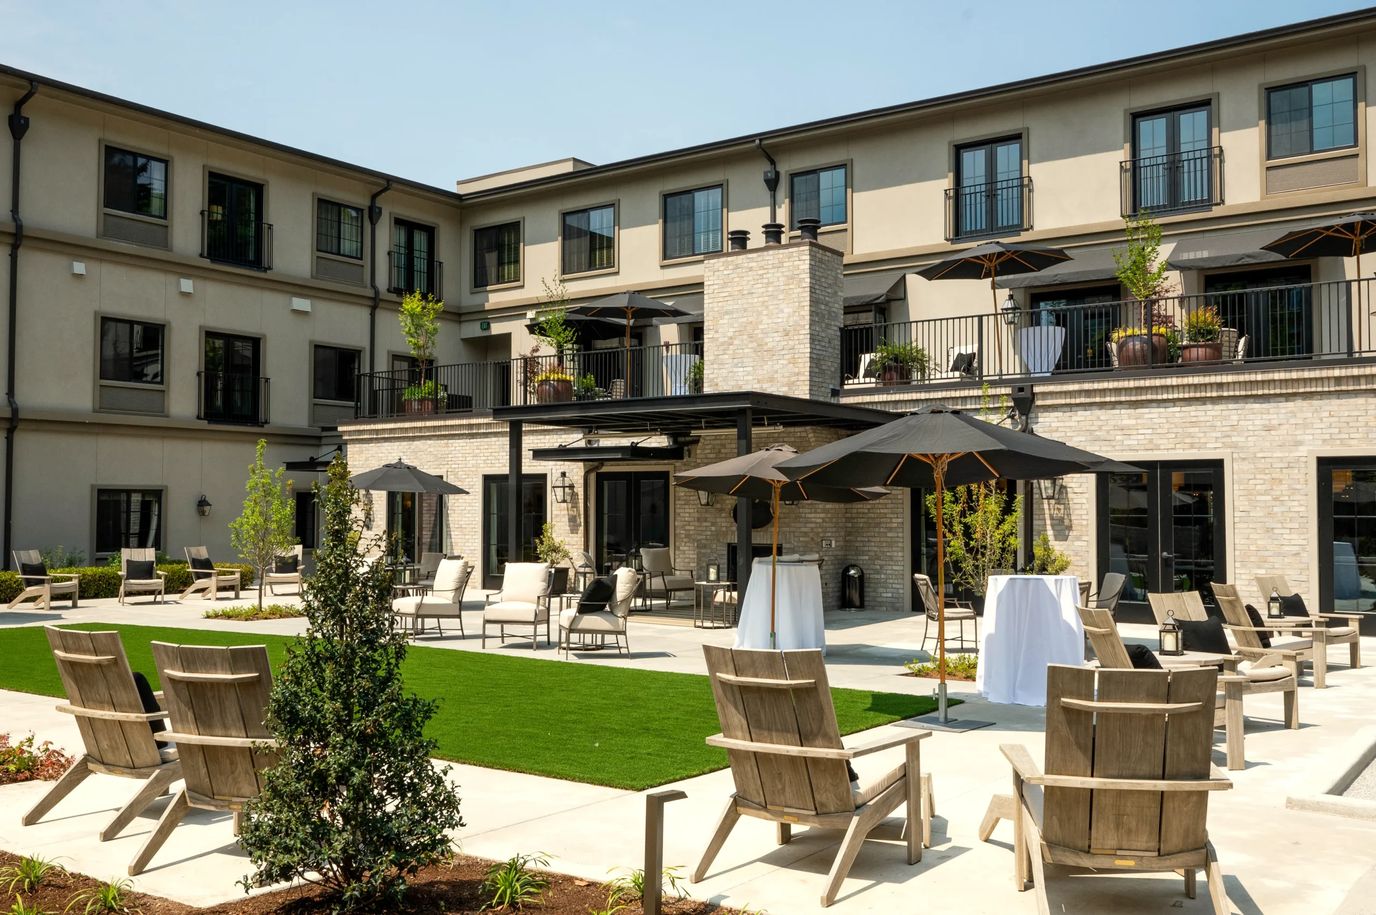
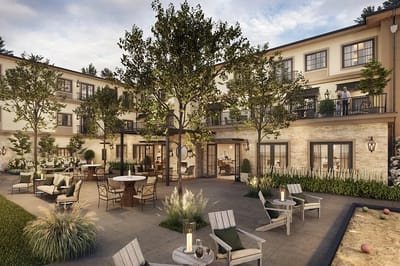
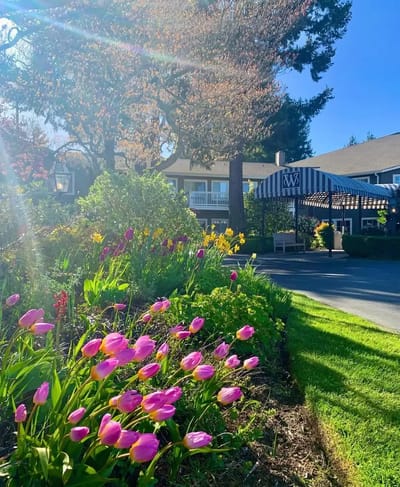
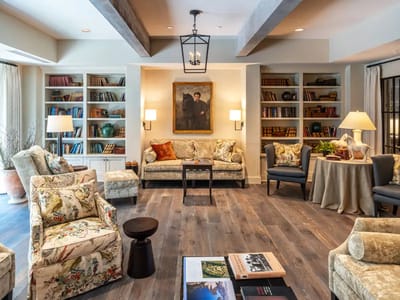
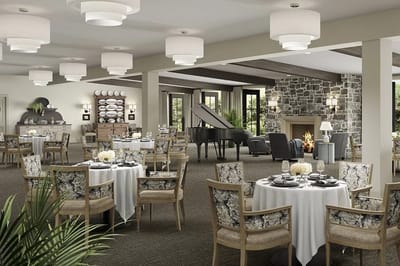
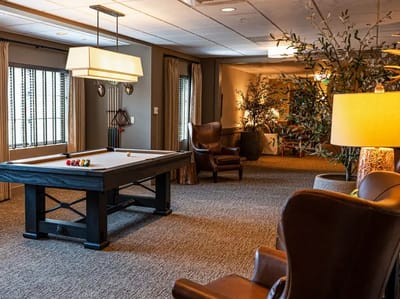
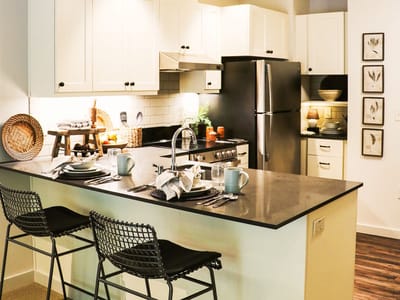
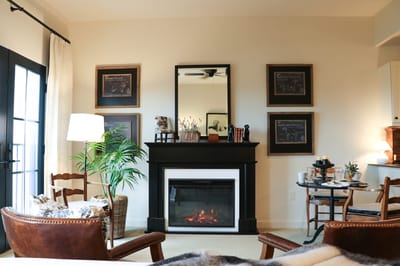
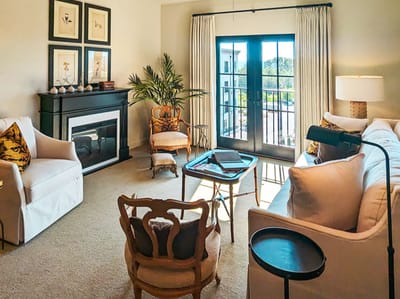
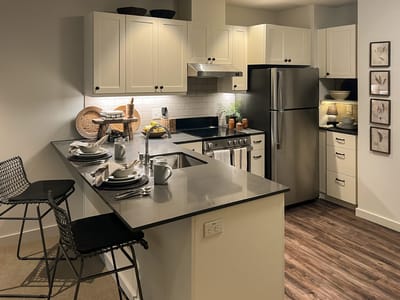
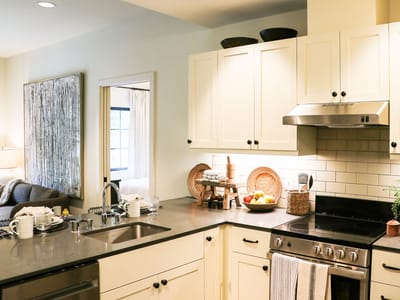
Located in the scenic Renton, Washington area, The Weatherly Inn’s Renton Community genuinely offers an exceptional living experience worth exploring, with a special focus on memory care and assisted living for seniors. Residents can select from spacious floor plans, such as studios, one-bedroom, or one-bedroom plus units, tailored to their preferences. This upscale community also radiates warmth and is thoughtfully designed to ensure not only security and comfort but also a posh environment for the ideal golden years.
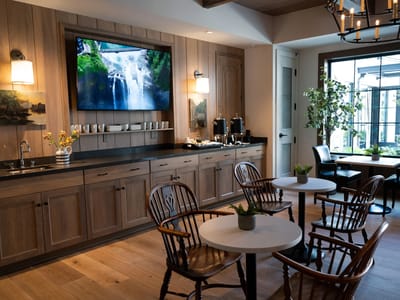
Personalized care is a top priority at Weatherly Inn. Licensed nurses are on hand 24/7 to offer the necessary support. Engaging outings, informative classes, lively parties, and festive holiday celebrations are also available, fostering a vibrant and enjoyable atmosphere for residents. Other services encompass diabetes management, housekeeping, dining services, social engagement opportunities, transportation for appointments, and assistance with dressing and grooming.
65-bed community Rank #216 / 357Bed count — State benchmarkedThis home is ranked 216th out of 357 homes in Washington for Bed Count. Shows this facility's certified or reported bed count compared to other Washington facilities. Larger communities may offer more amenities, programs, and on-site services for residents and families.Facilities with the same value for a metric share the same rank. Rankings are based only on facilities in Washington that report data for that category. Facilities without available data are excluded from the ranking.Click the rank badge to see the full State ranking.Click here to see the full State ranking.
A moderately sized community that may balance personal attention with shared amenities and social activities.
Walk Score: 27 / 100 Rank #489 / 626Walk Score — State benchmarkedThis home is ranked 489th out of 626 homes in Washington for Walk Score. Shows how walkable this facility's neighborhood is compared to the average Walk Score across Washington facilities. Higher scores benefit residents, families, and staff.Facilities with the same value for a metric share the same rank. Rankings are based only on facilities in Washington that report data for that category. Facilities without available data are excluded from the ranking.Click the rank badge to see the full State ranking.Click here to see the full State ranking.
Somewhat walkable. A few nearby services may be reachable on foot, but most trips require transportation.
About this community
Best Retirement Living 2023, 2022, 2021
Best Wellness Services 2025
Best Senior Living Community 2025, 2023, 2022, 2021
Finest Retirement Home/Services 2024
Facility TypeBoarding Home
StatusOperating
ExpirationAugust 31, 2026
CountyKing
License Number2670
Wheelchair Accessible
Emergency Systems24/7 security and emergency response system.
Safety FeaturesGrab bars in bathrooms, night-light/safety light, pull cords/emergency buttons.
Staffing
Key information about the people who lead and staff this community.
ContactLynn, Alexander (per state records, record updated Jul 2026)
Rehabilitation Services
Respite Care
Nursing Services
24-Hour Staffing
HousekeepingYes
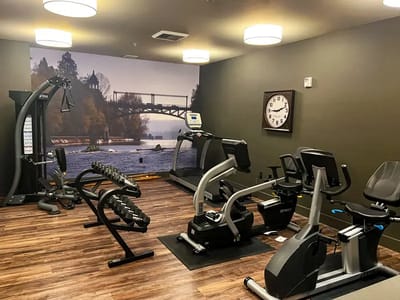
Fitness Center
Library
Salon
Landscaped Courtyards
Transportation To Medical Appointments
Housekeeping
Laundry Services
Individualized Care Plans
Activities
Religious ServicesChapel services weekly
Studio$3,900 per month
1BR$5,850 per month
2BR$8,400 per month
Inspection History
In Washington, the Department of Social and Health Services, Residential Care Services conducts unannounced inspections and issues reports on the quality of care in all licensed settings.
What does this home offer?
No pets allowed
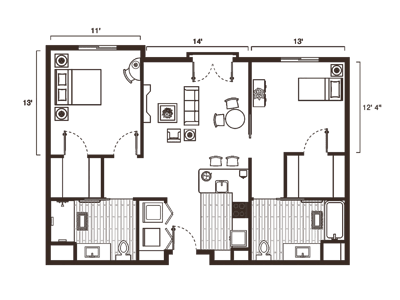
Housing Options: Studio / 1 Bed / 2 Bed
Building Type: 3-story
Beauty Services
Transportation Services
Housekeeping Services
Social and Recreational Activities
Exercise Programs
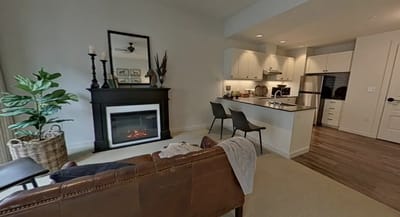
Living Spaces & Floor Plans for Weatherly Inn Renton
Places of interest near Weatherly Inn Renton
![]() 2.8 miles from city center
2.8 miles from city center
![]() Estimated distance in miles from Renton's city center to Weatherly Inn Renton's address, calculated via Google Maps.
Estimated distance in miles from Renton's city center to Weatherly Inn Renton's address, calculated via Google Maps.
Calculate Travel Distance to Weatherly Inn Renton
Add your location
Financial Assistance for
Assisted Living in Washington
Weatherly Inn Renton is located in S Renton, Washington State.
Here are the financial assistance programs available to residents in Washington State.
Frequently Asked Questions about Weatherly Inn Renton
What neighborhood is Weatherly Inn Renton in?
Weatherly Inn Renton is in the Talbot Road South neighborhood of Renton.
Is Weatherly Inn Renton in a walkable area?
Weatherly Inn Renton has a walk score of 27. Somewhat walkable. A few nearby services may be reachable on foot, but most trips require transportation.
What is the license number of Weatherly Inn Renton?
According to WA state health department records, Weatherly Inn Renton's license number is 2670.
When does Weatherly Inn Renton's license expire?
According to WA state health department records, Weatherly Inn Renton's license expires on August 31, 2026.
Does Weatherly Inn Renton have different floorplan options?
Yes — see the floorplan options available at Weatherly Inn Renton on this page.
Are pets allowed at Weatherly Inn Renton?
No, Weatherly Inn Renton has a no-pet policy.
How many beds does Weatherly Inn Renton have?
Weatherly Inn Renton has 65 beds.
Guides for Better Senior Living
Care Cost Calculator: See Prices in Your Area
Nursing Home Data Explorer
Don’t Wait Too Long: 7 Red Flag Signs Your Parent Needs Assisted Living Now
The True Cost of Assisted Living in 2025 – And How Families Are Paying For It
Understanding Senior Living Costs: Pricing Models, Discounts & Financial Assistance
Updated on
