


Total staff
141
Employees
118
Contractors
23
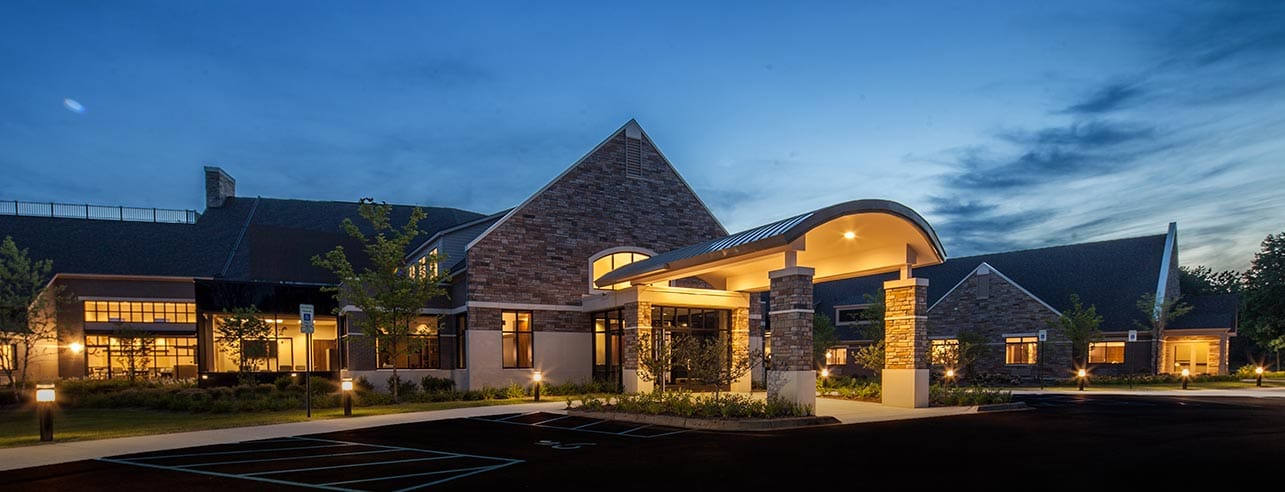
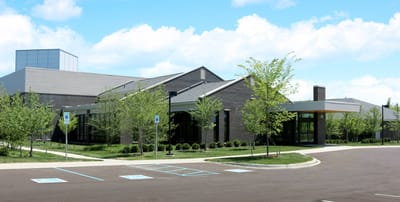
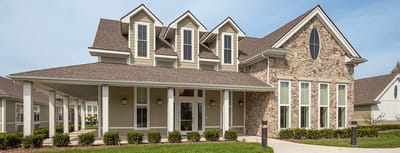
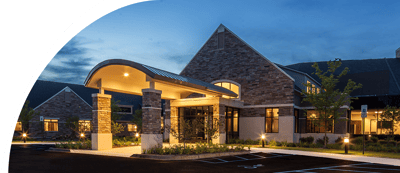
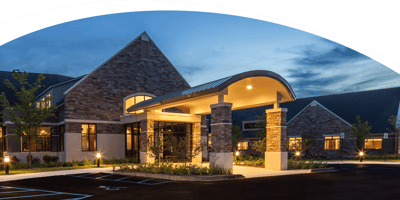
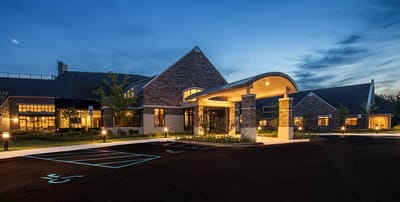

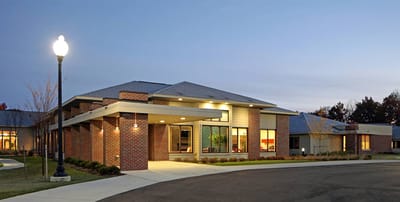
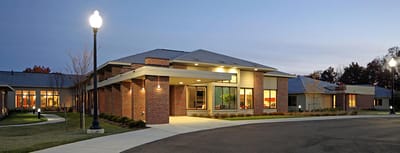
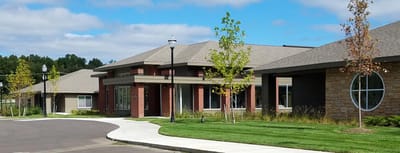
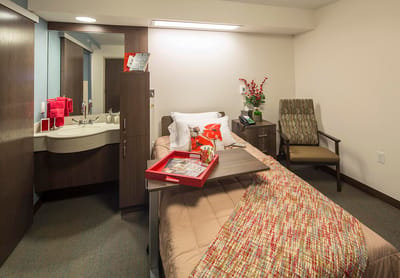
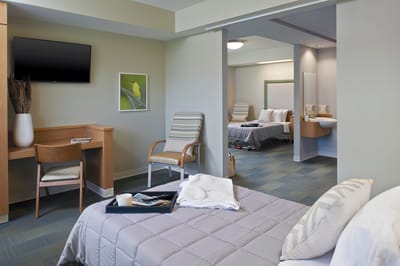


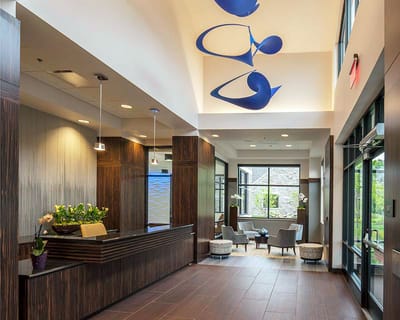


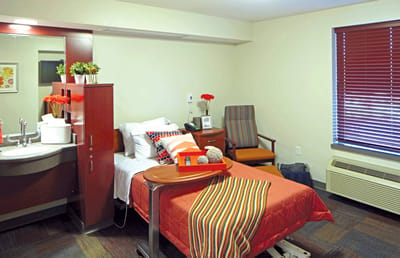


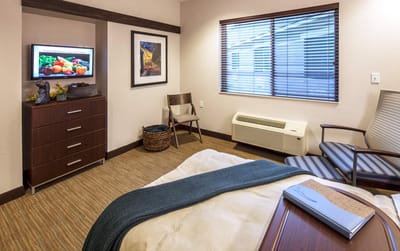
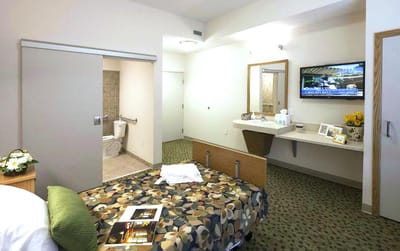


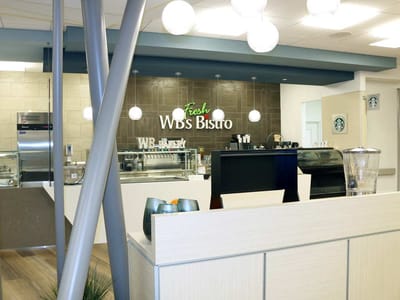
WellBridge of Novi is a nursing home in Novi, MI, that focuses on long-term care. Featuring hotel-style amenities in a nurturing setting, the community ensures older adults’ comfort. Complex medical services, social activities, and nutritional management are among the excellent services provided to improve residents’ living experiences. The community also works closely with residents to get to know their needs and habits, ensuring they receive the best possible care for their recovery.
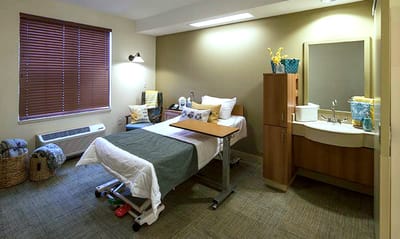
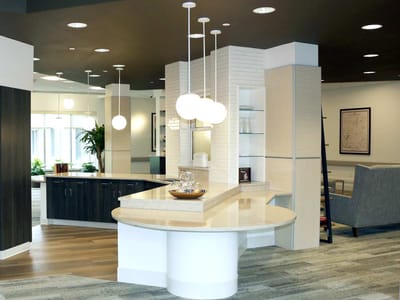
Social events, religious programs, and light exercises help enhance residents’ social, emotional, and mental well-being. With cozy common areas and spacious accommodations, residents can rest and freely interact with their surroundings. Henry Ford Providence Novi Hospital, parks, and shops are also available in the area, providing residents with quick access to necessities and leisure. This nursing home has high standards of care dedicated to older adults’ welfare, making it a good option for senior living in Michigan.
| Staff type | Hours / Day / Resident | vs state avg |
|---|---|---|
|
Registered Nurse (RN)
| 47m per day | ■ Avg State avg: 46m per day · National avg: 41m per day |
|
LPN / LVN
| 1h 14m per day | ▲ 39% State avg: 53m per day · National avg: 52m per day |
|
Nurse Aide
| 2h 21m per day | ■ Avg State avg: 2h 20m per day · National avg: 2h 20m per day |
|
Weekend Total Nursing
| 3h 48m per day | ▲ 8% State avg: 3h 31m per day · National avg: 3h 27m per day |
|
Physical Therapist
| 7m per day | ▲ 64% State avg: 4m per day · National avg: 4m per day |
|
Weekend RN
| 25m per day | ▼ 14% State avg: 29m per day · National avg: 29m per day |
Reporting period: October 1 – December 31, 2025 (Q4 2025). Source: CMS Payroll-Based Journal report.
Manages medical care and health needs.
Assists with medical care and medications.
Helps with daily care and mobility.
Total hours from contractors
4,789 contractor hours this quarter
| Certified Nursing Assistant | 59 | 0 | 59 | 19,299 | 92 | 100% | 7.8 |
| Licensed Practical Nurse | 31 | 0 | 31 | 10,172 | 92 | 100% | 9 |
| Registered Nurse | 15 | 0 | 15 | 4,924 | 92 | 100% | 8.8 |
| Speech Language Pathologist | 0 | 3 | 3 | 1,177 | 79 | 86% | 7.8 |
| Physical Therapy Aide | 0 | 6 | 6 | 1,155 | 86 | 93% | 7.5 |
| Mental Health Service Worker | 3 | 0 | 3 | 1,150 | 79 | 86% | 7 |
| Other Dietary Services Staff | 3 | 0 | 3 | 1,061 | 92 | 100% | 7.6 |
| Physical Therapy Assistant | 0 | 3 | 3 | 1,019 | 78 | 85% | 7.8 |
| Clinical Nurse Specialist | 2 | 0 | 2 | 983 | 68 | 74% | 8.6 |
| Occupational Therapy Aide | 2 | 0 | 2 | 936 | 64 | 70% | 8 |
| Respiratory Therapy Technician | 0 | 5 | 5 | 928 | 89 | 97% | 5.4 |
| Administrator | 1 | 0 | 1 | 512 | 64 | 70% | 8 |
| Nurse Practitioner | 1 | 0 | 1 | 512 | 64 | 70% | 8 |
| Dietitian | 1 | 0 | 1 | 496 | 62 | 67% | 8 |
| Qualified Social Worker | 0 | 3 | 3 | 395 | 62 | 67% | 6.4 |
| Feeding Assistant | 0 | 1 | 1 | 56 | 7 | 8% | 8 |
| Occupational Therapy Assistant | 0 | 1 | 1 | 38 | 6 | 7% | 6.3 |
| Medical Director | 0 | 1 | 1 | 22 | 10 | 11% | 2.2 |
Includes penalties issued in 2025
Federal penalties imposed by CMS for regulatory violations, including civil money penalties (fines) and denials of payment for new Medicare/Medicaid admissions.
Source: CMS Penalties Database (Data as of Jan 2026)
Michigan average: $76K
Michigan average: 2.0
Michigan average: 0.8
Penalties are imposed by CMS for violations of federal nursing home regulations.
1 penalty in the past 3 years
May 30, 2025 · $207K
Last updated: Jan 2026
These measures show how residents usually do over time at this home, based on health outcomes and preventive care.
Michigan average: 8.4
Michigan average: 16.3
Michigan average: 12.5%
Michigan average: 15.3%
Michigan average: 21.0%
Michigan average: 3.2%
Michigan average: 5.7%
Michigan average: 1.7%
Michigan average: 5.7%
Michigan average: 3.9%
Michigan average: 15.0%
Michigan average: 94.9%
Michigan average: 95.0%
Michigan average: 82.5%
Michigan average: 1.4%
Michigan average: 79.5%
Quality measures are calculated from Minimum Data Set (MDS) assessments. For most measures, lower percentages indicate better care quality.
39% of new residents, usually for short-term rehab.
54% of new residents, often for short stays.
7% of new residents, often for long-term daily care.
Source: CMS Long-Term Care Facility Characteristics (Data as of Jan 2026)
Residents meet regularly to discuss policies, care quality, and activities
Organized group of residents that meets regularly to discuss facility policies, quality of life, and activities.
Data sourced from CMS Long-Term Care Facility Characteristics quarterly report. Payer mix reflects the current resident census by primary payment source.
Historical financial and operational data for WellBridge of Novi from 2015–2023, based on CMS SNF Cost Reports.
Key figures below are for fiscal year ending in 12/2023.
Based on CMS SNF Cost Report for fiscal year ending in 12/2023.
No pets allowed
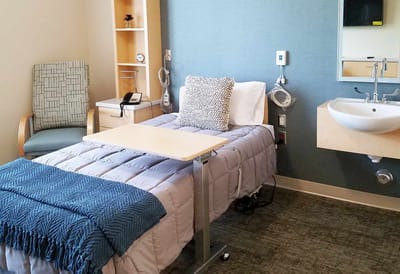
Housing Options: Private Suites
Building Type: Single-story
Beauty Services
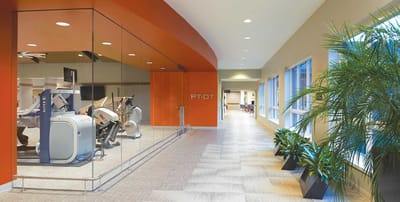
Rehabilitative Support
Social and Recreational Activities

On-site Medical Care and Health Services
This home supports both short-term rehab and long-term care, with residents staying for a wide range of durations.
Most new residents arrive under private pay (54% of admissions), and a typical private pay stay runs around 18 days.
Coverage residents most often arrive under.
Coverage residents most often leave under.
![]() 2.8 miles from city center
2.8 miles from city center
![]() Estimated distance in miles from Novi's city center to WellBridge of Novi's address, calculated via Google Maps.
Estimated distance in miles from Novi's city center to WellBridge of Novi's address, calculated via Google Maps.
Add your location
Info below is compiled from CMS reports & the MI Licensing & Regulatory Affairs (LARA), senior community websites & trusted data sources such as Walk Score & BBB.
Communities are listed from highest to lowest based on our ranking methodology.
| Maple Manor Rehab Center of Novi | NH SNF | Novi | 72
Facility
72
MI AVG
74
Rank
#200 / 430 |
84.4%
Facility
84.4%
MI AVG
74
Rank
#50 / 119 | +14% | 4.79 | -53% | +12% | $0 | 30 | 10.0 | - | 61 | - |
34
Facility
34
MI AVG
39
Rank
#379 / 703 | - | $11.6MFiscal year ending 12/2023 | $5.4MFiscal year ending 12/2023 | 46.3%Fiscal year ending 12/2023 | 235669 | ||||
| The Manor of Novi | NH | Novi | 130
Facility
130
MI AVG
74
Rank
#55 / 430 |
76.0%
Facility
76.0%
MI AVG
74
Rank
#70 / 119 | +3% | 3.96 | -49% | -8% | $67.5k | 52 | 7.4 | 2 | 99 | - |
59
Facility
59
MI AVG
39
Rank
#137 / 703 | Andrea Maggard | $14.5MFiscal year ending 12/2023 | $7.9MFiscal year ending 12/2023 | 54.2%Fiscal year ending 12/2023 | 235529 | ||||
| WellBridge of Novi | NH HOS SNF | Novi | 100
Facility
100
MI AVG
74
Rank
#127 / 430 |
89.5%
Facility
89.5%
MI AVG
74
Rank
#41 / 119 | +21% | 4.73 | +4% | +10% | $134.4k | 35 | 3.9 | 6 | 90 | - |
6
Facility
6
MI AVG
39
Rank
#643 / 703 | Leeann Pennington | $10.5MFiscal year ending 12/2023 | $5.8MFiscal year ending 12/2023 | 55.5%Fiscal year ending 12/2023 | 235702 |
WellBridge of Novi is located in Novi, Michigan.
Here are the financial assistance programs available to residents in Michigan.
WellBridge of Novi has a walk score of 6. Car-dependent. Most errands require a car, with limited nearby walkable options.
WellBridge of Novi's occupancy is 70.2%.
No, WellBridge of Novi has a no-pet policy.
WellBridge of Novi is registered as a for-profit.
Yes — there are 45 photos of WellBridge of Novi in the photo gallery on this page.
WellBridge of Novi is located at 48300 W 11 Mile Rd, Novi, MI 48374.
(248) 662-2300 will put you in contact with the team at WellBridge of Novi.
Care Cost Calculator: See Prices in Your Area
Nursing Home Data Explorer
Don’t Wait Too Long: 7 Red Flag Signs Your Parent Needs Assisted Living Now
The True Cost of Assisted Living in 2025 – And How Families Are Paying For It
Understanding Senior Living Costs: Pricing Models, Discounts & Financial Assistance


