Wells Point Lodge
Nursing Home & Assisted Living · Pflugerville, TX
CMS overall rating Info CMS (the Centers for Medicare & Medicaid Services) is the federal agency that rates nursing home quality. Its Overall Rating runs from 1 to 5 stars, combining health inspections, staffing, and quality measures, with inspections weighted most heavily.

Wells Point Lodge

Nursing Home & Assisted Living · Pflugerville, TX
CMS overall rating Info CMS (the Centers for Medicare & Medicaid Services) is the federal agency that rates nursing home quality. Its Overall Rating runs from 1 to 5 stars, combining health inspections, staffing, and quality measures, with inspections weighted most heavily.
Calculator: See prices in your area
Wells Point Lodge accepts Medicare, Medicaid, and private pay.

Overview of Wells Point Lodge

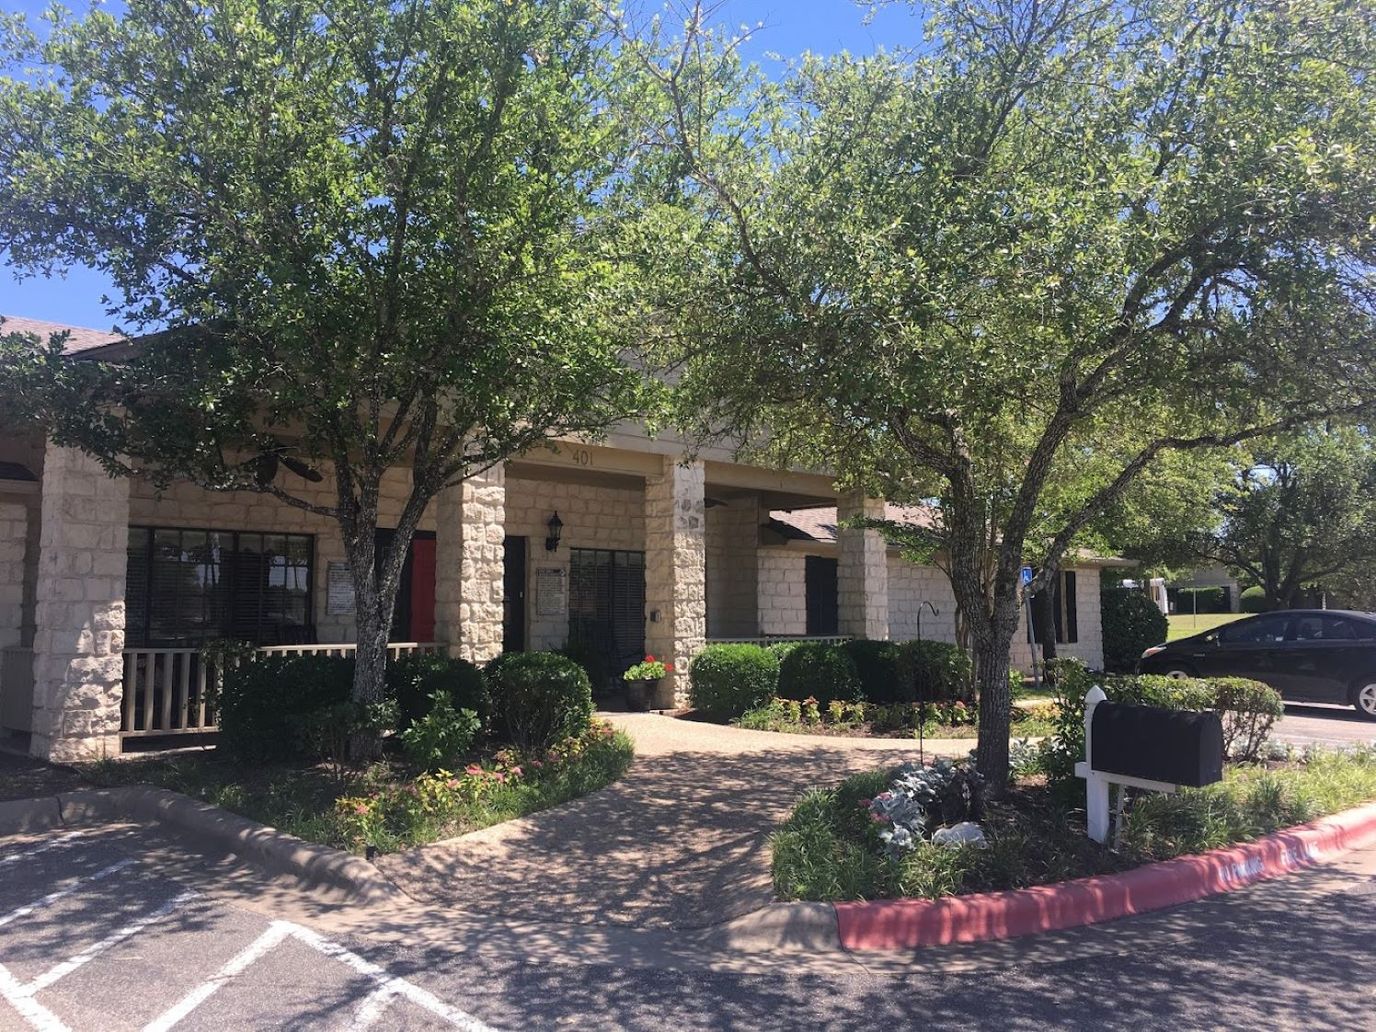
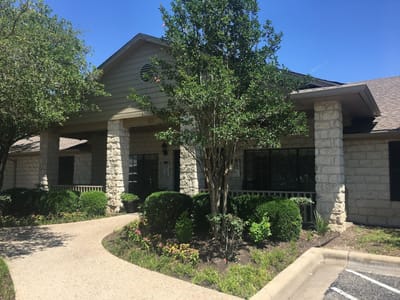
Residing in the peaceful residential area of South Heatherwilde Boulevard, Pflugerville, TX, Wells Point Lodge is a distinguished senior living community that provides assisted living. The community strives to create a haven for seniors to enjoy their golden years surrounded by snug and sophisticated accommodations. With a team of responsive and highly skilled professionals caring for daily living activities, seniors enjoy a worry-free lifestyle and retain their independence.

Celebrate mundane moments with a full calendar of engaging events and wellness programs that aim to keep residents happy and well-connected. Here, residents have a delightful dining experience with delicious and nutritious meals catering to dietary needs and tastes. Wells Point Lodge is ideal for seniors looking for assistance to get through their days without hassles.

(512) 251-1640

Quality ratings

Measured by Centers for Medicare & Medicaid Services (CMS)

Overall rating Info The Overall CMS Rating combines results from health inspections, staffing levels and quality measures. Health inspections carry the most weight. Staffing and quality scores can increase or decrease the final rating based on performance compared to state and national standards.
▼ 64.2% Below TX avg. ▼ 64.2% Below TX avg.TX average: 2.8Click the badge to see the full State ranking.Click here to see the full State ranking.
Health Inspection Info Based on the results of the facility's three most recent standard inspections and any complaint investigations. CMS reviews the number, scope, and severity of deficiencies, with more recent findings weighted more heavily.
▼ 27.6% Below TX avg. ▼ 27.6% Below TX avg.TX average: 2.8Click the badge to see the full State ranking.Click here to see the full State ranking.
Staffing Info Measures average nursing staff hours per resident per day, including Registered Nurses (RNs) and total nursing staff. Ratings are adjusted based on the level of care residents require and are compared to state and national benchmarks.
▼ 52.9% Below TX avg. ▼ 52.9% Below TX avg.TX average: 2.1Click the badge to see the full State ranking.Click here to see the full State ranking.
Quality Measures Info Based on clinical and physical health indicators reported to CMS, such as hospital readmissions, falls, pressure ulcers, and improvements in mobility. These measures reflect how well residents' health needs are being managed.
▲ 6.5% Above TX avg. ▲ 6.5% Above TX avg.TX average: 3.8Click the badge to see the full State ranking.Click here to see the full State ranking.

Staffing hours breakdown

Info Daily nursing hours per resident by staff type, reported to CMS. Higher is generally better — compare this facility to state and national averages to see where staffing stands.

Hours per resident per day — compared to Texas state averages

Total nursing care / resident Info This home is ranked 191st out of 296 homes in Texas for nurse hours. Total adjusted nursing hours per resident per day, combining RN, LPN, and aide time. CMS adjusts this for case-mix so facilities can be fairly compared.
3h 15m per day
Rank #191 / 296Nurse hours — State benchmarkedThis home is ranked 191st out of 296 homes in Texas. Shows adjusted nurse hours per resident per day benchmarked to the Texas average, with a ranking across 296 Texas facilities. More hours mean more direct care. The national average is about 3.5 hrs; below 3.0 is a red flag.Ranking totals vary by category as each rank only includes facilities that report data for that metric. Homes missing that data point aren't included in the ranking.Click the rank badge to see the full State ranking.Click here to see the full State ranking.
This facility Texas avg (3h 38m per day)
vs Texas avg
-10%

6 of 6 metrics below state avg

Staff typeHours / Day / Residentvs state avg
Registered Nurse (RN) Info RNs hold the highest nursing license and can assess residents, interpret test results, and direct care plans. More RN hours per day often signals stronger clinical oversight and faster response to health changes. 15m per day ▼ 40% State avg: 25m per day · National avg: 41m per day
LPN / LVN Info Licensed Practical Nurses (LPNs) or Licensed Vocational Nurses (LVNs) deliver routine hands-on care — medication administration, wound dressing, and monitoring vital signs. They work under RN supervision and make up a large share of daily bedside care. 50m per day ▼ 12% State avg: 57m per day · National avg: 52m per day
Nurse Aide Info Certified Nurse Aides (CNAs) provide the most direct day-to-day assistance: bathing, dressing, feeding, and mobility. Nurse aide hours are typically the largest staffing category and directly affect residents' quality of life. 1h 57m per day ▼ 4% State avg: 2h 1m per day · National avg: 2h 20m per day
Weekend Total Nursing Info Combined nursing hours (RN + LPN + Nurse Aide) per resident per day on weekends. Staffing often drops on weekends — this figure reveals whether the facility maintains adequate coverage outside of weekday hours. 2h 42m per day ▼ 10% State avg: 3h 0m per day · National avg: 3h 27m per day
Physical Therapist Info Hours per resident per day provided by licensed Physical Therapists (PTs) or PT Assistants. PT services help residents recover mobility after injury or illness and are especially important for post-acute (short-stay) rehabilitation. 1m per day ▼ 73% State avg: 4m per day · National avg: 4m per day
Weekend RN Info Registered nurse hours specifically on weekends. Facilities sometimes reduce RN presence on Saturdays and Sundays — a low weekend RN figure compared to weekday hours can indicate reduced clinical oversight when most administrative staff are absent. 11m per day ▼ 46% State avg: 20m per day · National avg: 29m per day

Capacity and availability

Avg. Length of Stay
176 days
Bed community size
40-bed community Rank #743 / 988Bed count — State benchmarkedThis home is ranked 743rd out of 988 homes in Texas. Shows this facility's certified or reported bed count compared to other Texas facilities. Larger communities may offer more amenities, programs, and on-site services for residents and families.Ranking totals vary by category as each rank only includes facilities that report data for that metric. Homes missing that data point aren't included in the ranking.Click the rank badge to see the full State ranking.Click here to see the full State ranking.
A moderately sized community that may balance personal attention with shared amenities and social activities.
Years in operation
30 years in operation Rank #144 / 583Years in operation — State benchmarkedThis home is ranked 144th out of 583 homes in Texas. Shows how long this facility has been in operation compared to other Texas facilities. Longer operating histories may benefit residents, families, and staff.Ranking totals vary by category as each rank only includes facilities that report data for that metric. Homes missing that data point aren't included in the ranking.Click the rank badge to see the full State ranking.Click here to see the full State ranking.
A longer operating history, which may indicate experience navigating regulations and delivering ongoing care.
Walk Score
Walk Score: 51 / 100 Rank #483 / 1391Walk Score — State benchmarkedThis home is ranked 483rd out of 1391 homes in Texas. Shows how walkable this facility's neighborhood is compared to the average Walk Score across Texas facilities. Higher scores benefit residents, families, and staff.Ranking totals vary by category as each rank only includes facilities that report data for that metric. Homes missing that data point aren't included in the ranking.Click the rank badge to see the full State ranking.Click here to see the full State ranking.
Moderately walkable. Some errands can be accomplished on foot, with a mix of nearby amenities.

About this community

Occupancy

Occupancy rate
67%
Rank #155 / 304Occupancy rate — State benchmarkedThis home is ranked 155th out of 304 homes in Texas. Shows this facility's occupancy rate versus the Texas average, with its Statewide rank out of 304. Higher occupancy signals strong local demand and financial stability.Ranking totals vary by category as each rank only includes facilities that report data for that metric. Homes missing that data point aren't included in the ranking.Click the rank badge to see the full State ranking.Click here to see the full State ranking.
Higher than the Texas average: 63.5%
Occupied beds
27 / 40
Average occupied beds in Texas homes 75 beds

License Details

Facility TypeType B
StatusLicensed
ExpirationApril 7, 2027
CountyTravis
License Number307704

Ownership & Operating Entity

Wells Point Lodge is legally operated by Pf Senior Living Llc, and administrated by Rosemary Drake.

Management CompanyRSL HEALTHCARE MANAGEMENT LLC
OwnerPF SENIOR LIVING LLC
Ownership TypeLimited Liability Company (LLC)

Staffing

Key information about the people who lead and staff this community.

Leadership

ContactOwner/Manager, Owner/Manager

Payment & Insurance

1 service
Does not accept Medicare

Staffing & Medical

2 services
Licensed Nurses/CNAs
24-Hour Staffing

Memory & Specialized Care

1 service
No Alzheimer's certification
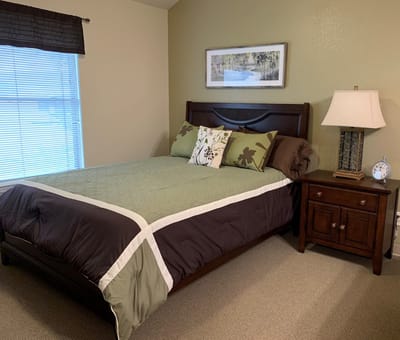
Amenities & Lifestyle

Private Apartments
24/7 Staffing
Weekly Housekeeping
Scheduled Transportation
On-Site Salon

Dining & Nutrition

Food DescriptionThree homemade delicious and nutritious meals every day.

Contact Wells Point Lodge

Inspection History

In Texas, the Health and Human Services Commission (HHSC) is the primary regulatory body that conducts unannounced inspections and publishes quality reports for all long-term care homes.

Since 2022 · 4 years of data 2 enforcement actions 3 citations 2 inspections

Enforcement Actions Info Enforcement actions are formal penalties or interventions imposed by Texas regulators when an assisted living residence fails to meet state care, safety, or regulatory standards. They may include stipulations and orders, civil monetary penalties, operational restrictions, or appointment of temporary management.

Since 2022
2 enforcement actions
  • April 6, 2025 Administrative Penalty
  • November 13, 2023 Administrative Penalty

Inspection Scorecard Info This scorecard compares key inspection, citation, and complaint metrics at this facility against the Texas state average. Metrics rated ≥15% worse than average are highlighted in red; those ≥15% better are highlighted in green.

Since 2022 vs. Texas state average
Overall vs. TX average 1 Worse Metrics worse than Texas average:
• Inspections with citations (100% above)
4 Better Metrics better than Texas average:
• Total citations (50% below)
• Health citations (50% below)
• Life safety citations (67% below)
• Citations per year (47% below)
Latest Inspection March 4, 2022 Other An inspection that falls outside standard annual surveys and formal complaint investigations. May include administrative compliance checks, documentation reviews, focused surveys on specific concerns, or revisit surveys to verify prior corrections.

Citations Info Citations are formal regulatory issues recorded during state inspections.

This FacilityTX Averagevs. TX Avg
Total citations Info Formal regulatory issues recorded by inspectors across all inspection types. 36 This facility has 50% fewer total citations than a typical Texas assisted living residence (3 vs. TX avg 6).↓ 50% better
Health citations Info Violations related to resident care, clinical practices, and day-to-day operations. 12 This facility has 50% fewer health citations than a typical Texas assisted living residence (1 vs. TX avg 2).↓ 50% better
Life safety citations Info Violations related to building safety — fire prevention, emergency egress, and similar. 26 This facility has 67% fewer life safety citations than a typical Texas assisted living residence (2 vs. TX avg 6).↓ 67% better
Citations per year Info Average citations per year since 2022. 0.81.5 This facility has 47% fewer citations per year than a typical Texas assisted living residence (0.8 vs. TX avg 1.5).↓ 47% better

Inspections Info State inspections evaluate whether the facility meets health and safety standards.

This FacilityTX Averagevs. TX Avg
Inspections with citations Info Inspections that resulted in at least one regulatory citation. 21 This facility has 100% more inspections with citations than a typical Texas assisted living residence (2 vs. TX avg 1).↑ 100% worse

Inspection Reports Summary Info An editor-reviewed summary of the themes and findings across this facility's recent inspection reports.

  • Wells Point Lodge underwent a comprehensive inspection on March 04, 2022, resulting in three state standard violations. The facility was cited for two Life Safety Code deficiencies: the fire alarm and smoke detection system was not compliant with licensing standards (corrected by September 3, 2018), and the required sprinkler system was not inspected, tested, and maintained as per NFPA 25 standards (corrected by August 17, 2018). No Health Code violations were listed during this inspection. The facility had a history of Life Safety Code deficiencies prior to March 2022. Enforcement actions were taken against Wells Point Lodge, including two administrative penalties: one on November 13, 2023, for failing to make arrangements for emergency care or transfer (resulting in a $2250 fine), and another on June 4, 2025, for insufficient staff to provide required supervision and care (also resulting in a $2250 fine).

Health Inspection History

Inspections since 2023
Total health inspections 18

Texas average 7.4


Last Health inspection on Jun 2025

Total health citations
45 Rank #264 / 299Health citations — State benchmarkedThis home is ranked 264th out of 299 homes in Texas. Shows this facility's total health deficiency citations benchmarked to the Texas State average, with a ranking across all 299 TX facilities. Lower citation counts earn a better rank.Ranking totals vary by category as each rank only includes facilities that report data for that metric. Homes missing that data point aren't included in the ranking.Click the rank badge to see the full State ranking.Click here to see the full State ranking.

Texas average 25.9

Citations per inspection
2.5 Rank #64 / 299Citations per inspection — State benchmarkedThis home is ranked 64th out of 299 homes in Texas. Shows average deficiency citations per CMS inspection for this facility versus the Texas mean across 299 facilities with citation data. Lower is better.Ranking totals vary by category as each rank only includes facilities that report data for that metric. Homes missing that data point aren't included in the ranking.Click the rank badge to see the full State ranking.Click here to see the full State ranking.

Texas average 3.67


Health citations are formal notices following inspections when they fail to comply with safety and care standards.

24 of 45 citations resulted from standard inspections; 20 of 45 resulted from complaint investigations; and 1 of 45 came from combined inspections (standard and complaint).

Breakdown of citation severity (last 3 years)
Critical health citations
5
150% worse than Texas average

Texas average: 2


Serious health citations
5
1150% worse than Texas average

Texas average: 0.4

5 critical citations Texas average: 2

5 serious citations Texas average: 0.4

35 moderate citations Texas average: 23

0 minor citations Texas average: 0.4
Citations history (last 3 years)
Care Planning moderate citation Jun 05, 2025
Corrected

Resident Rights moderate citation Apr 17, 2025
Corrected

Infection Control moderate citation Mar 19, 2025
Corrected

Nutrition moderate citation Mar 19, 2025
Corrected

Staffing Data

Reporting period: October 1 – December 31, 2025 (Q4 2025). Source: CMS Payroll-Based Journal report.

Total staff 134
Employees 132
Contractors 2
Staff to resident ratio 1.52 : 1
0% compared with Texas average
Texas average ratio: 1.48 : 1 Texas average ratio: 1.48 : 1See full Texas ranking
Avg staff/day 43
Average shift 7.6 hours
6% worse than Texas average
Texas average: 8.1 hours Texas average shift: 8.1 hoursSee full Texas ranking
Total staff hours (quarter) 29,881

Nursing staff breakdown

Q4 2025 · Oct 1 – Dec 31 More info This data comes from the CMS Payroll-Based Journal report covering October 1 – December 31, 2025.
Registered Nurse

Manages medical care and health needs.

RN Staff Info All 10 RN Staff are full-time employees. No contractors work on this role. 10
Average shift length Info Average shift length. Calculated as total hours divided by days worked and average staff per day. 8.2 hours
Licensed Practical Nurse

Assists with medical care and medications.

LPN Staff Info All 28 LPN Staff are full-time employees. No contractors work on this role. 28
Average shift length Info Average shift length. Calculated as total hours divided by days worked and average staff per day. 7.8 hours
Certified Nursing Assistant

Helps with daily care and mobility.

CNA Staff Info All 52 CNA Staff are full-time employees. No contractors work on this role. 52
Average shift length Info Average shift length. Calculated as total hours divided by days worked and average staff per day. 7.2 hours

Contractor staffing

Q4 2025 · Oct 1 – Dec 31 More info This data comes from the CMS Payroll-Based Journal report covering October 1 – December 31, 2025.

Total hours from contractors

0.2%

54 contractor hours this quarter

Medical Director: 1 Occupational Therapy Aide: 1

Staff by category

Q4 2025 · Oct 1 – Dec 31 More info This data comes from the CMS Payroll-Based Journal report covering October 1 – December 31, 2025.
Certified Nursing Assistant5205213,18892100%7.2
Licensed Practical Nurse280286,22692100%7.8
Medication Aide/Technician120122,13192100%8.3
Nurse Aide in Training6061,3828795%7.3
Registered Nurse100101,3368997%8.2
RN Director of Nursing3039206571%7.6
Qualified Social Worker1015206571%8
Other Dietary Services Staff1015196773%7.7
Nurse Practitioner1015066672%7.7
Administrator1014886166%8
Physical Therapy Aide4044826470%7.4
Physical Therapy Assistant3034426470%6.9
Dietitian2024295762%7.5
Speech Language Pathologist2024125459%7.6
Clinical Nurse Specialist2023585358%6.8
Dental Services Staff2023364145%8.2
Respiratory Therapy Technician2021532224%6.9
Occupational Therapy Aide011481011%4.8
Medical Director011633%2
52 Certified Nursing Assistant
% of Days 100%
28 Licensed Practical Nurse
% of Days 100%
12 Medication Aide/Technician
% of Days 100%
6 Nurse Aide in Training
% of Days 95%
10 Registered Nurse
% of Days 97%
3 RN Director of Nursing
% of Days 71%
1 Qualified Social Worker
% of Days 71%
1 Other Dietary Services Staff
% of Days 73%
1 Nurse Practitioner
% of Days 72%
1 Administrator
% of Days 66%
4 Physical Therapy Aide
% of Days 70%
3 Physical Therapy Assistant
% of Days 70%
2 Dietitian
% of Days 62%
2 Speech Language Pathologist
% of Days 59%
2 Clinical Nurse Specialist
% of Days 58%
2 Dental Services Staff
% of Days 45%
2 Respiratory Therapy Technician
% of Days 24%
1 Occupational Therapy Aide
% of Days 11%
1 Medical Director
% of Days 3%

Penalties and fines

Includes penalties issued in 2023-2024

Federal penalties imposed by CMS for regulatory violations, including civil money penalties (fines) and denials of payment for new Medicare/Medicaid admissions.

Source: CMS Penalties Database (Data as of Jan 2026)

Total fines amount $90K Rank #216 / 301Federal fines — State benchmarkedThis home is ranked 216th out of 301 homes in Texas. Shows this facility's cumulative CMS federal fine dollars versus the Texas average among facilities with fines, and where it ranks among 301 facilities in the pool. Lower total dollars mean a better rank.Ranking totals vary by category as each rank only includes facilities that report data for that metric. Homes missing that data point aren't included in the ranking.Click the rank badge to see the full State ranking.Click here to see the full State ranking.
12% higher than Texas average

Texas average: $80K

Number of fines 7
182% more fines than Texas average

Texas average: 2.5

Payment Denials Info Serious action where Medicare and/or Medicaid temporarily stops payments for new residents until issues are fixed. 0
100% fewer payment denials than Texas average

Texas average: 0.2

Fines amount comparison
This facility $90K
Texas average $80K
Penalty History

Penalties are imposed by CMS for violations of federal nursing home regulations.

5 penalties in the past 3 years

Multiple penalties were reported in the last 3 years.

Civil Money Penalty Info Fines imposed for noncompliance, which can be assessed per day or per instance of violation. Dec 31, 2024
$17K
Civil Money Penalty Info Fines imposed for noncompliance, which can be assessed per day or per instance of violation. Dec 31, 2024
$17K
Civil Money Penalty Info Fines imposed for noncompliance, which can be assessed per day or per instance of violation. May 29, 2024
$418
Civil Money Penalty Info Fines imposed for noncompliance, which can be assessed per day or per instance of violation. Apr 18, 2024
$12K

Last updated: Jan 2026

Quality of care over time

These measures show how residents usually do over time at this home, based on health outcomes and preventive care.

High-risk clinical events score Info A composite score based on pressure ulcers, falls with injury, weight loss, walking ability decline, and activities of daily living decline. 8.8
In line with Texas average

Texas average: 8.6

Functional decline score Info A composite score based on activities of daily living decline, walking ability decline, and incontinence. 14.0
12% better than Texas average

Texas average: 16.0

Long-stay resident measures
Need for Help with Daily Activities Increased Info Percent of long-stay residents whose need for help with daily activities has increased 16.2%
In line with Texas average

Texas average: 16.2%

Walking Ability Worsened Info Percent of long-stay residents whose ability to move independently worsened 8.9%
45% better than Texas average

Texas average: 16.2%

Low Risk Residents with Bowel/Bladder Incontinence Info Percent of low risk long-stay residents who lose control of their bowels or bladder 17.0%
9% worse than Texas average

Texas average: 15.7%

Falls with Major Injury Info Percent of long-stay residents experiencing one or more falls with major injury 7.7%
138% worse than Texas average

Texas average: 3.2%

High Risk Residents with Pressure Ulcers Info Percent of long-stay high risk residents with pressure ulcers 2.6%
41% better than Texas average

Texas average: 4.4%

Urinary Tract Infection Info Percent of long-stay residents with a urinary tract infection 0.0%
100% better than Texas average

Texas average: 0.8%

Lost Too Much Weight Info Percent of long-stay residents who lose too much weight 8.7%
152% worse than Texas average

Texas average: 3.5%

Depressive Symptoms Info Percent of long-stay residents who have depressive symptoms 0.3%
88% better than Texas average

Texas average: 2.9%

Antipsychotic Use Info Percent of long-stay residents who received an antipsychotic medication 5.3%
33% better than Texas average

Texas average: 7.9%

Pneumococcal Vaccine Info Percent of long-stay residents assessed and appropriately given the pneumococcal vaccine 99.1%
In line with Texas average

Texas average: 97.3%

Influenza Vaccine Info Percent of long-stay residents assessed and appropriately given the seasonal influenza vaccine 100.0%
In line with Texas average

Texas average: 97.9%

Short-stay resident measures
Pneumococcal Vaccine Info Percent of short-stay residents assessed and appropriately given the pneumococcal vaccine 85.5%
5% worse than Texas average

Texas average: 90.4%

Antipsychotic medication increase Info Percent of short-stay residents who newly received an antipsychotic medication 0.0%
100% better than Texas average

Texas average: 1.4%

Influenza Vaccine Info Percent of short-stay residents assessed and appropriately given the seasonal influenza vaccine 86.7%
In line with Texas average

Texas average: 88.0%

Breakdown by payment type

Medicare

3% of new residents, usually for short-term rehab.

Typical stay 1 - 2 years

Private pay

40% of new residents, often for short stays.

Typical stay 11 - 12 months

Medicaid

58% of new residents, often for long-term daily care.

Typical stay 11 - 12 months

Facility Characteristics

Source: CMS Long-Term Care Facility Characteristics (Data as of Jan 2026)

Total residents 88
Medicare
6
6.8% of residents
Medicaid
63
71.6% of residents
Private pay or other
19
21.6% of residents
Programs & Services
Residents Group

Residents meet regularly to discuss policies, care quality, and activities

Active Resident Council

Organized group of residents that meets regularly to discuss facility policies, quality of life, and activities.

Finances and operations

Based on CMS SNF Cost Report for fiscal year ending in 09/2023.

Governmental community
Operated by county authorities.
Net patient revenue Info Net patient revenue — what the home actually collects for resident care, after contractual allowances, bad debt and discounts are subtracted from its gross charges (CMS cost report, Worksheet G-3). It covers resident care only; money the home earns from other sources is shown separately as "Other income."
$18.9M
Net patient income Info Net patient income: net patient revenue minus the home's total operating expenses. A positive figure means it earns more from resident care than it spends to deliver it; a negative figure means the opposite. It excludes non-operating "other income."
$410.8K
Governmental community Operated by county authorities.
Net patient revenue Info Net patient revenue — what the home actually collects for resident care, after contractual allowances, bad debt and discounts are subtracted from its gross charges (CMS cost report, Worksheet G-3). It covers resident care only; money the home earns from other sources is shown separately as "Other income."
$18.9M Rank #43 / 304Revenue — State benchmarkedThis home is ranked 43rd out of 304 homes in Texas. Shows this facility's annual revenue compared to the Texas average. Higher revenue generally means more resources for staffing and capital — read alongside Payroll %.Ranking totals vary by category as each rank only includes facilities that report data for that metric. Homes missing that data point aren't included in the ranking.Click the rank badge to see the full State ranking.Click here to see the full State ranking.
Net patient income Info Net patient income: net patient revenue minus the home's total operating expenses. A positive figure means it earns more from resident care than it spends to deliver it; a negative figure means the opposite. It excludes non-operating "other income."
$410.8K
Other income Info Money the home earns outside of resident care — such as investments, grants, rentals and other non-operating sources (CMS cost report, Worksheet G-3). It is tracked separately from net patient revenue: it is not part of that figure, and it is not included in net patient income.
$943.0K
Payroll costs Info Staff salaries plus wage-related costs — benefits such as payroll taxes, health insurance and retirement — from the home's own accounting records (CMS cost report, Worksheet A). Contract or agency labor is counted separately, under other operating costs. Rank #300 / 304Payroll — State benchmarkedThis home is ranked 300th out of 304 homes in Texas. Shows total annual staff payroll benchmarked to the Texas average. Higher payroll investment relative to peers often signals better staffing and less reliance on cheaper contract labor.Ranking totals vary by category as each rank only includes facilities that report data for that metric. Homes missing that data point aren't included in the ranking.Click the rank badge to see the full State ranking.Click here to see the full State ranking.
$1.6M 8.4% of net patient revenue Info Payroll as a share of revenue: staff salaries and wage-related benefits divided by net patient revenue. A higher figure means more of each revenue dollar goes to staff pay. Rank #303 / 304Payroll % — State benchmarkedThis home is ranked 303rd out of 304 homes in Texas. Shows payroll as a percentage of revenue versus the Texas average. Well-run Texas facilities typically land around 51–63% — the top third Statewide. Below 25% may signal understaffing or heavy agency use — read with Staffing ratings.Ranking totals vary by category as each rank only includes facilities that report data for that metric. Homes missing that data point aren't included in the ranking.Click the rank badge to see the full State ranking.Click here to see the full State ranking.
Other operating costs Info Everything it costs to run the home apart from payroll — food, utilities, supplies, maintenance, contract labor and administration. Calculated as total operating expense minus payroll (staff salaries and wage-related benefits).
$16.9M
Total costs Info The home's total operating expense for the year — all the costs of running it, salaries included (CMS cost report, Worksheet G-3).
$18.5M

What does this home offer?

Pets allowed icon
Pets allowed icon

Pets Allowed

Housing options icon

Housing Options: Studio / 1 Bed

Building type icon
Building type icon

Building Type: Single-story

Transportation services icon

Transportation Services

Fitness and recreation icon

Fitness and Recreation

Dining services icon

Three Meals Per Day

Parking Available icon

Parking Available

Who this home usually serves

TYPE OF STAY

Mostly long-term care residents

Most residents stay for extended periods and receive ongoing daily care.

Most new residents arrive under Medicaid (58% of admissions), and a typical Medicaid stay runs around 11 - 12 months.

Admissions
78 total

Coverage residents most often arrive under.

Medicare 3%
Private pay 40%
Medicaid 58%
Discharges
155 total

Coverage residents most often leave under.

Medicare 26%
Private pay 56%
Medicaid 18%

Managed by Susan Labree

Facility Administrator

Places of interest near Wells Point Lodge

Address 2.0 miles from city center Info Estimated distance in miles from Pflugerville's city center to Wells Point Lodge's address, calculated via Google Maps.

Calculate Travel Distance to Wells Point Lodge

Add your location

Address

Financial Assistance for
Assisted Living in Texas

Wells Point Lodge is located in Pflugerville, Texas.
Here are the financial assistance programs available to residents in Texas.

Get Financial aid guidance

Community Care for the Aged and Disabled (CCAD)

TX Medicaid CCAD

Age 65+ or disabled
General Texas resident, Medicaid-eligible, care need (not always nursing home level).
Income Limits (2025) ~$2,829/month 300% FBR, individual
Asset Limits $2,000 (individual), $3,000 (couple).
TX

Large state; rural access challenges.

Benefits
Personal care (5-7 hours/day) Respite (240 hours/year) Adult day care (~$60/day) Home aides

Texas Community Care Services

TX CCS

Age 60+
General Texas resident, at risk of decline.
Income Limits ~$2,000/month individual, varies
Asset Limits $5,000 individual
TX

Limited funding; high demand in urban areas.

Benefits
In-home care (3-5 hours/week) Respite (up to 10 days/year) Transportation (~5 trips/month)

Area Agency on Aging (AAA) Services

Texas AAA Services

Age 60+
General TX resident; no income/asset limits.
Income Limits (2025) None; donations encouraged.
Asset Limits Not assessed.
TX

28 AAAs; includes Meals on Wheels in some areas.

Benefits
Meals (~$5-$7/meal) Transportation Homemaker services (~4 hours/week) Respite (~5 days/year) Legal aid

Medicare Savings Program (MSP)

Texas Medicare Savings Program

Age 65+ or disabled
General TX resident, Medicare Part A/B.
Income Limits (2025) ~$2,510/month (QMB), ~$3,380/month (SLMB), ~$3,598/month (QI)—individual.
Asset Limits $9,430 (individual), $14,130 (couple).
TX

Includes Extra Help for Part D; no waitlist.

Benefits
Covers Part B premiums ($174.70/month) Deductibles ($240/year) Copays (~20%)

Family Caregiver Support Program (FCSP)

Texas Family Caregiver Support Program

Age
General Caregivers of 60+ needing care or 55+ caregivers of others; TX resident; 2+ ADLs.
Income Limits (2025) No strict cap; prioritizes low-income ~$24,980/year
Asset Limits Not assessed.
TX

High rural demand; includes grandparent caregivers.

Benefits
Respite (4-6 hours/week or 5 days/year) Adult day care ($60/day) Training Supplies (~$500/year)

VA Aid and Attendance (A&A) and Housebound Benefits

Texas VA Aid and Attendance/Housebound

Age 65+ or disabled veteran/spouse
General TX resident, wartime service, ADL help (A&A) or homebound.
Income Limits (2025) Net income < ~$1,984/month (veteran with dependent, A&A); pension offsets income.
Asset Limits ~$155,356 net worth
TX

High veteran population; supports rural/urban needs.

Benefits
Cash (~$1,433-$2,642/month veteran, ~$951-$1,318 spouse) for care costs

Property Tax Exemption for Seniors

Texas Senior Property Tax Exemption

Age 65+
General TX resident, homeowner (homestead).
Income Limits (2025) None; tax-based eligibility.
Asset Limits Not assessed.
TX

$25,000+ exemption; optional freeze in some counties; saves ~$500-$1,000/year.

Benefits
Tax exemption or freeze (~$500-$1,000/year savings)

Senior Farmers’ Market Nutrition Program (SFMNP)

Texas SFMNP

Age 60+
General TX resident, low-income.
Income Limits (2025) ~$2,322/month 185% FPL
Asset Limits Not assessed.
TX

Vouchers (~$50/season); serves ~20,000 via 28 AAAs.

Benefits
Vouchers (~$50/season) for produce at farmers’ markets

Frequently Asked Questions about Wells Point Lodge

What neighborhood is Wells Point Lodge in?

Wells Point Lodge is in the Wells Point neighborhood of Pflugerville.

Who is the owner of Wells Point Lodge?

The legal owner and operator of Wells Point Lodge is Pf Senior Living Llc.

Is Wells Point Lodge in a walkable area?

Wells Point Lodge has a walk score of 51. Moderately walkable. Some errands can be accomplished on foot, with a mix of nearby amenities.

What is the license number of Wells Point Lodge?

According to TX state health department records, Wells Point Lodge's license number is 307704.

When does Wells Point Lodge's license expire?

According to TX state health department records, Wells Point Lodge's license expires on April 7, 2027.

What is the occupancy rate at Wells Point Lodge?

Wells Point Lodge's occupancy is 67%.

Who is the administrator of Wells Point Lodge?

Rosemary Drake is the administrator of Wells Point Lodge.

Guides for Better Senior Living

Care Cost Calculator: See Prices in Your Area

Nursing Home Data Explorer

Don’t Wait Too Long: 7 Red Flag Signs Your Parent Needs Assisted Living Now

The True Cost of Assisted Living in 2025 – And How Families Are Paying For It

Understanding Senior Living Costs: Pricing Models, Discounts & Financial Assistance