Wesley Pines
Nursing Home, Independent Living, Assisted Living & Skilled Nursing · North Carolina, NC
CMS overall rating Info The Overall CMS Rating is scored from 1 to 5 stars and combines results from health inspections, staffing levels, and quality measures. Health inspections carry the most weight. Staffing and quality scores can increase or decrease the final rating based on performance compared to state and national standards.

Wesley Pines

Nursing Home, Independent Living, Assisted Living & Skilled Nursing · North Carolina, NC
CMS overall rating Info The Overall CMS Rating is scored from 1 to 5 stars and combines results from health inspections, staffing levels, and quality measures. Health inspections carry the most weight. Staffing and quality scores can increase or decrease the final rating based on performance compared to state and national standards.
Calculator: See prices in your area
Wesley Pines accepts Medicare, Medicaid, and private pay.

Overview of Wesley Pines

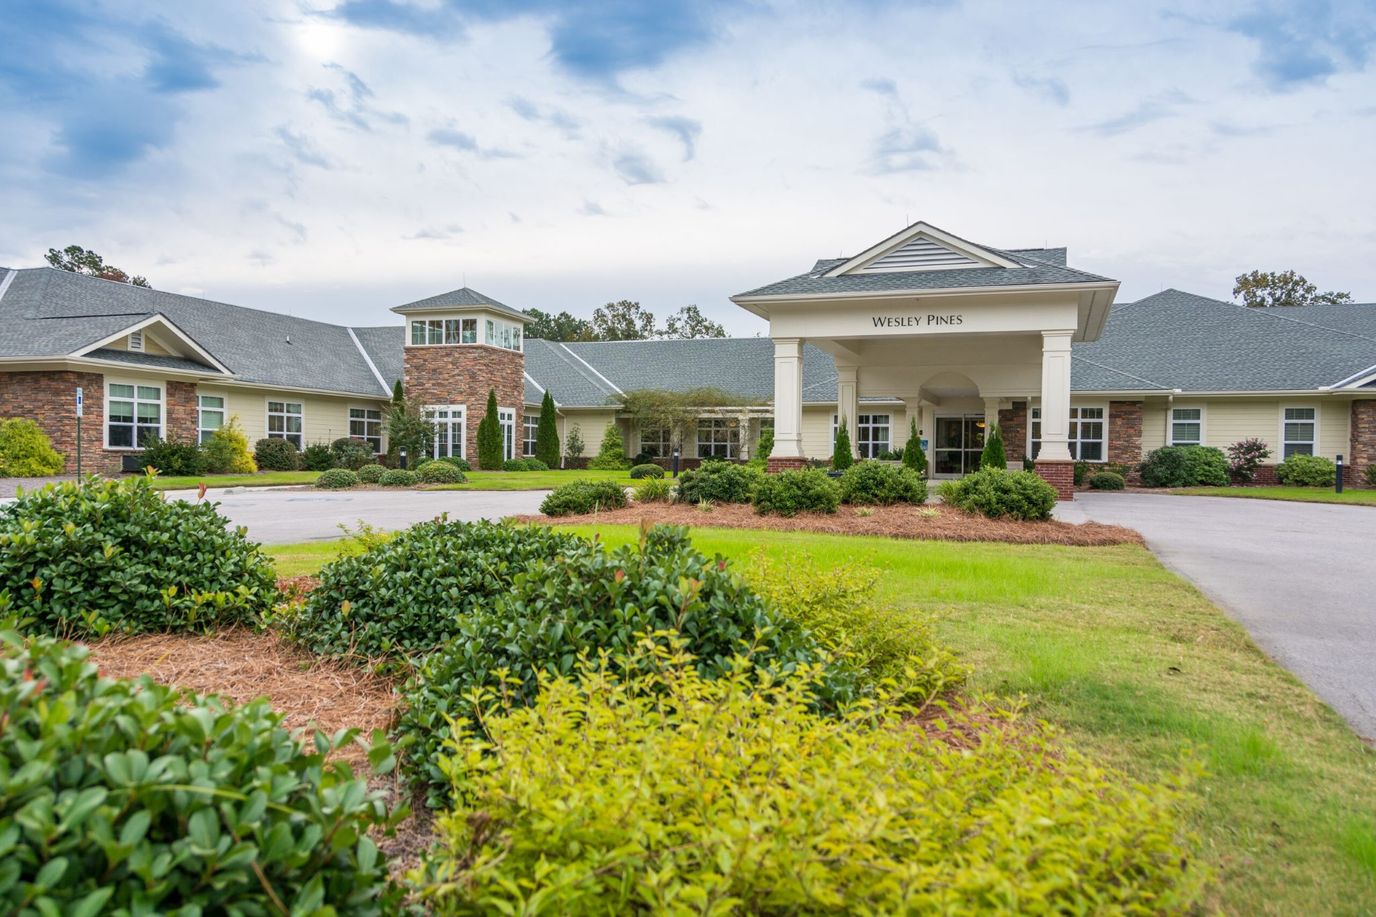
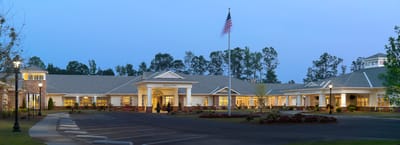
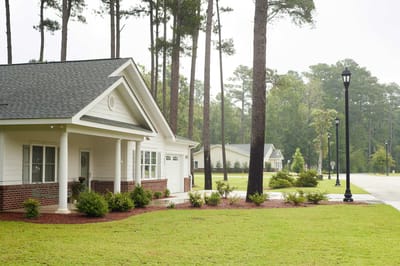
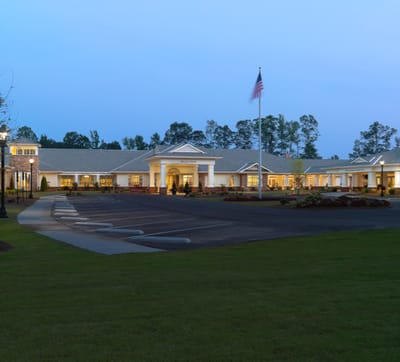
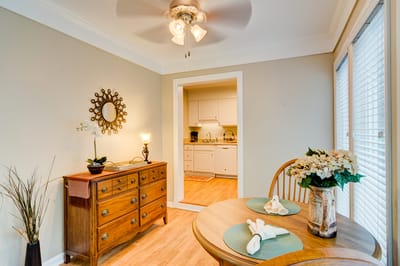
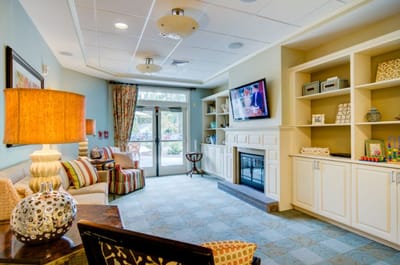
With its rich history of providing exceptional senior care since 1977, Wesley Pines Retirement Community in the beautiful setting of Wesley Pines Road, Lumberton, NC features independent living, assisted living, skilled nursing, and rehabilitation. Set on 49 acres of serene grounds, the community has a variety of cottages and villas with two-bedroom floor plans for seniors to live comfortably and safely. As a life plan community, Wesley Pines Retirement Community doubles its efforts to meet seniors’ ever-changing needs and aspirations.

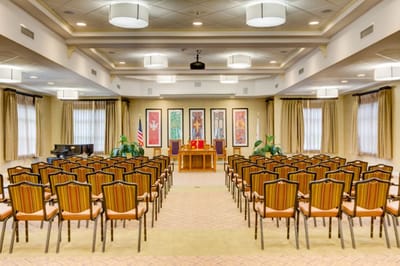
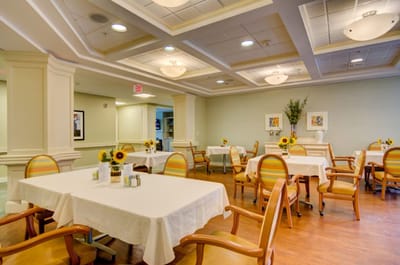
Handling the maintenance and other household responsibilities, the community provides a full slate of enjoyable activities and fun programs for residents to remain happy and well-connected. Here, healthy and delightful dining options are served for a satisfactory mealtime. Wesley Pines Retirement Community offers top-tier services and incredible amenities, ensuring seniors optimize their freedom.

(910) 738-9691

Quality ratings

Measured by Centers for Medicare & Medicaid Services (CMS)

Overall rating Info The Overall CMS Rating combines results from health inspections, staffing levels and quality measures. Health inspections carry the most weight. Staffing and quality scores can increase or decrease the final rating based on performance compared to state and national standards.
▲ 68.4% Above NC avg. ▲ 68.4% Above NC avg.Click the badge to see the full State ranking.Click here to see the full State ranking.
Health Inspection Info Based on the results of the facility's three most recent standard inspections and any complaint investigations. CMS reviews the number, scope, and severity of deficiencies, with more recent findings weighted more heavily.
▲ 47.1% Above NC avg. ▲ 47.1% Above NC avg.Click the badge to see the full State ranking.Click here to see the full State ranking.
Staffing Info Measures average nursing staff hours per resident per day, including Registered Nurses (RNs) and total nursing staff. Ratings are adjusted based on the level of care residents require and are compared to state and national benchmarks.
▼ 9.6% Below NC avg. ▼ 9.6% Below NC avg.Click the badge to see the full State ranking.Click here to see the full State ranking.
Quality Measures Info Based on clinical and physical health indicators reported to CMS, such as hospital readmissions, falls, pressure ulcers, and improvements in mobility. These measures reflect how well residents' health needs are being managed.
▲ 12.4% Above NC avg. ▲ 12.4% Above NC avg.Click the badge to see the full State ranking.Click here to see the full State ranking.

Staffing hours breakdown

Info Daily nursing hours per resident by staff type, reported to CMS. Higher is generally better — compare this facility to state and national averages to see where staffing stands.

Hours per resident per day — compared to North Carolina state averages

Total nursing care / resident Info This home is ranked 26th out of 90 homes in North Carolina. Total adjusted nursing hours per resident per day, combining RN, LPN, and aide time. CMS adjusts this for case-mix so facilities can be fairly compared.
4h 36m per day
Rank #26 / 90Nurse hours — State benchmarkedThis home is ranked 26th out of 90 homes in North Carolina. Shows adjusted nurse hours per resident per day benchmarked to the North Carolina average, with a ranking across 90 North Carolina SNFs. More hours mean more direct care. The national average is about 3.5 hrs; below 3.0 is a red flag.Click the rank badge to see the full State ranking.Click here to see the full State ranking.
This facility North Carolina avg (4h 55m per day)
vs North Carolina avg
-6%
Staff typeHours / Day / Residentvs state avg
Weekend Total Nursing Info Combined nursing hours (RN + LPN + Nurse Aide) per resident per day on weekends. Staffing often drops on weekends — this figure reveals whether the facility maintains adequate coverage outside of weekday hours. 3h 40m per day

Types of Care at Wesley Pines

Independent Living Assisted Living Skilled Nursing

Capacity and availability

This home usually has limited availability

Occupancy between 85% and 95% suggests balanced demand.

Higher occupancy than the North Carolina average: 76.4%
Occupancy rate 86.1% Rank #70 / 264Occupancy rate — State benchmarkedThis home is ranked 70th out of 264 homes in North Carolina. Shows this facility's occupancy rate versus the North Carolina average, with its Statewide rank out of 264. Higher occupancy signals strong local demand and financial stability.Click the rank badge to see the full State ranking.Click here to see the full State ranking.
Avg. Length of Stay 200 days
Occupancy rate
86.1% Rank #70 / 264Occupancy rate — State benchmarkedThis home is ranked 70th out of 264 homes in North Carolina. Shows this facility's occupancy rate versus the North Carolina average, with its Statewide rank out of 264. Higher occupancy signals strong local demand and financial stability.Click the rank badge to see the full State ranking.Click here to see the full State ranking.
Avg. Length of Stay
200 days
Years in operation
49 years in operation Rank #2 / 98Years in operation — State benchmarkedThis home is ranked 2nd out of 98 homes in North Carolina. Shows how long this facility has been in operation compared to other North Carolina SNFs. Longer operating histories may benefit residents, families, and staff.Click the rank badge to see the full State ranking.Click here to see the full State ranking.
A longer operating history, which may indicate experience navigating regulations and delivering ongoing care.
Walk Score
Walk Score: 9 / 100 Rank #463 / 572Walk Score — State benchmarkedThis home is ranked 463rd out of 572 homes in North Carolina. Shows how walkable this facility's neighborhood is compared to the average Walk Score across North Carolina SNFs. Higher scores benefit residents, families, and staff.Click the rank badge to see the full State ranking.Click here to see the full State ranking.
Car-dependent. Most errands require a car, with limited nearby walkable options.
BBB Rating
BBB Rating: A+ (Not Accredited)
An independent rating from the Better Business Bureau based on factors such as complaint history, transparency, and business practices.
How BBB ratings work

About this community

Awards

AwardsBest Retirement Community in The Robesonian Readers’ Choice Awards

License Details

Safety & Compliance

Emergency SystemsEmergency call system and daily check-in monitoring.
Safety FeaturesSecurity services.

Staffing

Key information about the people who lead and staff this community.

Leadership

ContactMr. Wade Rozier, Executive Director

Therapy & Rehabilitation

1 service
Rehabilitation Services

Staffing & Medical

1 service
24-Hour Staffing

Amenities & Lifestyle

ActivitiesVibrant community with a full calendar of activities, programs, and spiritual opportunities.
Branded ProgramsHeartfelt Connections® program
Wellness ProgramWellness programs and activities available.
Religious ServicesChaplain services and on-campus worship opportunities.

Dining & Nutrition

Food DescriptionChef-prepared, restaurant-style dining with a variety of menu options.

Contact Wesley Pines

Health Inspection History

Inspections since 2022
Total health inspections 2

North Carolina average 4


Last Health inspection on Nov 2024

Total health citations
4 Rank #11 / 95Health citations — State benchmarkedThis home is ranked 11th out of 95 homes in North Carolina. Shows this facility's total health deficiency citations benchmarked to the North Carolina State average, with a ranking across all 95 NC SNFs. Lower citation counts earn a better rank.Click the rank badge to see the full State ranking.Click here to see the full State ranking.

North Carolina average 20.9

Citations per inspection
2 Rank #11 / 95Citations per inspection — State benchmarkedThis home is ranked 11th out of 95 homes in North Carolina. Shows average deficiency citations per CMS inspection for this facility versus the North Carolina mean across 95 SNFs with citation data. Lower is better.Click the rank badge to see the full State ranking.Click here to see the full State ranking.

North Carolina average 4.99


Health citations are formal notices following inspections when they fail to comply with safety and care standards.

2 of 4 citations resulted from standard inspections; 1 of 4 resulted from complaint investigations; and 1 of 4 came from combined inspections (standard and complaint).

Breakdown of citation severity (last 4 years)
Critical Health citations
0
100% better than North Carolina average

North Carolina average: 1.3


Serious Health citations
0
100% better than North Carolina average

North Carolina average: 0.9

0 critical citations North Carolina average: 1.3

0 serious citations North Carolina average: 0.9

4 moderate citations North Carolina average: 17.1

0 minor citations North Carolina average: 1.6
Citations history (last 4 years)
Abuse/Neglect moderate citation Nov 14, 2024
Corrected

Abuse/Neglect moderate citation Nov 14, 2024
Corrected

Infection Control moderate citation Apr 14, 2022
Corrected

Quality of Care moderate citation Apr 14, 2022
Corrected

Staffing Data

Reporting period: October 1 – December 31, 2025 (Q4 2025). Source: CMS Payroll-Based Journal report.

Total staff 123
Employees 78
Contractors 45
Staff to resident ratio 1.98:1
10% better than North Carolina average
North Carolina average ratio: 1.80:1 North Carolina average ratio: 1.80:1See full North Carolina ranking
Avg staff/day 39
Average shift 6.9 hours
14% worse than North Carolina average
North Carolina average: 8 hours North Carolina average shift: 8 hoursSee full North Carolina ranking
Total staff hours (quarter) 24,733

Nursing staff breakdown

Q4 2025 · Oct 1 – Dec 31 More info This data comes from the CMS Payroll-Based Journal report covering October 1 – December 31, 2025.
Registered Nurse

Manages medical care and health needs.

RN Staff 8
Average shift length Info Average shift length. Calculated as total hours divided by days worked and average staff per day. 8 hours

No contractors work on this role.

Licensed Practical Nurse

Assists with medical care and medications.

LPN Staff 14
Average shift length Info Average shift length. Calculated as total hours divided by days worked and average staff per day. 6.7 hours

No contractors work on this role.

Certified Nursing Assistant

Helps with daily care and mobility.

CNA Staff 62
Average shift length Info Average shift length. Calculated as total hours divided by days worked and average staff per day. 7.4 hours

This role is partially covered by contractors.

Contractor staffing

Q4 2025 · Oct 1 – Dec 31 More info This data comes from the CMS Payroll-Based Journal report covering October 1 – December 31, 2025.

Total hours from contractors

11.8%

2,909 contractor hours this quarter

Certified Nursing Assistant: 13 Respiratory Therapy Technician: 8 Speech Language Pathologist: 5 Physical Therapy Assistant: 5 Qualified Social Worker: 4 Physical Therapy Aide: 3 Feeding Assistant: 2 Therapeutic Recreation Specialist: 1 Other Physician: 1 Occupational Therapy Assistant: 1 Occupational Therapy Aide: 1 Medical Director: 1

Staff by category

Q4 2025 · Oct 1 – Dec 31 More info This data comes from the CMS Payroll-Based Journal report covering October 1 – December 31, 2025.
Certified Nursing Assistant49136214,51992100%7.4
Licensed Practical Nurse140143,78192100%6.7
Registered Nurse8081,07792100%8
Clinical Nurse Specialist2028856267%7.8
RN Director of Nursing2027937278%7
Speech Language Pathologist0557326773%6.2
Nurse Practitioner1014846166%7.9
Physical Therapy Aide0334737278%4.4
Administrator1014635560%8.4
Mental Health Service Worker1014085155%8
Therapeutic Recreation Specialist0113024650%6.6
Qualified Social Worker0442515863%4.1
Feeding Assistant0222285358%3.5
Physical Therapy Assistant0551253033%3.7
Respiratory Therapy Technician088935459%1.4
Occupational Therapy Aide0114778%6.7
Occupational Therapy Assistant0113867%6.3
Other Physician011331213%2.8
Medical Director011211%1.5
62 Certified Nursing Assistant
% of Days 100%
14 Licensed Practical Nurse
% of Days 100%
8 Registered Nurse
% of Days 100%
2 Clinical Nurse Specialist
% of Days 67%
2 RN Director of Nursing
% of Days 78%
5 Speech Language Pathologist
% of Days 73%
1 Nurse Practitioner
% of Days 66%
3 Physical Therapy Aide
% of Days 78%
1 Administrator
% of Days 60%
1 Mental Health Service Worker
% of Days 55%
1 Therapeutic Recreation Specialist
% of Days 50%
4 Qualified Social Worker
% of Days 63%
2 Feeding Assistant
% of Days 58%
5 Physical Therapy Assistant
% of Days 33%
8 Respiratory Therapy Technician
% of Days 59%
1 Occupational Therapy Aide
% of Days 8%
1 Occupational Therapy Assistant
% of Days 7%
1 Other Physician
% of Days 13%
1 Medical Director
% of Days 1%

Penalties and fines

Federal penalties imposed by CMS for regulatory violations, including civil money penalties (fines) and denials of payment for new Medicare/Medicaid admissions.

Source: CMS Penalties Database

No penalties in the past 3 years

No civil money penalties or payment denials were reported in the last 3 years.

Quality of care over time

These measures show how residents usually do over time at this home, based on health outcomes and preventive care.

High-risk clinical events score Info A composite score based on pressure ulcers, falls with injury, weight loss, walking ability decline, and activities of daily living decline. 8.8
23% better than North Carolina average

North Carolina average: 11.5

Functional decline score Info A composite score based on activities of daily living decline, walking ability decline, and incontinence. 13.3
36% better than North Carolina average

North Carolina average: 20.6

Long-stay resident measures
Need for Help with Daily Activities Increased Info Percent of long-stay residents whose need for help with daily activities has increased 10.0%
43% better than North Carolina average

North Carolina average: 17.5%

Walking Ability Worsened Info Percent of long-stay residents whose ability to move independently worsened 13.8%
41% better than North Carolina average

North Carolina average: 23.3%

Low Risk Residents with Bowel/Bladder Incontinence Info Percent of low risk long-stay residents who lose control of their bowels or bladder 16.1%
25% better than North Carolina average

North Carolina average: 21.4%

Falls with Major Injury Info Percent of long-stay residents experiencing one or more falls with major injury 11.4%
212% worse than North Carolina average

North Carolina average: 3.6%

High Risk Residents with Pressure Ulcers Info Percent of long-stay high risk residents with pressure ulcers 2.8%
56% better than North Carolina average

North Carolina average: 6.3%

Urinary Tract Infection Info Percent of long-stay residents with a urinary tract infection 3.7%
42% worse than North Carolina average

North Carolina average: 2.6%

Lost Too Much Weight Info Percent of long-stay residents who lose too much weight 6.3%
15% better than North Carolina average

North Carolina average: 7.4%

Depressive Symptoms Info Percent of long-stay residents who have depressive symptoms 0.0%
100% better than North Carolina average

North Carolina average: 4.4%

Antipsychotic Use Info Percent of long-stay residents who received an antipsychotic medication 6.1%
54% better than North Carolina average

North Carolina average: 13.4%

Pneumococcal Vaccine Info Percent of long-stay residents assessed and appropriately given the pneumococcal vaccine 100.0%
9% better than North Carolina average

North Carolina average: 91.6%

Influenza Vaccine Info Percent of long-stay residents assessed and appropriately given the seasonal influenza vaccine 100.0%
6% better than North Carolina average

North Carolina average: 94.1%

Short-stay resident measures
Pneumococcal Vaccine Info Percent of short-stay residents assessed and appropriately given the pneumococcal vaccine 100.0%
25% better than North Carolina average

North Carolina average: 79.9%

Antipsychotic medication increase Info Percent of short-stay residents who newly received an antipsychotic medication 1.1%
25% better than North Carolina average

North Carolina average: 1.5%

Influenza Vaccine Info Percent of short-stay residents assessed and appropriately given the seasonal influenza vaccine 100.0%
28% better than North Carolina average

North Carolina average: 78.1%

Breakdown by payment type

Medicare

29% of new residents, usually for short-term rehab.

Typical stay 1 months

Private pay

56% of new residents, often for short stays.

Typical stay 10 - 11 months

Medicaid

15% of new residents, often for long-term daily care.

Typical stay 2 years

Facility Characteristics

Source: CMS Long-Term Care Facility Characteristics (Data as of Jan 2026)

Total residents 62
Medicare
62
100% of residents
Programs & Services
Residents Group

Residents meet regularly to discuss policies, care quality, and activities

CCRC

Part of a Continuing Care Retirement Community offering multiple care levels

Active Resident Council

Organized group of residents that meets regularly to discuss facility policies, quality of life, and activities.

Finances and operations

Voluntary non-profit community
Operated by a church.
Home revenue
$11.6M
Surplus of revenue
$842.0K
Voluntary non-profit community Operated by a church.
Home revenue
$11.6M Rank #72 / 97Revenue — State benchmarkedThis home is ranked 72nd out of 97 homes in North Carolina. Shows this facility's annual revenue compared to the North Carolina SNF average. Higher revenue generally means more resources for staffing and capital — read alongside Payroll %.Click the rank badge to see the full State ranking.Click here to see the full State ranking.
Surplus of revenue
$842.0K
Payroll costs Info The portion of the home's budget spent on staff, including nurses, caregivers, and other employees who support care and operations. Rank #60 / 97Payroll — State benchmarkedThis home is ranked 60th out of 97 homes in North Carolina. Shows total annual staff payroll benchmarked to the North Carolina average. Higher payroll investment relative to peers often signals better staffing and less reliance on cheaper contract labor.Click the rank badge to see the full State ranking.Click here to see the full State ranking.
$6.4M
55% of revenue Rank #17 / 97Payroll % — State benchmarkedThis home is ranked 17th out of 97 homes in North Carolina. Shows payroll as a percentage of revenue versus the North Carolina average. Well-run North Carolina SNFs typically land around 49–62% — the top third Statewide. Below 25% may signal understaffing or heavy agency use — read with Staffing ratings.Click the rank badge to see the full State ranking.Click here to see the full State ranking.
Other operating costs Info All remaining costs needed to run the home, such as food, utilities, building maintenance, supplies and administrative expenses.
$4.4M
Total costs $10.8M

What does this home offer?

Housing options icon

Housing Options: 1 Bed / Cottage / Villa

Building type icon
Building type icon

Building Type: Single-story

Transportation services icon

Transportation Services

Fitness and recreation icon

Fitness and Recreation

Who this home usually serves

TYPE OF STAY

Mix of rehab and long-term care

This home supports both short-term rehab and long-term care, with residents staying for a wide range of durations.

Managed by Amy Hilburn

Executive Director

Over 20 years of experience

Amy Hilburn serves as the Executive Director of Wesley Pines, bringing over 20 years of experience with the community. She began her career as Assistant Activities Director and has held multiple leadership roles including Social Work and Admissions Director and Marketing Director. Amy has completed the NC Nursing Home Administrator licensure program and also serves as Privacy and Corporate Compliance Officer, demonstrating her deep commitment to senior care.

Places of interest near Wesley Pines

Address 35.2 miles from city center Info Estimated distance in miles from Lumberton's city center to Wesley Pines's address, calculated via Google Maps.

Calculate Travel Distance to Wesley Pines

Add your location

Address

Financial Assistance for
Nursing Home in North Carolina

Wesley Pines is located in Lumberton, North Carolina.
Here are the financial assistance programs available to residents in North Carolina.

Get Financial aid guidance

Community Alternatives Program for Disabled Adults

NC Medicaid CAP/DA

Age 65+ or disabled
General North Carolina resident, Medicaid- eligible, nursing home-level care need.
Income Limits (2025) ~$2,829/month 300% FBR, individual
Asset Limits $2,000 (individual), $3,000 (couple).
NC

High demand; waitlists common in urban areas.

Benefits
Personal care (5-7 hours/day) Respite (240 hours/year) Adult day care ($60/day) Home modifications ($1,500 avg.)

North Carolina Senior Care Options

NC SCO (via NFCSP)

Age Caregiver of someone 60+ (or with dementia)
General North Carolina resident.
Income Limits No strict limit; prioritizes low-income.
Asset Limits Not applicable.
NC

Limited slots; rural/urban balance.

Benefits
In-home respite (4-6 hours/day) Adult day care (~$60/day) Short-term facility care (up to 5 days)

Program of All-Inclusive Care for the Elderly (PACE)

North Carolina PACE (e.g., PACE of the Triad)

Age 55+
General NC resident (specific counties), NFLOC, safe with PACE support.
Income Limits (2025) ~$2,829/month (Medicaid-eligible); private pay option available.
Asset Limits $2,000 (individual), $3,000 (couple) for Medicaid enrollees.
NC

Available in 10+ counties (e.g., Guilford, Wake); multiple providers (e.g., PACE of the Southern Piedmont).

Benefits
Personal care (5-7 hours/day) Medical care Meals Transportation Respite Therapies

In-Home Aide Services

North Carolina In-Home Aide Services

Age 60+
General NC resident, unable to perform 1+ ADL, at risk of nursing home placement.
Income Limits (2025) No strict cap; prioritizes low-income ~$24,980/year
Asset Limits Not assessed; need-based.
NC

Family can be aides; varies by county funding.

Benefits
Personal care (5-20 hours/week) Meal prep Respite (~5 days/year) Errands

Medicare Savings Program (MSP)

North Carolina Medicare Savings Program

Age 65+ or disabled
General NC resident, Medicare Part A/B.
Income Limits (2025) ~$2,510/month (QMB), ~$3,380/month (SLMB), ~$3,598/month (QI)—individual.
Asset Limits $9,430 (individual), $14,130 (couple).
NC

Three tiers; no waitlist; includes Extra Help for Part D.

Benefits
Covers Part B premiums ($174.70/month) Deductibles ($240/year) Copays (~20%)

VA Aid and Attendance (A&A) and Housebound Benefits

North Carolina VA Aid and Attendance/Housebound

Age 65+ or disabled veteran/spouse
General NC resident, wartime service, need for ADL help (A&A) or homebound.
Income Limits (2025) Net income < ~$1,984/month (veteran with dependent, A&A); pension offsets income.
Asset Limits ~$155,356 net worth limit
NC

High veteran demand in rural/urban areas.

Benefits
Cash (~$1,433-$2,642/month veteran, ~$951-$1,318 spouse) for care costs (e.g., in-home, assisted living)

Urgent Repair Program (URP)

North Carolina Urgent Repair Program

Age 60+ prioritized
General NC resident, homeowner, low-income.
Income Limits (2025) ~$30,258/year 50% AMI, varies by county
Asset Limits Not strictly assessed; home value considered.
NC

Forgivable at $2,000/year; statewide via local partners.

Benefits
Repairs (~$8,000-$12,000 avg.) for safety (e.g., roofs, heating, accessibility)

State/County Special Assistance (SA)

North Carolina Special Assistance

Age 65+ (or disabled)
General NC resident, in licensed adult care home, low-income.
Income Limits (2025) ~$1,255/month (individual, 100% FPL); varies by facility rate.
Asset Limits $2,000 individual
NC

Covers assisted living; counties supplement state funds.

Benefits
Cash (~$1,200-$1,500/month) for room/board; Medicaid covers care services

Frequently Asked Questions about Wesley Pines

What neighborhood is Wesley Pines in?

Wesley Pines is in the Lumberton neighborhood of Lumberton.

Is Wesley Pines in a walkable area?

Wesley Pines has a walk score of 9. Car-dependent. Most errands require a car, with limited nearby walkable options.

What is the occupancy rate at Wesley Pines?

Wesley Pines's occupancy is 86.1%.

Are there photos of Wesley Pines?

Yes — there are 18 photos of Wesley Pines in the photo gallery on this page.

What is the phone number of Wesley Pines?

(910) 738-9691 will put you in contact with the team at Wesley Pines.

Is Wesley Pines Medicare or Medicaid certified?

Yes — Wesley Pines is a CMS-certified provider of Medicare and Medicaid.

Guides for Better Senior Living

Care Cost Calculator: See Prices in Your Area

Nursing Home Data Explorer

Don’t Wait Too Long: 7 Red Flag Signs Your Parent Needs Assisted Living Now

The True Cost of Assisted Living in 2025 – And How Families Are Paying For It

Understanding Senior Living Costs: Pricing Models, Discounts & Financial Assistance

Explore Open Rooms
1 Contact details
2 What type of senior care service are you looking for?
3 What budget do you have in mind for senior care?
4 How soon do you need to find care?
5 Additional details

Thank you for your interest!

Our team will be in touch shortly to help with next steps.