Memory Care Home

Westminster Place

Memory Care Home

Westminster Place

3200 Grant St, Evanston, IL 60201 View map
Overview of Westminster Place

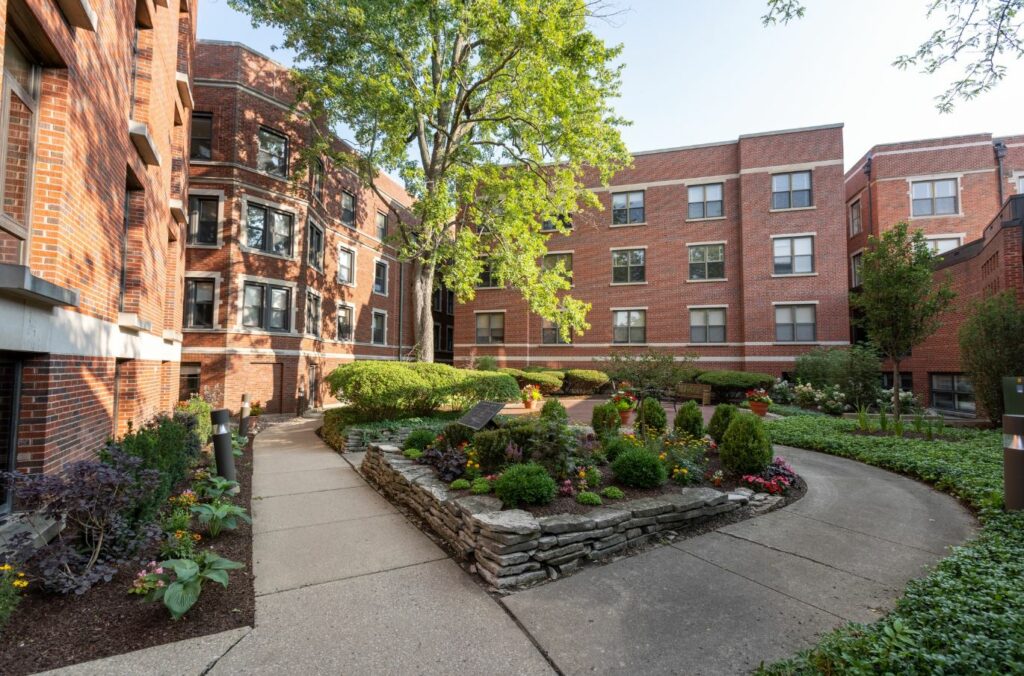
The sister community of Ten Twenty Grove, Westminster Place, is an active 55+ community that genuinely understands the aging process and is dedicated to providing its residents with the highest care. Specializing in independent living, assisted living, memory support, long-term care, respite care, and short-term rehab services, the community’s specially trained staff is committed to helping seniors achieve maximum independence with ability-centered programming that promotes individuality.

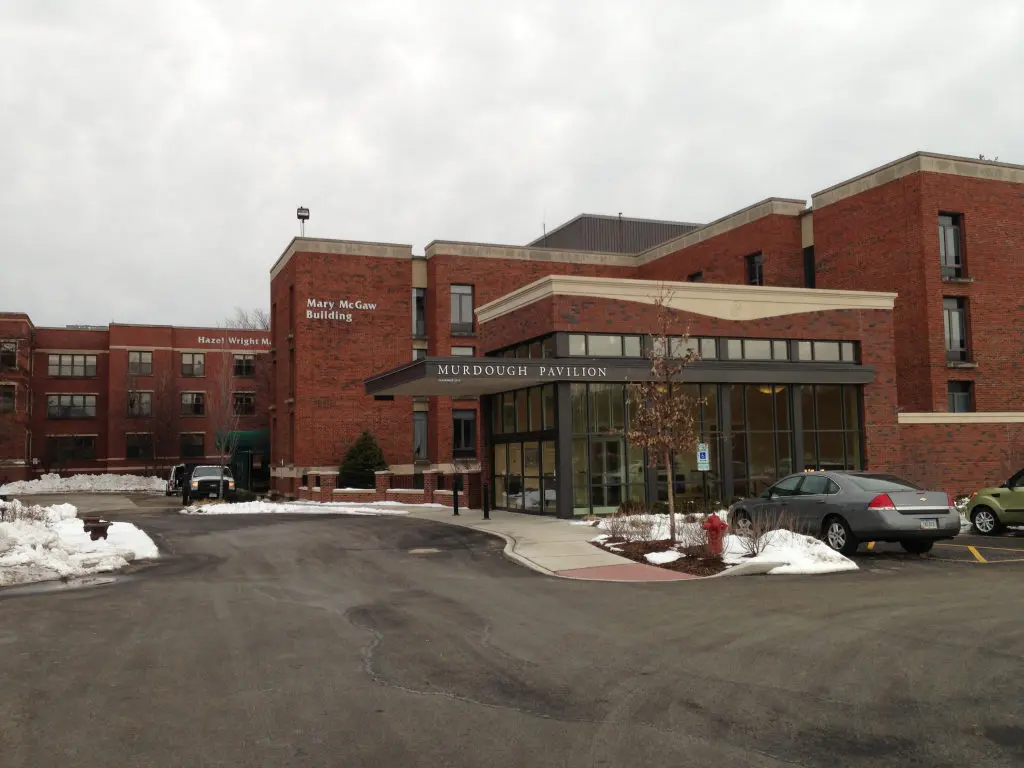
As a Presbyterian senior living home, Westminster Place ensures comfort and flexibility as the focus of all its community features. Residents can immerse themselves in exclusive activities scheduled for them to participate in, such as the exclusive Kimble Fitness Center for health and wellness, immediate access to healthcare at the McGaw Care Center, and exploring the vibrant and engaging social life downtown.

(847) 570-3422

Quality ratings

Measured by Centers for Medicare & Medicaid Services (CMS)

Overall rating Info Official CMS rating based on health inspections, staffing and quality measures.
5/5
Illinois average: 2.5/5
Health Inspection Info Official CMS rating based on deficiencies found during state health inspections.
5/5
Illinois average: 2.8/5
Staffing Info Official CMS rating based on nurse staffing hours per resident per day.
4/5
Illinois average: 2.1/5
Quality Measures Info Official CMS rating based on clinical outcomes for residents.
4/5
Illinois average: 2.8/5

Nursing care per resident

Info Average daily nursing hours per resident (adjusted for acuity). Higher values indicate more nursing time per resident.
5h 30m per day

This home provides 77% more nursing time per resident than the Illinois average.

Illinois average: 3h 6m per day

Staffing hours breakdown

Info Hours of care per resident per day, broken down by staff type. Data from CMS Medicare.
Staff type Facility State avg National avg
Registered Nurse (RN) Info Registered nurse hours per resident per day. 1h 43m per day 34m per day 29m per day

Capacity and availability

High-capacity home

May provide extensive amenities, services and programs.

Total beds 204

This home usually has availability

Lower occupancy suggests more openings may be available.

Lower demand than the Illinois average
Occupancy rate 64.8%
Residents per day (avg) 59
Occupancy rate
64.8%
Residents per day (avg)
59

Who this home usually serves

TYPE OF STAY

Mix of rehab and long-term care

This home supports both short-term rehab and long-term care, with residents staying for a wide range of durations.

Breakdown by payment type

Medicare

43% of new residents, usually for short-term rehab.

Typical stay 27 days

Private pay

57% of new residents, often for short stays.

Typical stay 5 - 6 months

Finances and operations

Voluntary non-profit community
Home revenue
$62.2M
Surplus of revenue
$3.1M
Voluntary non-profit community
Home revenue
$62,194,828.00
Surplus of revenue
$3,110,865.00
Payroll costs Info The portion of the home's budget spent on staff, including nurses, caregivers, and other employees who support care and operations.
$12.5M
20.1% of revenue
Other operating costs Info All remaining costs needed to run the home, such as food, utilities, building maintenance, supplies and administrative expenses.
$15.5M
Total costs $28.0M

What does this home offer?

Pets allowed icon
Pets allowed icon

Pets Allowed: Yes, Pets Allowed

Housing options icon

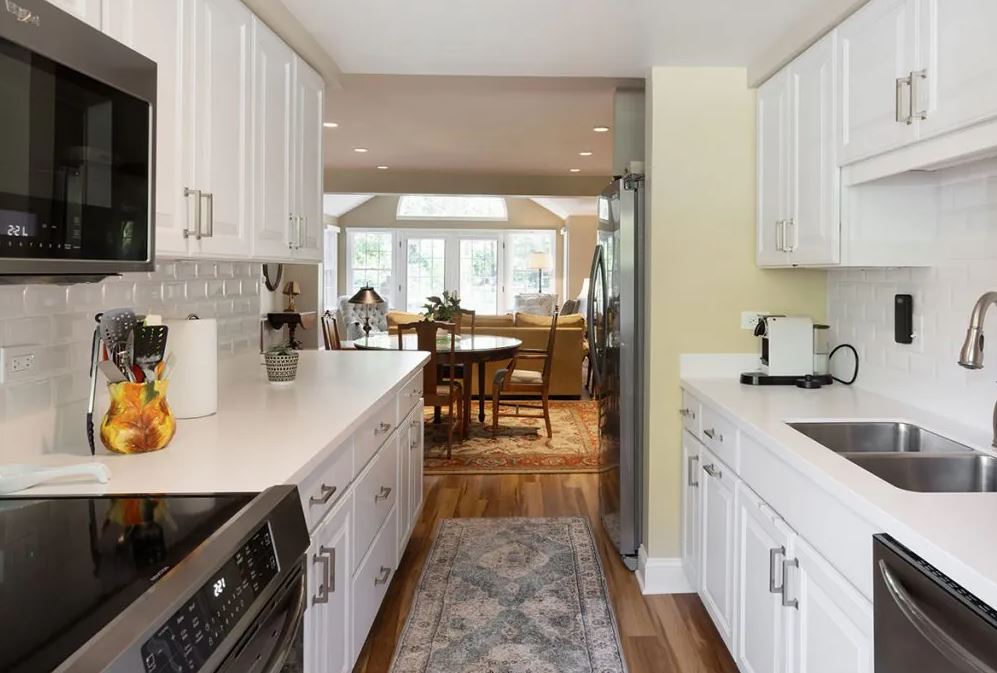
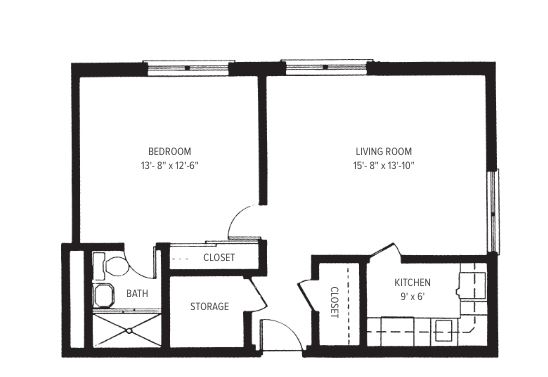
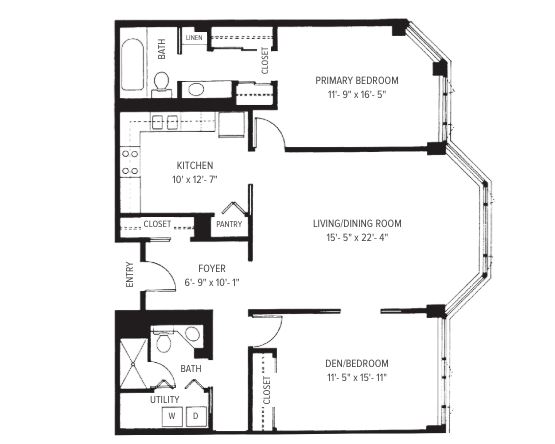
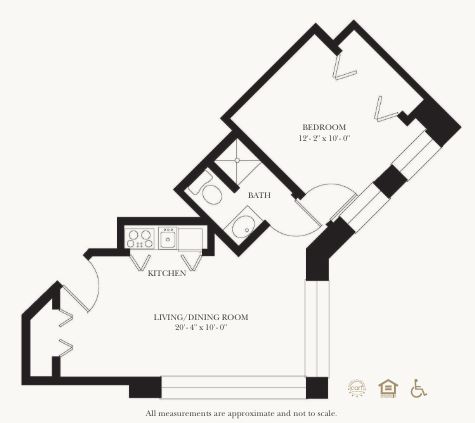
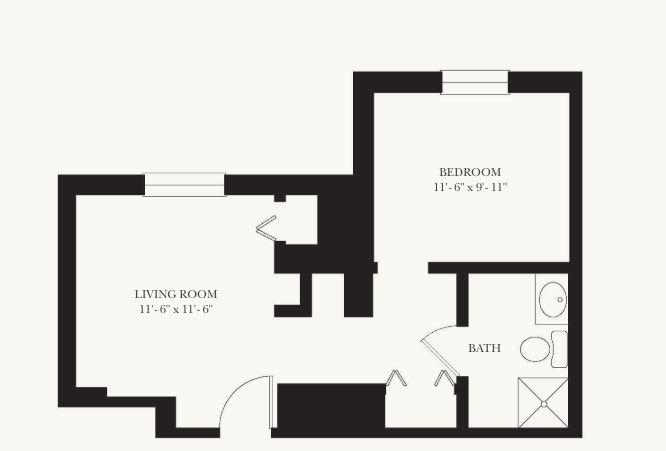
Housing Options: Studio / 1 Bed / 2 Bed

Building type icon
Building type icon

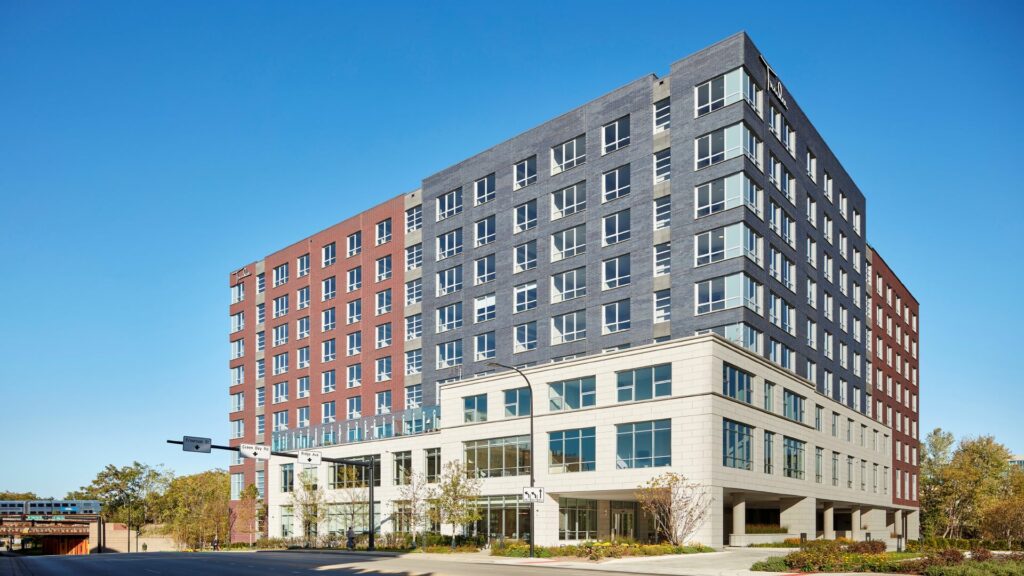
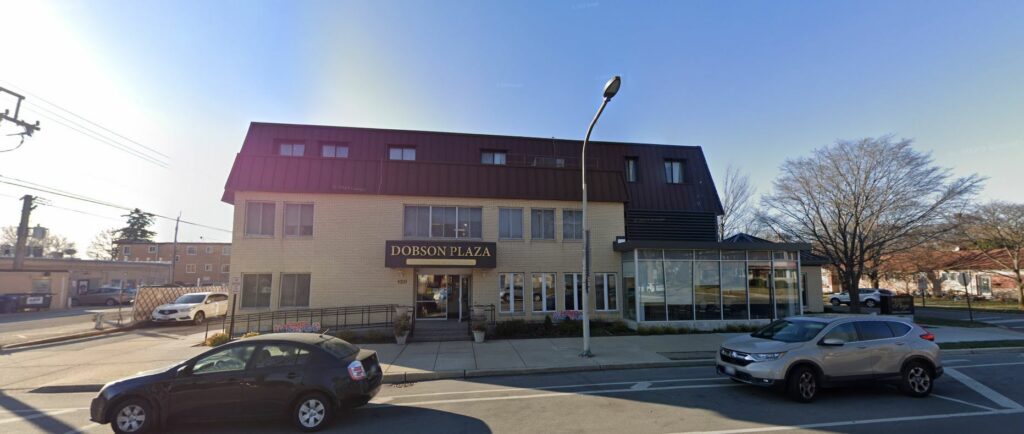
Building Type: Mid-rise

Transportation services icon

Transportation Services

Fitness and recreation icon

Fitness and Recreation

Types of Care at Westminster Place

Assisted Living Independent Living Memory Care
Contact Westminster Place

Health Inspection History

Inspections
Total health inspections 3

Illinois average 10.4


Last Health inspection on Oct 2024

Total health citations 7
Citations per inspection
2.33

Health citations are formal notices following inspections when they fail to comply with safety and care standards.

All 7 citations resulted from standard inspections.

Breakdown of citation severity (last 3 years)
Critical Health citations More info 0
100% better than Illinois average

Illinois average: 0.7


Serious Health citations More info 0
100% better than Illinois average

Illinois average: 3.6

0 critical citations More info Illinois average: 0.7

0 serious citations More info Illinois average: 3.6

7 moderate citations More info Illinois average: 32

0 minor citations More info Illinois average: 0.5
Citations history (last 3 years)
Infection Control moderate citation Oct 18, 2024
Corrected

Pharmacy moderate citation Oct 18, 2024
Corrected

Quality of Care moderate citation Oct 18, 2024
Corrected

Quality of Care moderate citation Oct 18, 2024
Corrected

Compare Memory Care around Evanston

The information below is reported by the Illinois Department of Public Health, Office of Health Care Regulation.
Westminster Place
SNF

Nursing Home 24/7 care needed

AL

Assisted Living For seniors needing help with daily tasks but not full-time nursing.

Evanston
204
Yes
-
44
Studio / 1 Bed / 2 Bed
McGaw Care Center & Frank Foster Pavilion
SNF

Nursing Home 24/7 care needed

AL

Assisted Living For seniors needing help with daily tasks but not full-time nursing.

Evanston
204
No
-
64
Studio / 1 Bed / 2 Bed
Trulee Evanston
AL

Assisted Living For seniors needing help with daily tasks but not full-time nursing.

IL

Independent Living For self-sufficient seniors seeking community and minimal assistance.

MC

Memory Care Specialized care for those with Memory Loss, Alzheimer's, or dementia, ensuring safety and support.

Evanston
33
Yes
-
93
Studio / 1 Bed / 2 Bed
Aperion Care Evanston
AL

Assisted Living For seniors needing help with daily tasks but not full-time nursing.

Evanston
-
No
-
88
Studio / 1 Bed / 2 Bed
Dobson Plaza Rehabilitation and Healthcare
AL

Assisted Living For seniors needing help with daily tasks but not full-time nursing.

MC

Memory Care Specialized care for those with Memory Loss, Alzheimer's, or dementia, ensuring safety and support.

SNF

Nursing Homes 24/7 care needed

Evanston
-
No
A+
74
Studio / 1 Bed / 2 Bed

Living Spaces & Floor Plans

Westminster Place P3
Westminster Place P4
Westminster Place P1
Westminster Place P2

Places of interest near Westminster Place

Address 2.8 miles from city center — 6.72 miles to nearest hospital (Resurrection Medical Center - Emergency Fast Track)

Address 3200 Grant St, Evanston, IL 60201

Calculate Travel Distance to Westminster Place

Add your location

Address

Staffing Data

Source: CMS Payroll-Based Journal (Q2 2025)

191
Total Staff
158
Employees
33
Contractors
37,173
Total Hours (Quarter)
60
Avg Staff/Day
6.8
Avg Shift (hrs)
Nursing Staff Breakdown
Role Count Avg Shift (hrs) Uses Contractors?
Registered Nurse377.2 Yes
Licensed Practical Nurse87.1 No
Certified Nursing Assistant847 No
Staff by Category
Administration
15 staff
6.9hs shift avg
Nursing Staff
129 staff
7hs shift avg
Physicians & Practitioners
14 staff
7.3hs shift avg
Therapy Services
23 staff
4.3hs shift avg
Activities & Recreation
0 staff
0hs shift avg
Social Services
2 staff
5.5hs shift avg
Dietary Services
5 staff
7.4hs shift avg
Other Services
3 staff
8.6hs shift avg
Contractor Analysis
8.1%
of total hours from contractors
3,017 contractor hours this quarter
Registered Nurse: 8 Occupational Therapy Assistant: 1 Occupational Therapy Aide: 1 Speech Language Pathologist: 8 Physical Therapy Aide: 4 Respiratory Therapy Technician: 6 Physical Therapy Assistant: 3 Nurse Practitioner: 1 Qualified Social Worker: 1
Role Employees Contractors Total Staff Total Hours Days Worked % of Days Avg Shift (hrs)
Certified Nursing Assistant8408418,24591100%7
Registered Nurse298377,16991100%7.2
Clinical Nurse Specialist120122,8658897%7.2
Other Dietary Services Staff5052,06791100%7.4
Licensed Practical Nurse8081,61091100%7.1
Dental Services Staff3038566774%8.6
Respiratory Therapy Technician0668377886%4.1
Physical Therapy Aide0445196470%4.9
Nurse Practitioner1125036571%7.5
Speech Language Pathologist0884967785%3.5
Administrator2024886167%7.5
Occupational Therapy Aide0114806470%7.5
Other Social Services Staff1014506066%7.5
Physical Therapy Assistant0332907582%3.1
Qualified Social Worker0112056066%3.4
Medical Director13013521314%4
Occupational Therapy Assistant011431516%2.9

Facility Characteristics

Source: CMS Long-Term Care Facility Characteristics (Data as of Jan 2026)

Total census
56 residents
Residents by payment source
Medicare
22 residents (39.3%)
Private pay or other
34 residents (60.7%)
Programs & Services
Residents' Group

Residents meet regularly to discuss policies, care quality, and activities

CCRC

Part of a Continuing Care Retirement Community offering multiple care levels

Active Resident Council

Organized group of residents that meets regularly to discuss facility policies, quality of life, and activities.

Quality of care over time

These measures show how residents usually do over time at this home, based on health outcomes and preventive care.

High-risk clinical events score Info A composite score based on pressure ulcers, falls with injury, weight loss, walking ability decline, and activities of daily living decline. 10.2
In line with Illinois average

Illinois average: 9.7

Functional decline score Info A composite score based on activities of daily living decline, walking ability decline, and incontinence. 15.3
18% better than Illinois average

Illinois average: 18.6

Long-stay resident measures
Significantly above average Illinois avg: 3.6 Info CMS star rating based on long-stay quality measure performance. 5 stars = significantly above average, 1 star = significantly below average.
Need for Help with Daily Activities Increased Info Percent of long-stay residents whose need for help with daily activities has increased 11.7%
24% better than Illinois average

Illinois average: 15.5%

Walking Ability Worsened Info Percent of long-stay residents whose ability to move independently worsened 17.1%
7% better than Illinois average

Illinois average: 18.4%

Low Risk Residents with Bowel/Bladder Incontinence Info Percent of low risk long-stay residents who lose control of their bowels or bladder 17.1%
21% better than Illinois average

Illinois average: 21.6%

Falls with Major Injury Info Percent of long-stay residents experiencing one or more falls with major injury 3.3%
In line with Illinois average

Illinois average: 3.4%

High Risk Residents with Pressure Ulcers Info Percent of long-stay high risk residents with pressure ulcers 9.9%
88% worse than Illinois average

Illinois average: 5.3%

Urinary Tract Infection Info Percent of long-stay residents with a urinary tract infection 2.0%
11% worse than Illinois average

Illinois average: 1.8%

Lost Too Much Weight Info Percent of long-stay residents who lose too much weight 8.9%
35% worse than Illinois average

Illinois average: 6.5%

Depressive Symptoms Info Percent of long-stay residents who have depressive symptoms 4.2%
91% better than Illinois average

Illinois average: 48.1%

Antipsychotic Use Info Percent of long-stay residents who received an antipsychotic medication 13.8%
32% better than Illinois average

Illinois average: 20.2%

Pneumococcal Vaccine Info Percent of long-stay residents assessed and appropriately given the pneumococcal vaccine 98.0%
10% better than Illinois average

Illinois average: 89.2%

Influenza Vaccine Info Percent of long-stay residents assessed and appropriately given the seasonal influenza vaccine 100.0%
9% better than Illinois average

Illinois average: 91.6%

Hospitalizations per 1,000 days Info Number of hospitalizations per 1,000 long-stay resident days. 2.06
In line with Illinois average

Illinois average: 2.05

ED visits per 1,000 days Info Number of outpatient emergency department visits per 1,000 long-stay resident days. 0.42
81% better than Illinois average

Illinois average: 2.25

Short-stay resident measures
Average Illinois avg: 2.0 Info CMS star rating based on short-stay quality measure performance. 5 stars = much above average, 1 star = much below average.
Pneumococcal Vaccine Info Percent of short-stay residents assessed and appropriately given the pneumococcal vaccine 92.1%
35% better than Illinois average

Illinois average: 68.3%

Antipsychotic medication increase Info Percent of short-stay residents who newly received an antipsychotic medication 1.9%
21% better than Illinois average

Illinois average: 2.3%

Influenza Vaccine Info Percent of short-stay residents assessed and appropriately given the seasonal influenza vaccine 91.0%
44% better than Illinois average

Illinois average: 63.0%

Re-hospitalized after SNF stay Info Percentage of short-stay residents who were re-hospitalized after their nursing home admission. 23.4%
11% better than Illinois average

Illinois average: 26.2%

Emergency department visits Info Percentage of short-stay residents who had an outpatient emergency department visit. 7.8%
44% better than Illinois average

Illinois average: 14.0%

Falls with major injury Info Percentage of SNF residents who experience falls with major injury during their stay. 0.3%
57% better than Illinois average

Illinois average: 0.8%

Ability to care for self at discharge Info Percentage of residents at or above expected ability to care for themselves at discharge. 53.0%
In line with Illinois average

Illinois average: 53.7%

Successful return to home or community Info Rate of successful return to home or community from a skilled nursing facility. 60.4%
19% better than Illinois average

Illinois average: 50.6%

Guides for Better Senior Living

Care Cost Calculator: See Prices in Your Area

Nursing Home Data Explorer

Don’t Wait Too Long: 7 Red Flag Signs Your Parent Needs Assisted Living Now

The True Cost of Assisted Living in 2025 – And How Families Are Paying For It

Understanding Senior Living Costs: Pricing Models, Discounts & Financial Assistance

Financial Aid for Illinois Seniors

Get financial aid guidance

Community Care Program

Illinois CCP

Age 60+, Illinois resident, at risk of nursing home placement.

~$1,215/month (individual).

$17,500 (individual, excludes home, car).

High demand in urban areas; waitlists possible.

Illinois Respite Program

IL Respite (via NFCSP)

Caregiver of someone 60+ (or with dementia), Illinois resident.

No strict limit; prioritizes low-income.

Not applicable.

Limited slots; urban/rural balance.

Supportive Living Program (SLP)

Illinois Medicaid Supportive Living Program

Age 65+ or 22-64 with disability, Illinois resident, Medicaid-eligible, needs moderate assistance (not nursing home-level).

~$2,829/month (300% FBR, individual); QIT allowed.

$2,000 (individual), $3,000 (couple) (excludes home, car).

~200 SLP sites statewide; room/board not covered.

Persons Who Are Elderly Waiver

Illinois Medicaid Elderly Waiver

Age 65+, Illinois resident, Medicaid-eligible, nursing home-level care need.

~$2,829/month (300% FBR, individual).

$2,000 (individual), $3,000 (couple).

Part of HealthChoice Illinois; consumer-directed options available.

Medicare Savings Program (MSP)

Illinois Medicare Savings Program

Age 65+ or disabled, Illinois resident, Medicare Part A/B.

~$2,510/month (QMB), ~$3,380/month (SLMB), ~$3,598/month (QI)—individual.

$9,430 (individual), $14,130 (couple).

Three tiers; no waitlist.

Senior Community Service Employment Program (SCSEP)

Illinois SCSEP

Age 55+, unemployed, low-income, Illinois resident.

~$1,983/month (125% FPL).

Not specified; income-focused.

Priority for veterans, rural residents.

Optional State Supplementation (OSS)

Illinois Optional State Supplementation

Age 65+ or disabled, Illinois resident, in approved facility, SSI recipient or low-income.

~$1,004/month (including SSI).

$2,000 (individual), $3,000 (couple).

~$50-$500/month based on facility type.

VA Aid and Attendance (A&A) and Housebound Benefits

Illinois VA Aid and Attendance/Housebound

Age 65+ or disabled veteran/spouse, Illinois resident, wartime service, need for ADL help (A&A) or homebound.

Net income < ~$1,984/month (veteran with dependent, A&A); pension offsets income.

~$155,356 (net worth limit).

High veteran demand in urban/rural areas.

Tour Icon
Planning a tour? Check our touring checklist.
Chat Icon
Thinking of living here? We can help you speak to a current resident