Aperion Care Evanston
Nursing Home & Assisted Living · Evanston, IL
CMS overall rating Info CMS (the Centers for Medicare & Medicaid Services) is the federal agency that rates nursing home quality. Its Overall Rating runs from 1 to 5 stars, combining health inspections, staffing, and quality measures, with inspections weighted most heavily.

Aperion Care Evanston

Nursing Home & Assisted Living · Evanston, IL
CMS overall rating Info CMS (the Centers for Medicare & Medicaid Services) is the federal agency that rates nursing home quality. Its Overall Rating runs from 1 to 5 stars, combining health inspections, staffing, and quality measures, with inspections weighted most heavily.
Calculator: See prices in your area
Aperion Care Evanston accepts Medicare, Medicaid, and private pay.

Overview of Aperion Care Evanston

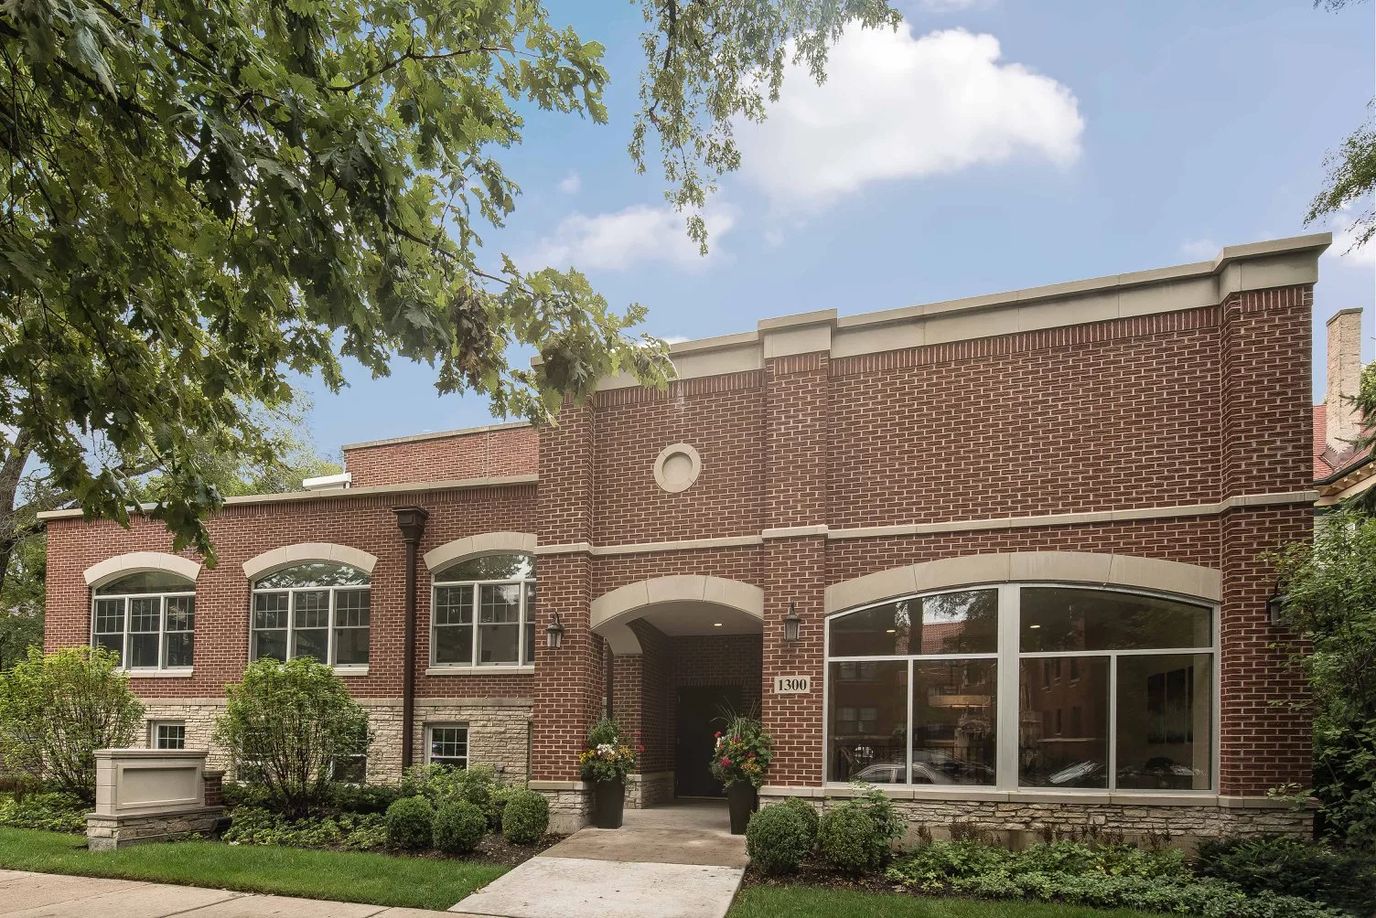
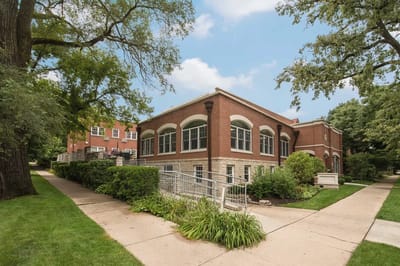
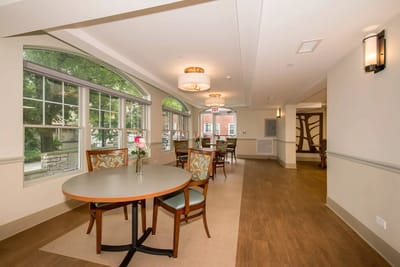
Aperion Care Evanston is an affordable health and rehabilitation center in the city. A comprehensive community that presents a resort-like lifestyle with world-class hospitality offered to each unique individual with personal needs. The health and rehabilitation center’s nursing approach is focused on specialized therapies that contribute to a speedy recovery.

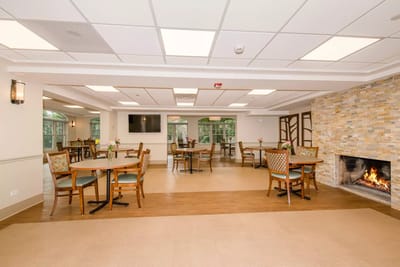
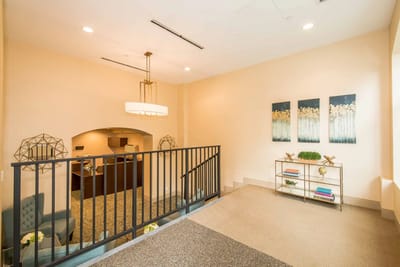
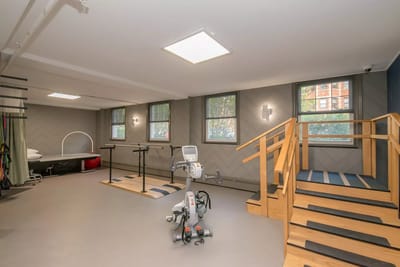
Aperion Care’s specialization emphasizes skilled nursing, short-term rehabilitation, and memory care services. The dedicated team of caregivers strives to meet and follow a resident’s individualized care plan for a maximum healing journey. Amenities include a library, a courtyard, a family visitation room, daily meals provided, and a hair salon.

(847) 869-1300

Quality ratings

Measured by Centers for Medicare & Medicaid Services (CMS)

Overall rating Info The Overall CMS Rating combines results from health inspections, staffing levels and quality measures. Health inspections carry the most weight. Staffing and quality scores can increase or decrease the final rating based on performance compared to state and national standards.
▲ 58.7% Above IL avg. ▲ 58.7% Above IL avg.IL average: 2.5Click the badge to see the full State ranking.Click here to see the full State ranking.
Health Inspection Info Based on the results of the facility's three most recent standard inspections and any complaint investigations. CMS reviews the number, scope, and severity of deficiencies, with more recent findings weighted more heavily.
▲ 8.1% Above IL avg. ▲ 8.1% Above IL avg.IL average: 2.8Click the badge to see the full State ranking.Click here to see the full State ranking.
Staffing Info Measures average nursing staff hours per resident per day, including Registered Nurses (RNs) and total nursing staff. Ratings are adjusted based on the level of care residents require and are compared to state and national benchmarks.
▼ 6.4% Below IL avg. ▼ 6.4% Below IL avg.IL average: 2.1Click the badge to see the full State ranking.Click here to see the full State ranking.
Quality Measures Info Based on clinical and physical health indicators reported to CMS, such as hospital readmissions, falls, pressure ulcers, and improvements in mobility. These measures reflect how well residents' health needs are being managed.
▲ 77.6% Above IL avg. ▲ 77.6% Above IL avg.IL average: 2.8Click the badge to see the full State ranking.Click here to see the full State ranking.

Staffing hours breakdown

Info Daily nursing hours per resident by staff type, reported to CMS. Higher is generally better — compare this facility to state and national averages to see where staffing stands.

Hours per resident per day — compared to Illinois state averages

Total nursing care / resident Info This home is ranked 157th out of 172 homes in Illinois for nurse hours. Total adjusted nursing hours per resident per day, combining RN, LPN, and aide time. CMS adjusts this for case-mix so facilities can be fairly compared.
2h 5m per day
Rank #157 / 172Nurse hours — State benchmarkedThis home is ranked 157th out of 172 homes in Illinois. Shows adjusted nurse hours per resident per day benchmarked to the Illinois average, with a ranking across 172 Illinois facilities. More hours mean more direct care. The national average is about 3.5 hrs; below 3.0 is a red flag.Rankings are based only on facilities in Illinois that report data for that category. Facilities without available data are excluded from the ranking.Click the rank badge to see the full State ranking.Click here to see the full State ranking.
This facility Illinois avg (3h 6m per day)
vs Illinois avg
-33%

3 of 6 metrics below state avg

Standout metric Weekend RN is +104% above state avg
Staff typeHours / Day / Residentvs state avg
Registered Nurse (RN) Info RNs hold the highest nursing license and can assess residents, interpret test results, and direct care plans. More RN hours per day often signals stronger clinical oversight and faster response to health changes. 1h 0m per day ▲ 37% State avg: 44m per day · National avg: 41m per day
LPN / LVN Info Licensed Practical Nurses (LPNs) or Licensed Vocational Nurses (LVNs) deliver routine hands-on care — medication administration, wound dressing, and monitoring vital signs. They work under RN supervision and make up a large share of daily bedside care. 33m per day ▼ 14% State avg: 38m per day · National avg: 52m per day
Nurse Aide Info Certified Nurse Aides (CNAs) provide the most direct day-to-day assistance: bathing, dressing, feeding, and mobility. Nurse aide hours are typically the largest staffing category and directly affect residents' quality of life. 1h 40m per day ▼ 22% State avg: 2h 8m per day · National avg: 2h 21m per day
Weekend Total Nursing Info Combined nursing hours (RN + LPN + Nurse Aide) per resident per day on weekends. Staffing often drops on weekends — this figure reveals whether the facility maintains adequate coverage outside of weekday hours. 3h 14m per day ▲ 5% State avg: 3h 5m per day · National avg: 3h 26m per day
Physical Therapist Info Hours per resident per day provided by licensed Physical Therapists (PTs) or PT Assistants. PT services help residents recover mobility after injury or illness and are especially important for post-acute (short-stay) rehabilitation. 3m per day ▼ 11% State avg: 3m per day · National avg: 4m per day
Weekend RN Info Registered nurse hours specifically on weekends. Facilities sometimes reduce RN presence on Saturdays and Sundays — a low weekend RN figure compared to weekday hours can indicate reduced clinical oversight when most administrative staff are absent. 1h 9m per day ▲ 104% State avg: 34m per day · National avg: 29m per day

Capacity and availability

This home usually has availability

Higher occupancy than the Illinois average: 69.3%
Occupancy rate
82.5% Rank #73 / 204Occupancy rate — State benchmarkedThis home is ranked 73rd out of 204 homes in Illinois. Shows this facility's occupancy rate versus the Illinois average, with its Statewide rank out of 204. Higher occupancy signals strong local demand and financial stability.Rankings are based only on facilities in Illinois that report data for that category. Facilities without available data are excluded from the ranking.Click the rank badge to see the full State ranking.Click here to see the full State ranking.
Avg. Length of Stay
173 days
Bed community size
57-bed community Rank #275 / 426Bed count — State benchmarkedThis home is ranked 275th out of 426 homes in Illinois. Shows this facility's certified or reported bed count compared to other Illinois facilities. Larger communities may offer more amenities, programs, and on-site services for residents and families.Rankings are based only on facilities in Illinois that report data for that category. Facilities without available data are excluded from the ranking.Click the rank badge to see the full State ranking.Click here to see the full State ranking.
A moderately sized community that may balance personal attention with shared amenities and social activities.
Years in operation
20 years in operation Rank #67 / 145Years in operation — State benchmarkedThis home is ranked 67th out of 145 homes in Illinois. Shows how long this facility has been in operation compared to other Illinois facilities. Longer operating histories may benefit residents, families, and staff.Rankings are based only on facilities in Illinois that report data for that category. Facilities without available data are excluded from the ranking.Click the rank badge to see the full State ranking.Click here to see the full State ranking.
A longer operating history, which may indicate experience navigating regulations and delivering ongoing care.
Walk Score
Walk Score: 88 / 100 Rank #50 / 648Walk Score — State benchmarkedThis home is ranked 50th out of 648 homes in Illinois. Shows how walkable this facility's neighborhood is compared to the average Walk Score across Illinois facilities. Higher scores benefit residents, families, and staff.Rankings are based only on facilities in Illinois that report data for that category. Facilities without available data are excluded from the ranking.Click the rank badge to see the full State ranking.Click here to see the full State ranking.
Very walkable. Most errands can be accomplished on foot, and many essentials are within a short walk.
BBB Rating
BBB Rating: A+ (Not Accredited)
An independent rating from the Better Business Bureau based on factors such as complaint history, transparency, and business practices.
How BBB ratings work

Staffing

Key information about the people who lead and staff this community.

Leadership

ContactBusiness Manager

Therapy & Rehabilitation

2 services
Rehabilitation Services
Short-Term Rehab

Additional Services

3 services
Short-Term Rehabilitation
Long-Term Living
Psychiatric Rehabilitation

Contact Aperion Care Evanston

Inspection History

In Illinois, the Department of Public Health, Office of Health Care Regulation conducts annual unannounced surveys to assess compliance with state and federal healthcare facility standards.

Since 2022 · 4 years of data 28 deficiencies 13 inspections

Inspection Scorecard Info This scorecard compares key inspection, citation, and complaint metrics at this facility against the Illinois state average. Metrics rated ≥15% worse than average are highlighted in red; those ≥15% better are highlighted in green.

Since 2022 vs. Illinois state average
Overall vs. IL average 4 Worse Metrics worse than Illinois average:
• Total deficiencies (300% above)
• Deficiencies per year (289% above)
• Deficiencies per inspection (144% above)
• Total inspections (63% above)
0 Better No metrics in this bucket.
Latest Inspection January 2, 2026 Complaint Investigation

Deficiencies Info Deficiencies are formal regulatory issues recorded during state inspections.

This FacilityIL Averagevs. IL Avg
Total deficiencies Info Formal regulatory issues recorded by inspectors across all inspection types. 287 This facility has 300% more total deficiencies than a typical Illinois nursing home (28 vs. IL avg 7).↑ 300% worse
Deficiencies per year Info Average deficiencies per year since 2022. 71.8 This facility has 289% more deficiencies per year than a typical Illinois nursing home (7 vs. IL avg 1.8).↑ 289% worse
Deficiencies per inspection Info Average deficiencies per inspection. 2.20.9 This facility has 144% more deficiencies per inspection than a typical Illinois nursing home (2.2 vs. IL avg 0.9).↑ 144% worse

Inspections Info State inspections evaluate whether the facility meets health and safety standards.

This FacilityIL Averagevs. IL Avg
Total inspections Info Combined count of all routine and focused inspections. Excludes complaint investigations. 138 This facility has 63% more total inspections than a typical Illinois nursing home (13 vs. IL avg 8).↑ 63% worse

Health Inspection History

Inspections since 2022
Total health inspections 12

Illinois average 10.4


Last Health inspection on Jul 2025

Total health citations
28 Rank #69 / 172Health citations — State benchmarkedThis home is ranked 69th out of 172 homes in Illinois. Shows this facility's total health deficiency citations benchmarked to the Illinois State average, with a ranking across all 172 IL facilities. Lower citation counts earn a better rank.Rankings are based only on facilities in Illinois that report data for that category. Facilities without available data are excluded from the ranking.Click the rank badge to see the full State ranking.Click here to see the full State ranking.

Illinois average 36.8

Citations per inspection
2.33 Rank #15 / 172Citations per inspection — State benchmarkedThis home is ranked 15th out of 172 homes in Illinois. Shows average deficiency citations per CMS inspection for this facility versus the Illinois mean across 172 facilities with citation data. Lower is better.Rankings are based only on facilities in Illinois that report data for that category. Facilities without available data are excluded from the ranking.Click the rank badge to see the full State ranking.Click here to see the full State ranking.

Illinois average 3.68


Health citations are formal notices following inspections when they fail to comply with safety and care standards.

15 of 28 citations resulted from standard inspections; and 13 of 28 resulted from complaint investigations.

Breakdown of citation severity (last 4 years)
Critical health citations
1
43% worse than Illinois average

Illinois average: 0.7


Serious health citations
1
72% better than Illinois average

Illinois average: 3.6

1 critical citation Illinois average: 0.7

1 serious citation Illinois average: 3.6

25 moderate citations Illinois average: 32

1 minor citation Illinois average: 0.5
Citations history (last 4 years)
Abuse/Neglect moderate citation Jul 06, 2025
Corrected

Resident Rights moderate citation May 07, 2025
Corrected

Abuse/Neglect moderate citation Apr 02, 2025
Corrected

Abuse/Neglect moderate citation Mar 29, 2025
Corrected

Staffing Data

Reporting period: October 1 – December 31, 2025 (Q4 2025). Source: CMS Payroll-Based Journal report.

Total staff 89
Employees 66
Contractors 23
Staff to resident ratio 1.65 : 1
8% fewer staff per resident than Illinois average
Illinois average ratio: 1.80 : 1 Illinois average ratio: 1.80 : 1See full Illinois ranking
Avg staff/day 30
Average shift 6.9 hours
9% worse than Illinois average
Illinois average: 7.6 hours Illinois average shift: 7.6 hoursSee full Illinois ranking
Total staff hours (quarter) 19,155

Nursing staff breakdown

Q4 2025 · Oct 1 – Dec 31 More info This data comes from the CMS Payroll-Based Journal report covering October 1 – December 31, 2025.
Registered Nurse

Manages medical care and health needs.

RN Staff Info 14 total: 13 full-time employees and 1 contractor. 14
Average shift length Info Average shift length. Calculated as total hours divided by days worked and average staff per day. 9.2 hours
Licensed Practical Nurse

Assists with medical care and medications.

LPN Staff Info All 11 LPN Staff are full-time employees. No contractors work on this role. 11
Average shift length Info Average shift length. Calculated as total hours divided by days worked and average staff per day. 8 hours
Certified Nursing Assistant

Helps with daily care and mobility.

CNA Staff Info All 28 CNA Staff are full-time employees. No contractors work on this role. 28
Average shift length Info Average shift length. Calculated as total hours divided by days worked and average staff per day. 6.4 hours

Contractor staffing

Q4 2025 · Oct 1 – Dec 31 More info This data comes from the CMS Payroll-Based Journal report covering October 1 – December 31, 2025.

Total hours from contractors

5.3%

1,024 contractor hours this quarter

Qualified Social Worker: 7 Respiratory Therapy Technician: 5 Physical Therapy Assistant: 4 Physical Therapy Aide: 3 Speech Language Pathologist: 3 Registered Nurse: 1

Staff by category

Q4 2025 · Oct 1 – Dec 31 More info This data comes from the CMS Payroll-Based Journal report covering October 1 – December 31, 2025.
Certified Nursing Assistant280288,14692100%6.4
Registered Nurse131143,26892100%9.2
Licensed Practical Nurse110112,22792100%8
Clinical Nurse Specialist4041,3046672%8
Other Dietary Services Staff3039099199%6.7
Administrator1015126470%8
Dietitian1015126470%8
Dental Services Staff1015126470%8
RN Director of Nursing1014405560%8
Nurse Practitioner3033203740%8
Qualified Social Worker0772474953%4.5
Physical Therapy Assistant0442415257%4.6
Respiratory Therapy Technician0552164347%4.5
Speech Language Pathologist0331674347%3.9
Physical Therapy Aide0331333033%4.4
28 Certified Nursing Assistant
% of Days 100%
14 Registered Nurse
% of Days 100%
11 Licensed Practical Nurse
% of Days 100%
4 Clinical Nurse Specialist
% of Days 72%
3 Other Dietary Services Staff
% of Days 99%
1 Administrator
% of Days 70%
1 Dietitian
% of Days 70%
1 Dental Services Staff
% of Days 70%
1 RN Director of Nursing
% of Days 60%
3 Nurse Practitioner
% of Days 40%
7 Qualified Social Worker
% of Days 53%
4 Physical Therapy Assistant
% of Days 57%
5 Respiratory Therapy Technician
% of Days 47%
3 Speech Language Pathologist
% of Days 47%
3 Physical Therapy Aide
% of Days 33%

Penalties and fines

Includes penalties issued in 2024

Federal penalties imposed by CMS for regulatory violations, including civil money penalties (fines) and denials of payment for new Medicare/Medicaid admissions.

Source: CMS Penalties Database (Data as of Jan 2026)

Total fines amount $52K Rank #108 / 173Federal fines — State benchmarkedThis home is ranked 108th out of 173 homes in Illinois. Shows this facility's cumulative CMS federal fine dollars versus the Illinois average among facilities with fines, and where it ranks among 173 facilities in the pool. Lower total dollars mean a better rank.Rankings are based only on facilities in Illinois that report data for that category. Facilities without available data are excluded from the ranking.Click the rank badge to see the full State ranking.Click here to see the full State ranking.
63% lower than Illinois average

Illinois average: $143K

Number of fines 1
66% fewer fines than Illinois average

Illinois average: 3.0

Payment Denials Info Serious action where Medicare and/or Medicaid temporarily stops payments for new residents until issues are fixed. 2
89% more payment denials than Illinois average

Illinois average: 1.1

Fines amount comparison
This facility $52K
Illinois average $143K
Penalty History

Penalties are imposed by CMS for violations of federal nursing home regulations.

2 penalties in the past 3 years

Multiple penalties were reported in the last 3 years.

Civil Money Penalty Info Fines imposed for noncompliance, which can be assessed per day or per instance of violation. Jan 9, 2024
$52K
Payment Denial Info Serious action where Medicare and/or Medicaid temporarily stops payments for new residents until issues are fixed. Jan 9, 2024
37 days

Last updated: Jan 2026

Quality of care over time

These measures show how residents usually do over time at this home, based on health outcomes and preventive care.

High-risk clinical events score Info A composite score based on pressure ulcers, falls with injury, weight loss, walking ability decline, and activities of daily living decline. 3.8
61% better than Illinois average

Illinois average: 9.7

Functional decline score Info A composite score based on activities of daily living decline, walking ability decline, and incontinence. 7.5
59% better than Illinois average

Illinois average: 18.6

Long-stay resident measures
Significantly above average Info CMS star rating based on long-stay quality measure performance. 5 stars = significantly above average, 1 star = significantly below average.
Need for Help with Daily Activities Increased Info Percent of long-stay residents whose need for help with daily activities has increased 3.8%
76% better than Illinois average

Illinois average: 15.5%

Walking Ability Worsened Info Percent of long-stay residents whose ability to move independently worsened 1.1%
94% better than Illinois average

Illinois average: 18.4%

Low Risk Residents with Bowel/Bladder Incontinence Info Percent of low risk long-stay residents who lose control of their bowels or bladder 17.8%
18% better than Illinois average

Illinois average: 21.6%

Falls with Major Injury Info Percent of long-stay residents experiencing one or more falls with major injury 4.5%
35% worse than Illinois average

Illinois average: 3.4%

High Risk Residents with Pressure Ulcers Info Percent of long-stay high risk residents with pressure ulcers 5.5%
5% worse than Illinois average

Illinois average: 5.3%

Urinary Tract Infection Info Percent of long-stay residents with a urinary tract infection 0.0%
100% better than Illinois average

Illinois average: 1.8%

Lost Too Much Weight Info Percent of long-stay residents who lose too much weight 4.1%
37% better than Illinois average

Illinois average: 6.5%

Depressive Symptoms Info Percent of long-stay residents who have depressive symptoms 92.2%
92% worse than Illinois average

Illinois average: 48.1%

Antipsychotic Use Info Percent of long-stay residents who received an antipsychotic medication 39.9%
97% worse than Illinois average

Illinois average: 20.2%

Pneumococcal Vaccine Info Percent of long-stay residents assessed and appropriately given the pneumococcal vaccine 55.9%
37% worse than Illinois average

Illinois average: 89.2%

Influenza Vaccine Info Percent of long-stay residents assessed and appropriately given the seasonal influenza vaccine 89.8%
In line with Illinois average

Illinois average: 91.6%

Hospitalizations per 1,000 days Info Number of hospitalizations per 1,000 long-stay resident days. 1.58
23% better than Illinois average

Illinois average: 2.05

ED visits per 1,000 days Info Number of outpatient emergency department visits per 1,000 long-stay resident days. 0.95
58% better than Illinois average

Illinois average: 2.25

Short-stay resident measures
Above average Info CMS star rating based on short-stay quality measure performance. 5 stars = much above average, 1 star = much below average.
Pneumococcal Vaccine Info Percent of short-stay residents assessed and appropriately given the pneumococcal vaccine 32.6%
52% worse than Illinois average

Illinois average: 68.3%

Antipsychotic medication increase Info Percent of short-stay residents who newly received an antipsychotic medication 3.0%
30% worse than Illinois average

Illinois average: 2.3%

Influenza Vaccine Info Percent of short-stay residents assessed and appropriately given the seasonal influenza vaccine 24.6%
61% worse than Illinois average

Illinois average: 63.0%

Re-hospitalized after SNF stay Info Percentage of short-stay residents who were re-hospitalized after their nursing home admission. 15.6%
40% better than Illinois average

Illinois average: 26.2%

Emergency department visits Info Percentage of short-stay residents who had an outpatient emergency department visit. 12.8%
9% better than Illinois average

Illinois average: 14.0%

Falls with major injury Info Percentage of SNF residents who experience falls with major injury during their stay. 0.0%
100% better than Illinois average

Illinois average: 0.8%

Ability to care for self at discharge Info Percentage of residents at or above expected ability to care for themselves at discharge. 69.6%
30% better than Illinois average

Illinois average: 53.7%

Breakdown by payment type

Medicare

18% of new residents, usually for short-term rehab.

Typical stay 3 - 4 months

Private pay

66% of new residents, often for short stays.

Typical stay 10 - 11 months

Medicaid

16% of new residents, often for long-term daily care.

Typical stay 7 - 8 months

Facility Characteristics

Source: CMS Long-Term Care Facility Characteristics (Data as of Jan 2026)

Total residents 54
Medicare
5
9.3% of residents
Medicaid
49
90.7% of residents
Programs & Services
Residents Group

Residents meet regularly to discuss policies, care quality, and activities

Active Resident Council

Organized group of residents that meets regularly to discuss facility policies, quality of life, and activities.

Finances and operations

Based on CMS SNF Cost Report for fiscal year ending in 12/2023.

Privately-owned community
Operated by a single business entity.
Net patient revenue Info Net patient revenue — what the home actually collects for resident care, after contractual allowances, bad debt and discounts are subtracted from its gross charges (CMS cost report, Worksheet G-3). It covers resident care only; money the home earns from other sources is shown separately as "Other income."
$5.8M
Net patient income Info Net patient income: net patient revenue minus the home's total operating expenses. A positive figure means it earns more from resident care than it spends to deliver it; a negative figure means the opposite. It excludes non-operating "other income."
-$694.6K
Privately-owned community Operated by a single business entity.
Net patient revenue Info Net patient revenue — what the home actually collects for resident care, after contractual allowances, bad debt and discounts are subtracted from its gross charges (CMS cost report, Worksheet G-3). It covers resident care only; money the home earns from other sources is shown separately as "Other income."
$5.8M Rank #155 / 171Revenue — State benchmarkedThis home is ranked 155th out of 171 homes in Illinois. Shows this facility's annual revenue compared to the Illinois average. Higher revenue generally means more resources for staffing and capital — read alongside Payroll %.Rankings are based only on facilities in Illinois that report data for that category. Facilities without available data are excluded from the ranking.Click the rank badge to see the full State ranking.Click here to see the full State ranking.
Net patient income Info Net patient income: net patient revenue minus the home's total operating expenses. A positive figure means it earns more from resident care than it spends to deliver it; a negative figure means the opposite. It excludes non-operating "other income."
-$694.6K
Other income Info Money the home earns outside of resident care — such as investments, grants, rentals and other non-operating sources (CMS cost report, Worksheet G-3). It is tracked separately from net patient revenue: it is not part of that figure, and it is not included in net patient income.
$279.7K
Payroll costs Info Staff salaries plus wage-related costs — benefits such as payroll taxes, health insurance and retirement — from the home's own accounting records (CMS cost report, Worksheet A). Contract or agency labor is counted separately, under other operating costs. Rank #160 / 171Payroll — State benchmarkedThis home is ranked 160th out of 171 homes in Illinois. Shows total annual staff payroll benchmarked to the Illinois average. Higher payroll investment relative to peers often signals better staffing and less reliance on cheaper contract labor.Rankings are based only on facilities in Illinois that report data for that category. Facilities without available data are excluded from the ranking.Click the rank badge to see the full State ranking.Click here to see the full State ranking.
$3.2M 54.5% of net patient revenue Info Payroll as a share of revenue: staff salaries and wage-related benefits divided by net patient revenue. A higher figure means more of each revenue dollar goes to staff pay. Rank #68 / 171Payroll % — State benchmarkedThis home is ranked 68th out of 171 homes in Illinois. Shows payroll as a percentage of revenue versus the Illinois average. Well-run Illinois facilities typically land around 54–67% — the top third Statewide. Below 25% may signal understaffing or heavy agency use — read with Staffing ratings.Rankings are based only on facilities in Illinois that report data for that category. Facilities without available data are excluded from the ranking.Click the rank badge to see the full State ranking.Click here to see the full State ranking.
Other operating costs Info Everything it costs to run the home apart from payroll — food, utilities, supplies, maintenance, contract labor and administration. Calculated as total operating expense minus payroll (staff salaries and wage-related benefits).
$3.3M
Total costs Info The home's total operating expense for the year — all the costs of running it, salaries included (CMS cost report, Worksheet G-3).
$6.5M

What does this home offer?

Housing options icon

Housing Options: Private Rooms / Semi-Private Rooms

Building type icon
Building type icon

Building Type: Two-story

Transportation services icon

Transportation Services

Fitness and recreation icon

Fitness and Recreation

Who this home usually serves

TYPE OF STAY

Primarily short stays

Residents typically stay for brief periods, with frequent admissions and discharges throughout the year.

Most new residents arrive under private pay (66% of admissions), and a typical private pay stay runs around 10 - 11 months.

Admissions
68 total

Coverage residents most often arrive under.

Medicare 18%
Private pay 66%
Medicaid 16%
Discharges
106 total

Coverage residents most often leave under.

Medicare 20%
Private pay 63%
Medicaid 17%

Places of interest near Aperion Care Evanston

Address 0.3 miles from city center Info Estimated distance in miles from Evanston's city center to Aperion Care Evanston's address, calculated via Google Maps. — 7.47 miles to nearest hospital (Resurrection Medical Center - Emergency Fast Track)

Calculate Travel Distance to Aperion Care Evanston

Add your location

Address

Compare Nursing Homes around Evanston

The information below is reported by the Illinois Department of Public Health, Office of Health Care Regulation.

4 facilities compared · CMS & IL Dept. of Health data

Westminster Place
NH
AL
IL
MC
RC
Evanston (Grant Street)
105
Facility 105
IL AVG 86
Rank #116 / 426
64.8%
Facility 64.8%
IL AVG 69.3%
Rank #140 / 204
-6%
5.50
Facility 5.50
IL AVG 3.10
Rank #9 / 172
+47%+77%
$0
Facility $0
IL AVG $151.3k
Rank #1 / 173
7
Facility 7
IL AVG 36.8
Rank #5 / 172
2.3
Facility 2.3
IL AVG 3.7
Rank #15 / 172
-60-
44
Facility 44
IL AVG 51
Rank #392 / 648
Presbyterian Homes
$26.3M
Facility $26.3M
IL AVG $12.2M
Rank #2 / 171
$15.3M
Facility $15.3M
IL AVG $4.8M
Rank #8 / 171
58.2%
Facility 58.2%
IL AVG 44.3%
Rank #167 / 171
145026
The Mather
NH
AL
IL
MC
Evanston (Davis Street)
22
Facility 22
IL AVG 86
Rank #401 / 426
76.3%
Facility 76.3%
IL AVG 69.3%
Rank #95 / 204
+10%
5.88
Facility 5.88
IL AVG 3.10
Rank #5 / 172
+102%+90%
$0
Facility $0
IL AVG $151.3k
Rank #1 / 173
7
Facility 7
IL AVG 36.8
Rank #5 / 172
3.5
Facility 3.5
IL AVG 3.7
Rank #82 / 172
-30-
95
Facility 95
IL AVG 51
Rank #18 / 648
Mather Senior Living Communities LLC
$24.7M
Facility $24.7M
IL AVG $12.2M
Rank #41 / 171
$10.8M
Facility $10.8M
IL AVG $4.8M
Rank #29 / 171
43.6%
Facility 43.6%
IL AVG 44.3%
Rank #90 / 171
146145
Aperion Care Evanston
NH
AL
Evanston
57
Facility 57
IL AVG 86
Rank #275 / 426
82.5%
Facility 82.5%
IL AVG 69.3%
Rank #73 / 204
+19%
2.09
Facility 2.09
IL AVG 3.10
Rank #157 / 172
+11%-33%
$52.2k
Facility $52.2k
IL AVG $151.3k
Rank #108 / 173
28
Facility 28
IL AVG 36.8
Rank #69 / 172
2.3
Facility 2.3
IL AVG 3.7
Rank #15 / 172
253A+
88
Facility 88
IL AVG 51
Rank #50 / 648
-
$5.8M
Facility $5.8M
IL AVG $12.2M
Rank #155 / 171
$3.2M
Facility $3.2M
IL AVG $4.8M
Rank #160 / 171
54.5%
Facility 54.5%
IL AVG 44.3%
Rank #68 / 171
146058
Three Crowns Park
NH
AL
MC
RC
Evanston (Mcdaniel Avenue)
18
Facility 18
IL AVG 86
Rank #405 / 426
--
7.33
Facility 7.33
IL AVG 3.10
Rank #2 / 172
+68%+137%
$0
Facility $0
IL AVG $151.3k
Rank #1 / 173
2
Facility 2
IL AVG 36.8
Rank #1 / 172
1.0
Facility 1.0
IL AVG 3.7
Rank #1 / 172
125-
68
Facility 68
IL AVG 51
Rank #163 / 648
Three Crowns Park---146199

Financial Assistance for
Nursing Home in Illinois

Aperion Care Evanston is located in Evanston, Illinois.
Here are the financial assistance programs available to residents in Illinois.

Get Financial aid guidance

Community Care Program

Illinois CCP

Age 60+
General Illinois resident, at risk of nursing home placement.
Income Limits (2025) ~$1,215/month individual
Asset Limits $17,500 individual, excludes home, car
IL

High demand in urban areas; waitlists possible.

Benefits
In-home care (3-5 hours/day) Adult day services ($65/day) Emergency home response systems ($30/month)

Illinois Respite Program

IL Respite (via NFCSP)

Age Caregiver of someone 60+ (or with dementia)
General Illinois resident.
Income Limits No strict limit; prioritizes low-income.
Asset Limits Not applicable.
IL

Limited slots; urban/rural balance.

Benefits
In-home respite (4-6 hours/day) Adult day care (~$65/day) Short-term facility care (up to 5 days)

Supportive Living Program (SLP)

Illinois Medicaid Supportive Living Program

Age 65+ or 22-64 with disability
General Illinois resident, Medicaid-eligible, needs moderate assistance (not nursing home-level).
Income Limits (2025) ~$2,829/month (300% FBR, individual); QIT allowed.
Asset Limits $2,000 (individual), $3,000 (couple) (excludes home, car).
IL

~200 SLP sites statewide; room/board not covered.

Benefits
Personal care (5-7 hours/day, e.g., bathing, mobility) Meals Housekeeping Medication management Respite (~240 hours/year)

Persons Who Are Elderly Waiver

Illinois Medicaid Elderly Waiver

Age 65+
General Illinois resident, Medicaid-eligible, nursing home-level care need.
Income Limits (2025) ~$2,829/month 300% FBR, individual
Asset Limits $2,000 (individual), $3,000 (couple).
IL

Part of HealthChoice Illinois; consumer-directed options available.

Benefits
Personal care (5-7 hours/day, e.g., dressing, eating) Homemaker Adult day care (~$60/day) Respite (240 hours/year) Home mods ($1,000 avg.)

Medicare Savings Program (MSP)

Illinois Medicare Savings Program

Age 65+ or disabled
General Illinois resident, Medicare Part A/B.
Income Limits (2025) ~$2,510/month (QMB), ~$3,380/month (SLMB), ~$3,598/month (QI)—individual.
Asset Limits $9,430 (individual), $14,130 (couple).
IL

Three tiers; no waitlist.

Benefits
Covers Part B premiums ($174.70/month) Deductibles ($240/year) Copays (~20%)

Optional State Supplementation (OSS)

Illinois Optional State Supplementation

Age 65+ or disabled
General Illinois resident, in approved facility, SSI recipient or low-income.
Income Limits (2025) ~$1,004/month including SSI
Asset Limits $2,000 (individual), $3,000 (couple).
IL

~$50-$500/month based on facility type.

Benefits
Cash (~$50-$500/month) for room/board in personal care homes or SLFs

VA Aid and Attendance (A&A) and Housebound Benefits

Illinois VA Aid and Attendance/Housebound

Age 65+ or disabled veteran/spouse
General Illinois resident, wartime service, need for ADL help (A&A) or homebound.
Income Limits (2025) Net income < ~$1,984/month (veteran with dependent, A&A); pension offsets income.
Asset Limits ~$155,356 net worth limit
IL

High veteran demand in urban/rural areas.

Benefits
Cash (~$1,433-$2,642/month veteran, ~$951-$1,318 spouse) for care costs (e.g., in-home, assisted living)

Frequently Asked Questions about Aperion Care Evanston

Is Aperion Care Evanston in a walkable area?

Aperion Care Evanston has a walk score of 88. Very walkable. Most errands can be accomplished on foot, and many essentials are within a short walk.

What is the occupancy rate at Aperion Care Evanston?

Aperion Care Evanston's occupancy is 88.2%.

Are there photos of Aperion Care Evanston?

Yes — there are 8 photos of Aperion Care Evanston in the photo gallery on this page.

What is the address of Aperion Care Evanston?

Aperion Care Evanston is located at 1300 Oak Ave, Evanston, IL 60201.

What is the phone number of Aperion Care Evanston?

(847) 869-1300 will put you in contact with the team at Aperion Care Evanston.

Is Aperion Care Evanston Medicare or Medicaid certified?

Yes — Aperion Care Evanston is a CMS-certified provider of Medicare and Medicaid.

Guides for Better Senior Living

Care Cost Calculator: See Prices in Your Area

Nursing Home Data Explorer

Don’t Wait Too Long: 7 Red Flag Signs Your Parent Needs Assisted Living Now

The True Cost of Assisted Living in 2025 – And How Families Are Paying For It

Understanding Senior Living Costs: Pricing Models, Discounts & Financial Assistance