Westminster Place
Nursing Home, Assisted Living, Independent Living, Memory Care & Respite Care · Evanston, IL
CMS overall rating Info CMS (the Centers for Medicare & Medicaid Services) is the federal agency that rates nursing home quality. Its Overall Rating runs from 1 to 5 stars, combining health inspections, staffing, and quality measures, with inspections weighted most heavily.

Westminster Place

Nursing Home, Assisted Living, Independent Living, Memory Care & Respite Care · Evanston, IL
CMS overall rating Info CMS (the Centers for Medicare & Medicaid Services) is the federal agency that rates nursing home quality. Its Overall Rating runs from 1 to 5 stars, combining health inspections, staffing, and quality measures, with inspections weighted most heavily.
Calculator: See prices in your area
Westminster Place accepts Medicare and private pay.

Overview of Westminster Place

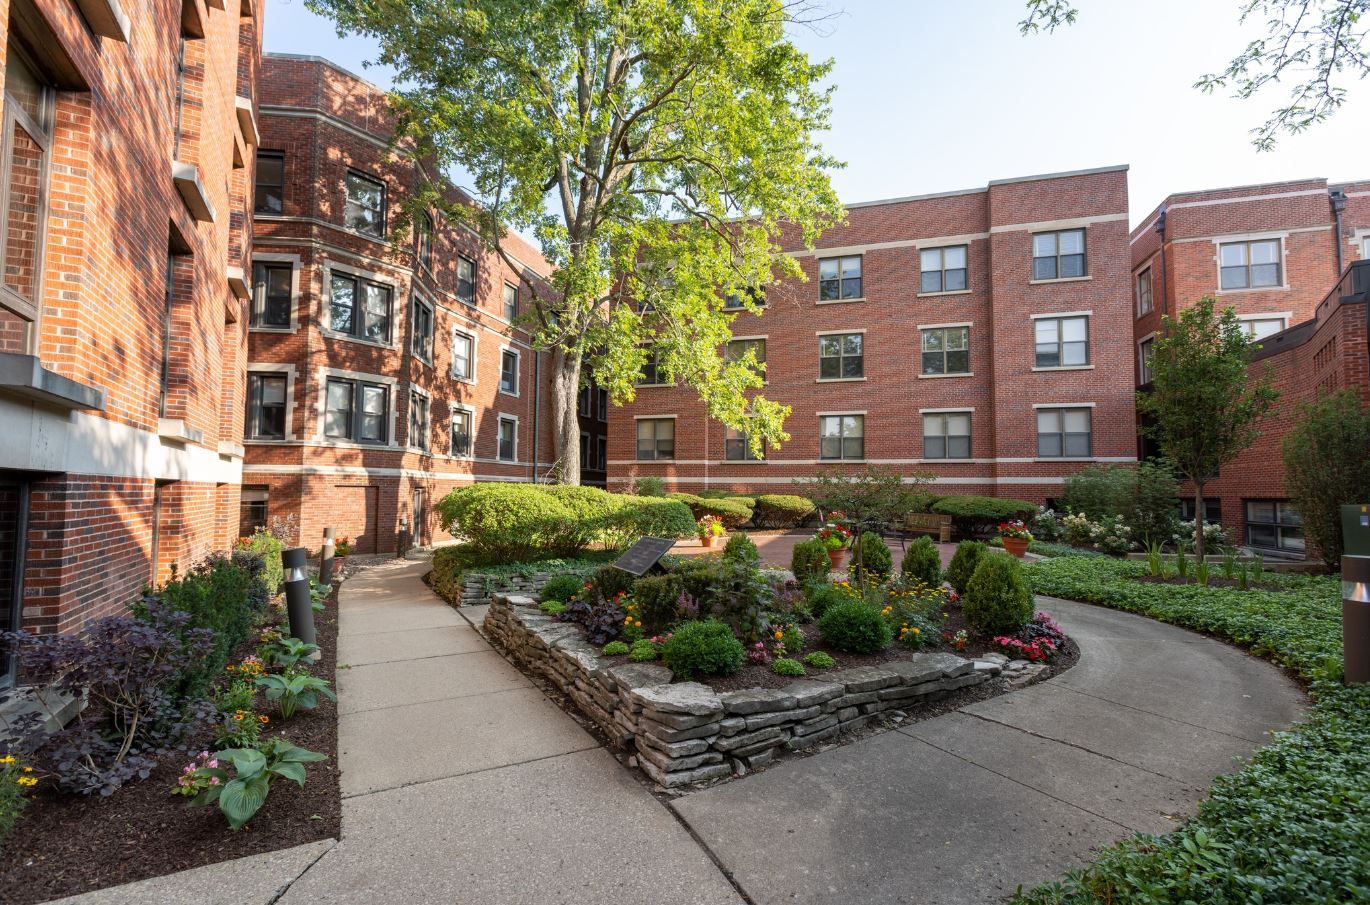
The sister community of Ten Twenty Grove, Westminster Place, is an active 55+ community that genuinely understands the aging process and is dedicated to providing its residents with the highest care. Specializing in independent living, assisted living, memory support, long-term care, respite care, and short-term rehab services, the community’s specially trained staff is committed to helping seniors achieve maximum independence with ability-centered programming that promotes individuality.

As a Presbyterian senior living home, Westminster Place ensures comfort and flexibility as the focus of all its community features. Residents can immerse themselves in exclusive activities scheduled for them to participate in, such as the exclusive Kimble Fitness Center for health and wellness, immediate access to healthcare at the McGaw Care Center, and exploring the vibrant and engaging social life downtown.

(847) 570-3422

Quality ratings

Measured by Centers for Medicare & Medicaid Services (CMS)

Overall rating Info The Overall CMS Rating combines results from health inspections, staffing levels and quality measures. Health inspections carry the most weight. Staffing and quality scores can increase or decrease the final rating based on performance compared to state and national standards.
▲ 98.4% Above IL avg. ▲ 98.4% Above IL avg.IL average: 2.5Click the badge to see the full State ranking.Click here to see the full State ranking.
Health Inspection Info Based on the results of the facility's three most recent standard inspections and any complaint investigations. CMS reviews the number, scope, and severity of deficiencies, with more recent findings weighted more heavily.
▲ 80.1% Above IL avg. ▲ 80.1% Above IL avg.IL average: 2.8Click the badge to see the full State ranking.Click here to see the full State ranking.
Staffing Info Measures average nursing staff hours per resident per day, including Registered Nurses (RNs) and total nursing staff. Ratings are adjusted based on the level of care residents require and are compared to state and national benchmarks.
▲ 133.9% Above IL avg. ▲ 133.9% Above IL avg.IL average: 2.1Click the badge to see the full State ranking.Click here to see the full State ranking.
Quality Measures Info Based on clinical and physical health indicators reported to CMS, such as hospital readmissions, falls, pressure ulcers, and improvements in mobility. These measures reflect how well residents' health needs are being managed.
▲ 77.6% Above IL avg. ▲ 77.6% Above IL avg.IL average: 2.8Click the badge to see the full State ranking.Click here to see the full State ranking.

Staffing hours breakdown

Info Daily nursing hours per resident by staff type, reported to CMS. Higher is generally better — compare this facility to state and national averages to see where staffing stands.

Hours per resident per day — compared to Illinois state averages

Total nursing care / resident Info This home is ranked 9th out of 172 homes in Illinois for nurse hours. Total adjusted nursing hours per resident per day, combining RN, LPN, and aide time. CMS adjusts this for case-mix so facilities can be fairly compared.
5h 30m per day
Rank #9 / 172Nurse hours — State benchmarkedThis home is ranked 9th out of 172 homes in Illinois. Shows adjusted nurse hours per resident per day benchmarked to the Illinois average, with a ranking across 172 Illinois facilities. More hours mean more direct care. The national average is about 3.5 hrs; below 3.0 is a red flag.Rankings are based only on facilities in Illinois that report data for that category. Facilities without available data are excluded from the ranking.Click the rank badge to see the full State ranking.Click here to see the full State ranking.
This facility Illinois avg (3h 6m per day)
vs Illinois avg
+77%

1 of 6 metrics below state avg

Standout metric Physical Therapist is +264% above state avg
Staff typeHours / Day / Residentvs state avg
Registered Nurse (RN) Info RNs hold the highest nursing license and can assess residents, interpret test results, and direct care plans. More RN hours per day often signals stronger clinical oversight and faster response to health changes. 2h 13m per day ▲ 201% State avg: 44m per day · National avg: 41m per day
LPN / LVN Info Licensed Practical Nurses (LPNs) or Licensed Vocational Nurses (LVNs) deliver routine hands-on care — medication administration, wound dressing, and monitoring vital signs. They work under RN supervision and make up a large share of daily bedside care. 14m per day ▼ 63% State avg: 38m per day · National avg: 52m per day
Nurse Aide Info Certified Nurse Aides (CNAs) provide the most direct day-to-day assistance: bathing, dressing, feeding, and mobility. Nurse aide hours are typically the largest staffing category and directly affect residents' quality of life. 3h 24m per day ▲ 60% State avg: 2h 8m per day · National avg: 2h 21m per day
Weekend Total Nursing Info Combined nursing hours (RN + LPN + Nurse Aide) per resident per day on weekends. Staffing often drops on weekends — this figure reveals whether the facility maintains adequate coverage outside of weekday hours. 5h 31m per day ▲ 79% State avg: 3h 5m per day · National avg: 3h 26m per day
Physical Therapist Info Hours per resident per day provided by licensed Physical Therapists (PTs) or PT Assistants. PT services help residents recover mobility after injury or illness and are especially important for post-acute (short-stay) rehabilitation. 11m per day ▲ 264% State avg: 3m per day · National avg: 4m per day
Weekend RN Info Registered nurse hours specifically on weekends. Facilities sometimes reduce RN presence on Saturdays and Sundays — a low weekend RN figure compared to weekday hours can indicate reduced clinical oversight when most administrative staff are absent. 1h 51m per day ▲ 226% State avg: 34m per day · National avg: 29m per day

Capacity and availability

This home usually has availability

Lower occupancy than the Illinois average: 69.3%
Occupancy rate
64.8% Rank #140 / 204Occupancy rate — State benchmarkedThis home is ranked 140th out of 204 homes in Illinois. Shows this facility's occupancy rate versus the Illinois average, with its Statewide rank out of 204. Higher occupancy signals strong local demand and financial stability.Rankings are based only on facilities in Illinois that report data for that category. Facilities without available data are excluded from the ranking.Click the rank badge to see the full State ranking.Click here to see the full State ranking.
Avg. Length of Stay
51 days
Bed community size
105-bed community Rank #116 / 426Bed count — State benchmarkedThis home is ranked 116th out of 426 homes in Illinois. Shows this facility's certified or reported bed count compared to other Illinois facilities. Larger communities may offer more amenities, programs, and on-site services for residents and families.Rankings are based only on facilities in Illinois that report data for that category. Facilities without available data are excluded from the ranking.Click the rank badge to see the full State ranking.Click here to see the full State ranking.
A larger shared setting that may offer more common spaces and organized community services.
Walk Score
Walk Score: 44 / 100 Rank #392 / 648Walk Score — State benchmarkedThis home is ranked 392nd out of 648 homes in Illinois. Shows how walkable this facility's neighborhood is compared to the average Walk Score across Illinois facilities. Higher scores benefit residents, families, and staff.Rankings are based only on facilities in Illinois that report data for that category. Facilities without available data are excluded from the ranking.Click the rank badge to see the full State ranking.Click here to see the full State ranking.
Somewhat walkable. A few nearby services may be reachable on foot, but most trips require transportation.

Contact Westminster Place

Staffing Data

Reporting period: October 1 – December 31, 2025 (Q4 2025). Source: CMS Payroll-Based Journal report.

Total staff 191
Employees 162
Contractors 29
Staff to resident ratio 3.41 : 1
90% more staff per resident than Illinois average
Illinois average ratio: 1.80 : 1 Illinois average ratio: 1.80 : 1See full Illinois ranking
Avg staff/day 64
Average shift 6.6 hours
13% worse than Illinois average
Illinois average: 7.6 hours Illinois average shift: 7.6 hoursSee full Illinois ranking
Total staff hours (quarter) 38,954

Nursing staff breakdown

Q4 2025 · Oct 1 – Dec 31 More info This data comes from the CMS Payroll-Based Journal report covering October 1 – December 31, 2025.
Registered Nurse

Manages medical care and health needs.

RN Staff Info 40 total: 39 full-time employees and 1 contractor. 40
Average shift length Info Average shift length. Calculated as total hours divided by days worked and average staff per day. 7.3 hours
Licensed Practical Nurse

Assists with medical care and medications.

LPN Staff Info All 6 LPN Staff are full-time employees. No contractors work on this role. 6
Average shift length Info Average shift length. Calculated as total hours divided by days worked and average staff per day. 6.6 hours
Certified Nursing Assistant

Helps with daily care and mobility.

CNA Staff Info All 88 CNA Staff are full-time employees. No contractors work on this role. 88
Average shift length Info Average shift length. Calculated as total hours divided by days worked and average staff per day. 6.9 hours

Contractor staffing

Q4 2025 · Oct 1 – Dec 31 More info This data comes from the CMS Payroll-Based Journal report covering October 1 – December 31, 2025.

Total hours from contractors

9.7%

3,791 contractor hours this quarter

Physical Therapy Aide: 7 Speech Language Pathologist: 7 Respiratory Therapy Technician: 6 Physical Therapy Assistant: 3 Qualified Social Worker: 2 Registered Nurse: 1 Occupational Therapy Assistant: 1 Occupational Therapy Aide: 1 Dental Services Staff: 1

Staff by category

Q4 2025 · Oct 1 – Dec 31 More info This data comes from the CMS Payroll-Based Journal report covering October 1 – December 31, 2025.
Certified Nursing Assistant8808818,78192100%6.9
Registered Nurse391408,24692100%7.3
Clinical Nurse Specialist160163,45092100%6.2
Licensed Practical Nurse6061,2999199%6.6
Other Dietary Services Staff7071,1518289%7.3
Respiratory Therapy Technician0661,0037986%4.9
Dental Services Staff2139756672%7.5
Speech Language Pathologist0778118289%4.8
Physical Therapy Aide0777207379%4.5
Administrator1014956672%7.5
Nurse Practitioner1014886571%7.5
Occupational Therapy Aide0114806470%7.5
Other Social Services Staff1014355863%7.5
Physical Therapy Assistant0332967986%3.5
Qualified Social Worker0222326571%3.6
Medical Director101481213%4
Occupational Therapy Assistant011471617%2.9
88 Certified Nursing Assistant
% of Days 100%
40 Registered Nurse
% of Days 100%
16 Clinical Nurse Specialist
% of Days 100%
6 Licensed Practical Nurse
% of Days 99%
7 Other Dietary Services Staff
% of Days 89%
6 Respiratory Therapy Technician
% of Days 86%
3 Dental Services Staff
% of Days 72%
7 Speech Language Pathologist
% of Days 89%
7 Physical Therapy Aide
% of Days 79%
1 Administrator
% of Days 72%
1 Nurse Practitioner
% of Days 71%
1 Occupational Therapy Aide
% of Days 70%
1 Other Social Services Staff
% of Days 63%
3 Physical Therapy Assistant
% of Days 86%
2 Qualified Social Worker
% of Days 71%
1 Medical Director
% of Days 13%
1 Occupational Therapy Assistant
% of Days 17%

Penalties and fines

Federal penalties imposed by CMS for regulatory violations, including civil money penalties (fines) and denials of payment for new Medicare/Medicaid admissions.

Source: CMS Penalties Database

No penalties in the past 3 years

No civil money penalties or payment denials were reported in the last 3 years.

Quality of care over time

These measures show how residents usually do over time at this home, based on health outcomes and preventive care.

High-risk clinical events score Info A composite score based on pressure ulcers, falls with injury, weight loss, walking ability decline, and activities of daily living decline. 10.2
In line with Illinois average

Illinois average: 9.7

Functional decline score Info A composite score based on activities of daily living decline, walking ability decline, and incontinence. 15.3
18% better than Illinois average

Illinois average: 18.6

Long-stay resident measures
Significantly above average Illinois avg: 3.6 Info CMS star rating based on long-stay quality measure performance. 5 stars = significantly above average, 1 star = significantly below average.
Need for Help with Daily Activities Increased Info Percent of long-stay residents whose need for help with daily activities has increased 11.7%
24% better than Illinois average

Illinois average: 15.5%

Walking Ability Worsened Info Percent of long-stay residents whose ability to move independently worsened 17.1%
7% better than Illinois average

Illinois average: 18.4%

Low Risk Residents with Bowel/Bladder Incontinence Info Percent of low risk long-stay residents who lose control of their bowels or bladder 17.1%
21% better than Illinois average

Illinois average: 21.6%

Falls with Major Injury Info Percent of long-stay residents experiencing one or more falls with major injury 3.3%
In line with Illinois average

Illinois average: 3.4%

High Risk Residents with Pressure Ulcers Info Percent of long-stay high risk residents with pressure ulcers 9.9%
88% worse than Illinois average

Illinois average: 5.3%

Urinary Tract Infection Info Percent of long-stay residents with a urinary tract infection 2.0%
11% worse than Illinois average

Illinois average: 1.8%

Lost Too Much Weight Info Percent of long-stay residents who lose too much weight 8.9%
35% worse than Illinois average

Illinois average: 6.5%

Depressive Symptoms Info Percent of long-stay residents who have depressive symptoms 4.2%
91% better than Illinois average

Illinois average: 48.1%

Antipsychotic Use Info Percent of long-stay residents who received an antipsychotic medication 13.8%
32% better than Illinois average

Illinois average: 20.2%

Pneumococcal Vaccine Info Percent of long-stay residents assessed and appropriately given the pneumococcal vaccine 98.0%
10% better than Illinois average

Illinois average: 89.2%

Influenza Vaccine Info Percent of long-stay residents assessed and appropriately given the seasonal influenza vaccine 100.0%
9% better than Illinois average

Illinois average: 91.6%

Hospitalizations per 1,000 days Info Number of hospitalizations per 1,000 long-stay resident days. 2.06
In line with Illinois average

Illinois average: 2.05

ED visits per 1,000 days Info Number of outpatient emergency department visits per 1,000 long-stay resident days. 0.42
81% better than Illinois average

Illinois average: 2.25

Short-stay resident measures
Average Illinois avg: 2.3 Info CMS star rating based on short-stay quality measure performance. 5 stars = much above average, 1 star = much below average.
Pneumococcal Vaccine Info Percent of short-stay residents assessed and appropriately given the pneumococcal vaccine 92.1%
35% better than Illinois average

Illinois average: 68.3%

Antipsychotic medication increase Info Percent of short-stay residents who newly received an antipsychotic medication 1.9%
21% better than Illinois average

Illinois average: 2.3%

Influenza Vaccine Info Percent of short-stay residents assessed and appropriately given the seasonal influenza vaccine 91.0%
44% better than Illinois average

Illinois average: 63.0%

Re-hospitalized after SNF stay Info Percentage of short-stay residents who were re-hospitalized after their nursing home admission. 23.4%
11% better than Illinois average

Illinois average: 26.2%

Emergency department visits Info Percentage of short-stay residents who had an outpatient emergency department visit. 7.8%
44% better than Illinois average

Illinois average: 14.0%

Falls with major injury Info Percentage of SNF residents who experience falls with major injury during their stay. 0.3%
57% better than Illinois average

Illinois average: 0.8%

Ability to care for self at discharge Info Percentage of residents at or above expected ability to care for themselves at discharge. 53.0%
In line with Illinois average

Illinois average: 53.7%

Successful return to home or community Info Rate of successful return to home or community from a skilled nursing facility. 60.4%
19% better than Illinois average

Illinois average: 50.6%

Breakdown by payment type

Medicare

43% of new residents, usually for short-term rehab.

Typical stay 27 days

Private pay

57% of new residents, often for short stays.

Typical stay 5 - 6 months

Facility Characteristics

Source: CMS Long-Term Care Facility Characteristics (Data as of Jan 2026)

Total residents 56
Medicare
22
39.3% of residents
Private pay or other
34
60.7% of residents
Programs & Services
Residents Group

Residents meet regularly to discuss policies, care quality, and activities

CCRC

Part of a Continuing Care Retirement Community offering multiple care levels

Active Resident Council

Organized group of residents that meets regularly to discuss facility policies, quality of life, and activities.

Finances and operations

Based on CMS SNF Cost Report for fiscal year ending in 03/2024.
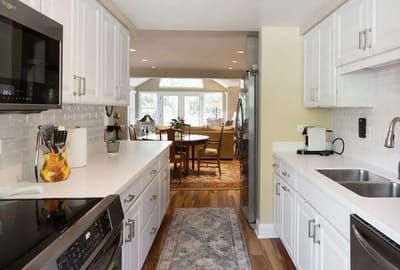
Governmental community
Operated by a subsidized facility district.
Net patient revenue Info Net patient revenue — what the home actually collects for resident care, after contractual allowances, bad debt and discounts are subtracted from its gross charges (CMS cost report, Worksheet G-3). It covers resident care only; money the home earns from other sources is shown separately as "Other income."
$26.3M
Net patient income Info Net patient income: net patient revenue minus the home's total operating expenses. A positive figure means it earns more from resident care than it spends to deliver it; a negative figure means the opposite. It excludes non-operating "other income."
-$3.7K
Governmental community Operated by a subsidized facility district.
Net patient revenue Info Net patient revenue — what the home actually collects for resident care, after contractual allowances, bad debt and discounts are subtracted from its gross charges (CMS cost report, Worksheet G-3). It covers resident care only; money the home earns from other sources is shown separately as "Other income."
$26.3M Rank #2 / 171Revenue — State benchmarkedThis home is ranked 2nd out of 171 homes in Illinois. Shows this facility's annual revenue compared to the Illinois average. Higher revenue generally means more resources for staffing and capital — read alongside Payroll %.Rankings are based only on facilities in Illinois that report data for that category. Facilities without available data are excluded from the ranking.Click the rank badge to see the full State ranking.Click here to see the full State ranking.
Net patient income Info Net patient income: net patient revenue minus the home's total operating expenses. A positive figure means it earns more from resident care than it spends to deliver it; a negative figure means the opposite. It excludes non-operating "other income."
-$3.7K
Other income Info Money the home earns outside of resident care — such as investments, grants, rentals and other non-operating sources (CMS cost report, Worksheet G-3). It is tracked separately from net patient revenue: it is not part of that figure, and it is not included in net patient income.
$34.2M
Payroll costs Info Staff salaries plus wage-related costs — benefits such as payroll taxes, health insurance and retirement — from the home's own accounting records (CMS cost report, Worksheet A). Contract or agency labor is counted separately, under other operating costs. Rank #8 / 171Payroll — State benchmarkedThis home is ranked 8th out of 171 homes in Illinois. Shows total annual staff payroll benchmarked to the Illinois average. Higher payroll investment relative to peers often signals better staffing and less reliance on cheaper contract labor.Rankings are based only on facilities in Illinois that report data for that category. Facilities without available data are excluded from the ranking.Click the rank badge to see the full State ranking.Click here to see the full State ranking.
$15.3M 58.2% of net patient revenue Info Payroll as a share of revenue: staff salaries and wage-related benefits divided by net patient revenue. A higher figure means more of each revenue dollar goes to staff pay. Rank #167 / 171Payroll % — State benchmarkedThis home is ranked 167th out of 171 homes in Illinois. Shows payroll as a percentage of revenue versus the Illinois average. Well-run Illinois facilities typically land around 54–67% — the top third Statewide. Below 25% may signal understaffing or heavy agency use — read with Staffing ratings.Rankings are based only on facilities in Illinois that report data for that category. Facilities without available data are excluded from the ranking.Click the rank badge to see the full State ranking.Click here to see the full State ranking.
Other operating costs Info Everything it costs to run the home apart from payroll — food, utilities, supplies, maintenance, contract labor and administration. Calculated as total operating expense minus payroll (staff salaries and wage-related benefits).
$11.0M
Total costs Info The home's total operating expense for the year — all the costs of running it, salaries included (CMS cost report, Worksheet G-3).
$26.3M

What does this home offer?

Pets allowed icon
Pets allowed icon

Pets Allowed

Housing options icon

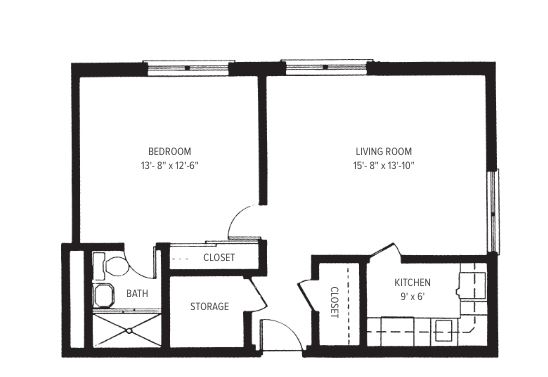
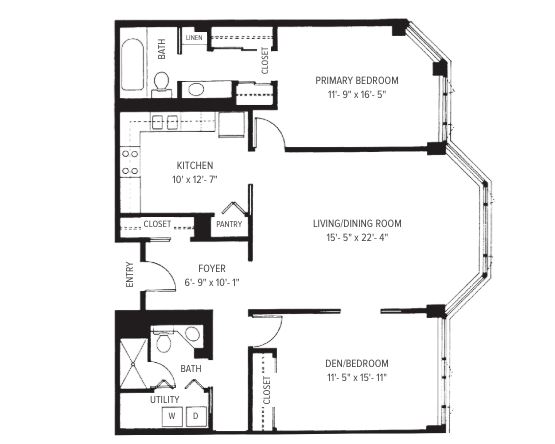
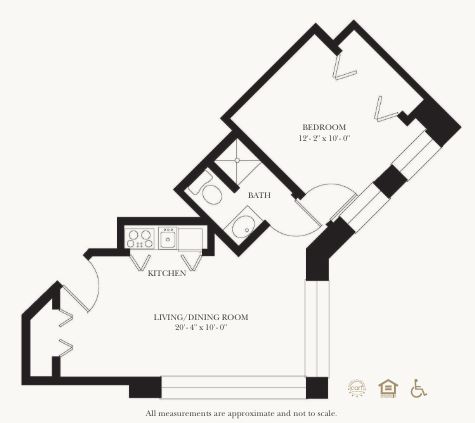
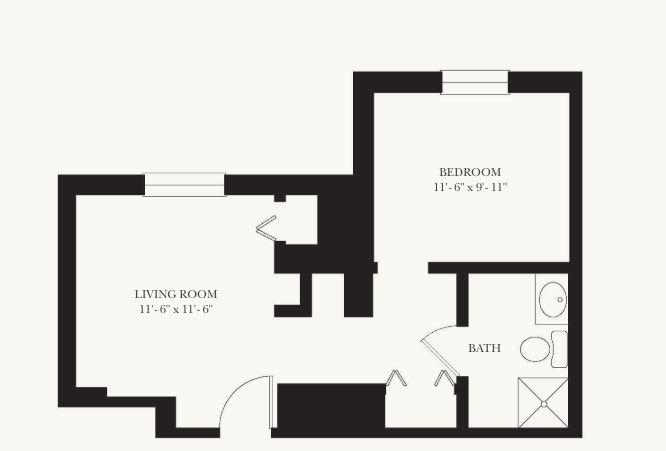
Housing Options: Studio / 1 Bed / 2 Bed

Building type icon
Building type icon

Building Type: Mid-rise

Transportation services icon

Transportation Services

Fitness and recreation icon

Fitness and Recreation

Who this home usually serves

TYPE OF STAY

Mix of rehab and long-term care

This home supports both short-term rehab and long-term care, with residents staying for a wide range of durations.

Most new residents arrive under private pay (57% of admissions), and a typical private pay stay runs around 5 - 6 months.

Admissions
453 total

Coverage residents most often arrive under.

Medicare 43%
Private pay 57%
Discharges
462 total

Coverage residents most often leave under.

Medicare 40%
Private pay 59%
Medicaid 1%

Living Spaces & Floor Plans for Westminster Place

Westminster Place P3
Westminster Place P4
Westminster Place P1
Westminster Place P2

Places of interest near Westminster Place

Address 2.8 miles from city center Info Estimated distance in miles from Evanston's city center to Westminster Place's address, calculated via Google Maps. — 6.72 miles to nearest hospital (Resurrection Medical Center - Emergency Fast Track)

Calculate Travel Distance to Westminster Place

Add your location

Address

Compare Nursing Homes around Evanston

The information below is reported by the Illinois Department of Public Health, Office of Health Care Regulation.

5 facilities compared · CMS & IL Dept. of Health data

Westminster Place
NH
AL
IL
MC
RC
Evanston (Grant Street)
105
Facility 105
IL AVG 86
Rank #116 / 426
64.8%
Facility 64.8%
IL AVG 69.3%
Rank #140 / 204
-6%
5.50
Facility 5.50
IL AVG 3.10
Rank #9 / 172
+47%+77%
$0
Facility $0
IL AVG $151.3k
Rank #1 / 173
7
Facility 7
IL AVG 36.8
Rank #5 / 172
2.3
Facility 2.3
IL AVG 3.7
Rank #15 / 172
-60-
44
Facility 44
IL AVG 51
Rank #392 / 648
Presbyterian Homes
$26.3M
Facility $26.3M
IL AVG $12.2M
Rank #2 / 171
$15.3M
Facility $15.3M
IL AVG $4.8M
Rank #8 / 171
58.2%
Facility 58.2%
IL AVG 44.3%
Rank #167 / 171
145026
The Mather
NH
AL
IL
MC
Evanston (Davis Street)
22
Facility 22
IL AVG 86
Rank #401 / 426
76.3%
Facility 76.3%
IL AVG 69.3%
Rank #95 / 204
+10%
5.88
Facility 5.88
IL AVG 3.10
Rank #5 / 172
+102%+90%
$0
Facility $0
IL AVG $151.3k
Rank #1 / 173
7
Facility 7
IL AVG 36.8
Rank #5 / 172
3.5
Facility 3.5
IL AVG 3.7
Rank #82 / 172
-30-
95
Facility 95
IL AVG 51
Rank #18 / 648
Mather Senior Living Communities LLC
$24.7M
Facility $24.7M
IL AVG $12.2M
Rank #41 / 171
$10.8M
Facility $10.8M
IL AVG $4.8M
Rank #29 / 171
43.6%
Facility 43.6%
IL AVG 44.3%
Rank #90 / 171
146145
Dobson Plaza Rehabilitation and Healthcare
NH
NC
PC
RC
Evanston (Dodge Avenue)
97
Facility 97
IL AVG 86
Rank #132 / 426
--
2.39
Facility 2.39
IL AVG 3.10
Rank #137 / 172
+45%-23%
$0
Facility $0
IL AVG $151.3k
Rank #1 / 173
16
Facility 16
IL AVG 36.8
Rank #24 / 172
5.3
Facility 5.3
IL AVG 3.7
Rank #154 / 172
184A+
74
Facility 74
IL AVG 51
Rank #135 / 648
Charlotte Kohn
-
Facility -
IL AVG $12.2M
Rank #171 / 171
$4.5M
Facility $4.5M
IL AVG $4.8M
Rank #147 / 171
-
Facility -
IL AVG 44.3%
Rank #1 / 171
145122
Aperion Care Evanston
NH
AL
Evanston
57
Facility 57
IL AVG 86
Rank #275 / 426
82.5%
Facility 82.5%
IL AVG 69.3%
Rank #73 / 204
+19%
2.09
Facility 2.09
IL AVG 3.10
Rank #157 / 172
+11%-33%
$52.2k
Facility $52.2k
IL AVG $151.3k
Rank #108 / 173
28
Facility 28
IL AVG 36.8
Rank #69 / 172
2.3
Facility 2.3
IL AVG 3.7
Rank #15 / 172
253A+
88
Facility 88
IL AVG 51
Rank #50 / 648
-
$5.8M
Facility $5.8M
IL AVG $12.2M
Rank #155 / 171
$3.2M
Facility $3.2M
IL AVG $4.8M
Rank #160 / 171
54.5%
Facility 54.5%
IL AVG 44.3%
Rank #68 / 171
146058
Three Crowns Park
NH
AL
MC
RC
Evanston (Mcdaniel Avenue)
18
Facility 18
IL AVG 86
Rank #405 / 426
--
7.33
Facility 7.33
IL AVG 3.10
Rank #2 / 172
+68%+137%
$0
Facility $0
IL AVG $151.3k
Rank #1 / 173
2
Facility 2
IL AVG 36.8
Rank #1 / 172
1.0
Facility 1.0
IL AVG 3.7
Rank #1 / 172
125-
68
Facility 68
IL AVG 51
Rank #163 / 648
Three Crowns Park---146199

Financial Assistance for
Nursing Home in Illinois

Westminster Place is located in Evanston, Illinois.
Here are the financial assistance programs available to residents in Illinois.

Get Financial aid guidance

Community Care Program

Illinois CCP

Age 60+
General Illinois resident, at risk of nursing home placement.
Income Limits (2025) ~$1,215/month individual
Asset Limits $17,500 individual, excludes home, car
IL

High demand in urban areas; waitlists possible.

Benefits
In-home care (3-5 hours/day) Adult day services ($65/day) Emergency home response systems ($30/month)

Illinois Respite Program

IL Respite (via NFCSP)

Age Caregiver of someone 60+ (or with dementia)
General Illinois resident.
Income Limits No strict limit; prioritizes low-income.
Asset Limits Not applicable.
IL

Limited slots; urban/rural balance.

Benefits
In-home respite (4-6 hours/day) Adult day care (~$65/day) Short-term facility care (up to 5 days)

Supportive Living Program (SLP)

Illinois Medicaid Supportive Living Program

Age 65+ or 22-64 with disability
General Illinois resident, Medicaid-eligible, needs moderate assistance (not nursing home-level).
Income Limits (2025) ~$2,829/month (300% FBR, individual); QIT allowed.
Asset Limits $2,000 (individual), $3,000 (couple) (excludes home, car).
IL

~200 SLP sites statewide; room/board not covered.

Benefits
Personal care (5-7 hours/day, e.g., bathing, mobility) Meals Housekeeping Medication management Respite (~240 hours/year)

Persons Who Are Elderly Waiver

Illinois Medicaid Elderly Waiver

Age 65+
General Illinois resident, Medicaid-eligible, nursing home-level care need.
Income Limits (2025) ~$2,829/month 300% FBR, individual
Asset Limits $2,000 (individual), $3,000 (couple).
IL

Part of HealthChoice Illinois; consumer-directed options available.

Benefits
Personal care (5-7 hours/day, e.g., dressing, eating) Homemaker Adult day care (~$60/day) Respite (240 hours/year) Home mods ($1,000 avg.)

Medicare Savings Program (MSP)

Illinois Medicare Savings Program

Age 65+ or disabled
General Illinois resident, Medicare Part A/B.
Income Limits (2025) ~$2,510/month (QMB), ~$3,380/month (SLMB), ~$3,598/month (QI)—individual.
Asset Limits $9,430 (individual), $14,130 (couple).
IL

Three tiers; no waitlist.

Benefits
Covers Part B premiums ($174.70/month) Deductibles ($240/year) Copays (~20%)

Optional State Supplementation (OSS)

Illinois Optional State Supplementation

Age 65+ or disabled
General Illinois resident, in approved facility, SSI recipient or low-income.
Income Limits (2025) ~$1,004/month including SSI
Asset Limits $2,000 (individual), $3,000 (couple).
IL

~$50-$500/month based on facility type.

Benefits
Cash (~$50-$500/month) for room/board in personal care homes or SLFs

VA Aid and Attendance (A&A) and Housebound Benefits

Illinois VA Aid and Attendance/Housebound

Age 65+ or disabled veteran/spouse
General Illinois resident, wartime service, need for ADL help (A&A) or homebound.
Income Limits (2025) Net income < ~$1,984/month (veteran with dependent, A&A); pension offsets income.
Asset Limits ~$155,356 net worth limit
IL

High veteran demand in urban/rural areas.

Benefits
Cash (~$1,433-$2,642/month veteran, ~$951-$1,318 spouse) for care costs (e.g., in-home, assisted living)

Frequently Asked Questions about Westminster Place

What neighborhood is Westminster Place in?

Westminster Place is in the Grant Street neighborhood.

Is Westminster Place in a walkable area?

Westminster Place has a walk score of 44. Somewhat walkable. A few nearby services may be reachable on foot, but most trips require transportation.

What is the occupancy rate at Westminster Place?

Westminster Place's occupancy is 64.8%.

Are there photos of Westminster Place?

Yes — there are 5 photos of Westminster Place in the photo gallery on this page.

What is the address of Westminster Place?

Westminster Place is located at 3200 Grant St, Evanston, IL 60201.

What is the phone number of Westminster Place?

(847) 570-3422 will put you in contact with the team at Westminster Place.

Is Westminster Place Medicare or Medicaid certified?

Yes — Westminster Place is a CMS-certified provider of Medicare and Medicaid.

Guides for Better Senior Living

Care Cost Calculator: See Prices in Your Area

Nursing Home Data Explorer

Don’t Wait Too Long: 7 Red Flag Signs Your Parent Needs Assisted Living Now

The True Cost of Assisted Living in 2025 – And How Families Are Paying For It

Understanding Senior Living Costs: Pricing Models, Discounts & Financial Assistance