Westminster Village Al
Nursing Home · Bloomington, IL
CMS overall rating Info The Overall CMS Rating is scored from 1 to 5 stars and combines results from health inspections, staffing levels, and quality measures. Health inspections carry the most weight. Staffing and quality scores can increase or decrease the final rating based on performance compared to state and national standards.

Westminster Village Al

Nursing Home · Bloomington, IL
CMS overall rating Info The Overall CMS Rating is scored from 1 to 5 stars and combines results from health inspections, staffing levels, and quality measures. Health inspections carry the most weight. Staffing and quality scores can increase or decrease the final rating based on performance compared to state and national standards.
Calculator: See prices in your area
Westminster Village Al accepts Medicare and private pay.

Overview of Westminster Village Al

Westminster Village is a senior living community located in Bloomington, Illinois. It offers a variety of living options including independent living, assisted living, memory care, and skilled nursing care. The community focuses on providing a continuum of care and services to support active aging.
(309) 663-6474

Quality ratings

Measured by Centers for Medicare & Medicaid Services (CMS)

Overall rating Info The Overall CMS Rating combines results from health inspections, staffing levels and quality measures. Health inspections carry the most weight. Staffing and quality scores can increase or decrease the final rating based on performance compared to state and national standards.
▲ 27.0% Above IL avg. ▲ 27.0% Above IL avg.Click the badge to see the full State ranking.Click here to see the full State ranking.
Health Inspection Info Based on the results of the facility's three most recent standard inspections and any complaint investigations. CMS reviews the number, scope, and severity of deficiencies, with more recent findings weighted more heavily.
At IL avg. At IL avg.Click the badge to see the full State ranking.Click here to see the full State ranking.
Staffing Info Measures average nursing staff hours per resident per day, including Registered Nurses (RNs) and total nursing staff. Ratings are adjusted based on the level of care residents require and are compared to state and national benchmarks.
▲ 50.2% Above IL avg. ▲ 50.2% Above IL avg.Click the badge to see the full State ranking.Click here to see the full State ranking.
Quality Measures Info Based on clinical and physical health indicators reported to CMS, such as hospital readmissions, falls, pressure ulcers, and improvements in mobility. These measures reflect how well residents' health needs are being managed.
▲ 25.4% Above IL avg. ▲ 25.4% Above IL avg.Click the badge to see the full State ranking.Click here to see the full State ranking.

Staffing hours breakdown

Info Daily nursing hours per resident by staff type, reported to CMS. Higher is generally better — compare this facility to state and national averages to see where staffing stands.

Hours per resident per day — compared to Illinois state averages

Total nursing care / resident Info This home is ranked 20th out of 167 homes in Illinois. Total adjusted nursing hours per resident per day, combining RN, LPN, and aide time. CMS adjusts this for case-mix so facilities can be fairly compared.
4h 51m per day
Rank #20 / 167Nurse hours — State benchmarkedThis home is ranked 20th out of 167 homes in Illinois. Shows adjusted nurse hours per resident per day benchmarked to the Illinois average, with a ranking across 167 Illinois SNFs. More hours mean more direct care. The national average is about 3.5 hrs; below 3.0 is a red flag.Click the rank badge to see the full State ranking.Click here to see the full State ranking.
This facility Illinois avg (3h 57m per day)
vs Illinois avg
+23%

1 of 6 metrics below state avg

Standout metric Registered Nurse (RN) is +84% above state avg
Staff typeHours / Day / Residentvs state avg
Registered Nurse (RN) Info RNs hold the highest nursing license and can assess residents, interpret test results, and direct care plans. More RN hours per day often signals stronger clinical oversight and faster response to health changes. 1h 21m per day ▲ 84% State avg: 44m per day · National avg: 41m per day
LPN / LVN Info Licensed Practical Nurses (LPNs) or Licensed Vocational Nurses (LVNs) deliver routine hands-on care — medication administration, wound dressing, and monitoring vital signs. They work under RN supervision and make up a large share of daily bedside care. 13m per day ▼ 66% State avg: 38m per day · National avg: 52m per day
Nurse Aide Info Certified Nurse Aides (CNAs) provide the most direct day-to-day assistance: bathing, dressing, feeding, and mobility. Nurse aide hours are typically the largest staffing category and directly affect residents' quality of life. 2h 43m per day ▲ 27% State avg: 2h 8m per day · National avg: 2h 20m per day
Weekend Total Nursing Info Combined nursing hours (RN + LPN + Nurse Aide) per resident per day on weekends. Staffing often drops on weekends — this figure reveals whether the facility maintains adequate coverage outside of weekday hours. 4h 1m per day ▲ 30% State avg: 3h 5m per day · National avg: 3h 26m per day
Physical Therapist Info Hours per resident per day provided by licensed Physical Therapists (PTs) or PT Assistants. PT services help residents recover mobility after injury or illness and are especially important for post-acute (short-stay) rehabilitation. 4m per day ▲ 33% State avg: 3m per day · National avg: 4m per day
Weekend RN Info Registered nurse hours specifically on weekends. Facilities sometimes reduce RN presence on Saturdays and Sundays — a low weekend RN figure compared to weekday hours can indicate reduced clinical oversight when most administrative staff are absent. 59m per day ▲ 74% State avg: 34m per day · National avg: 28m per day

Capacity and availability

This home is often near full

Occupancy higher than 95% suggests steady demand, but availability may be limited.

Higher occupancy than the Illinois average: 69.3%
Occupancy rate 96% Rank #12 / 199Occupancy rate — State benchmarkedThis home is ranked 12th out of 199 homes in Illinois. Shows this facility's occupancy rate versus the Illinois average, with its Statewide rank out of 199. Higher occupancy signals strong local demand and financial stability.Click the rank badge to see the full State ranking.Click here to see the full State ranking.
Avg. Length of Stay 170 days
Occupancy rate
96% Rank #12 / 199Occupancy rate — State benchmarkedThis home is ranked 12th out of 199 homes in Illinois. Shows this facility's occupancy rate versus the Illinois average, with its Statewide rank out of 199. Higher occupancy signals strong local demand and financial stability.Click the rank badge to see the full State ranking.Click here to see the full State ranking.
Avg. Length of Stay
170 days
Bed community size
72-bed community Rank #216 / 430Bed count — State benchmarkedThis home is ranked 216th out of 430 homes in Illinois. Shows this facility's certified or reported bed count compared to other Illinois SNFs. Larger communities may offer more amenities, programs, and on-site services for residents and families.Click the rank badge to see the full State ranking.Click here to see the full State ranking.
A moderately sized community that may balance personal attention with shared amenities and social activities.
Years in operation
1 year in operation Rank #128 / 251Years in operation — State benchmarkedThis home is ranked 128th out of 251 homes in Illinois. Shows how long this facility has been in operation compared to other Illinois SNFs. Longer operating histories may benefit residents, families, and staff.Click the rank badge to see the full State ranking.Click here to see the full State ranking.
A newer community that may feature more recent facilities and programs.
Walk Score
Walk Score: 84 / 100 Rank #80 / 647Walk Score — State benchmarkedThis home is ranked 80th out of 647 homes in Illinois. Shows how walkable this facility's neighborhood is compared to the average Walk Score across Illinois SNFs. Higher scores benefit residents, families, and staff.Click the rank badge to see the full State ranking.Click here to see the full State ranking.
Very walkable. Most errands can be accomplished on foot, and many essentials are within a short walk.
BBB Rating
BBB Rating: A (Not Accredited)
An independent rating from the Better Business Bureau based on factors such as complaint history, transparency, and business practices.
How BBB ratings work

About this community

License Details

Facility TypeAssisted Living/shared Housing Establishment
StatusActive
IssuanceJanuary 29, 2025
CountyMclean
CMS Certification Number145400

Ownership & Operating Entity

Owner NameWestminster Village, Inc.

Therapy & Rehabilitation

1 service
Rehabilitation Services

Contact Information

Amenities & Lifestyle

Specific ProgramsIndependent Living Apartments, The Willows Duplexes, Assisted Living & Memory Care, Health Center, Wellness Services

Dining & Nutrition

Food DescriptionWestminster Village offers expansive dining options.

Contact Westminster Village Al

Inspection History

In Illinois, the Department of Public Health, Office of Health Care Regulation conducts annual unannounced surveys to assess compliance with state and federal healthcare facility standards.

Since 2022 · 4 years of data 7 deficiencies

Inspection Scorecard Info This scorecard compares key inspection, citation, and complaint metrics at this facility against the Illinois state average. Metrics rated ≥15% worse than average are highlighted in red; those ≥15% better are highlighted in green.

Since 2022 vs. Illinois state average
Overall vs. IL average 0 Worse No metrics in this bucket. 2 At Avg Metrics at Illinois average:
• Total deficiencies (at IL avg)
• Deficiencies per year (at IL avg)
0 Better No metrics in this bucket.
Latest Inspection December 2, 2025 Original Licensing

Deficiencies Info Deficiencies are formal regulatory issues recorded during state inspections.

This FacilityIL Averagevs. IL Avg
Total deficiencies Info Formal regulatory issues recorded by inspectors across all inspection types. 77 This facility has total deficiencies in line with the Illinois average (7 vs. IL avg 7).— At avg
Deficiencies per year Info Average deficiencies per year since 2022. 1.81.8 This facility has deficiencies per year in line with the Illinois average (1.8 vs. IL avg 1.8).— At avg

Inspection Reports Summary Info An editor-reviewed summary of the themes and findings across this facility's recent inspection reports.

The most recent inspection on December 2, 2025, found the facility in compliance with applicable assisted living regulations and no deficiencies were cited. Earlier inspections showed a pattern of some deficiencies related mainly to updating resident service plans and timely reporting of incidents, including failure to address specific resident behaviors and delayed notification of an allegation of misappropriation of resident property. Complaint investigations substantiated issues with service plan interventions for resident behaviors and reporting delays, but no fines, immediate jeopardy findings, or license actions were listed in the available reports. Most complaints were substantiated, with the facility responding through revised service plans and staff education. The inspection history shows improvement over time, culminating in a clean most recent inspection.

Read the full inspection reports for this facility, including detailed findings and corrective actions.

Show Inspection Reports

Health Inspection History

Inspections since 2022
Total health inspections 5

Illinois average 10.4


Last Health inspection on Apr 2024

Total health citations
26 Rank #62 / 167Health citations — State benchmarkedThis home is ranked 62nd out of 167 homes in Illinois. Shows this facility's total health deficiency citations benchmarked to the Illinois State average, with a ranking across all 167 IL SNFs. Lower citation counts earn a better rank.Click the rank badge to see the full State ranking.Click here to see the full State ranking.

Illinois average 36.8

Citations per inspection
5.2 Rank #146 / 167Citations per inspection — State benchmarkedThis home is ranked 146th out of 167 homes in Illinois. Shows average deficiency citations per CMS inspection for this facility versus the Illinois mean across 167 SNFs with citation data. Lower is better.Click the rank badge to see the full State ranking.Click here to see the full State ranking.

Illinois average 3.68


Health citations are formal notices following inspections when they fail to comply with safety and care standards.

23 of 26 citations resulted from standard inspections; and 3 of 26 resulted from complaint investigations.

Breakdown of citation severity (last 4 years)
Critical Health citations
0
100% better than Illinois average

Illinois average: 0.7


Serious Health citations
2 Rank #33 / 135Serious citations (G–I) — State benchmarkedThis home is ranked 33rd out of 135 homes in Illinois. Shows G–I scope serious health citations for this facility versus other Illinois SNFs. Lower counts rank better.Click the rank badge to see the full State ranking.Click here to see the full State ranking.
44% better than Illinois average

Illinois average: 3.6

0 critical citations Illinois average: 0.7

2 serious citations Illinois average: 3.6

23 moderate citations Illinois average: 32

1 minor citation Illinois average: 0.5
Citations history (last 4 years)
Abuse/Neglect moderate citation Apr 10, 2024
Corrected

Infection Control moderate citation Apr 10, 2024
Corrected

Infection Control moderate citation Apr 10, 2024
Corrected

Infection Control moderate citation Apr 10, 2024
Corrected

Staffing Data

Reporting period: October 1 – December 31, 2025 (Q4 2025). Source: CMS Payroll-Based Journal report.

Total staff 135
Employees 123
Contractors 12
Staff to resident ratio 1.50:1
17% worse than Illinois average
Illinois average ratio: 1.80:1 Illinois average ratio: 1.80:1See full Illinois ranking
Avg staff/day 32
Average shift 6.9 hours
9% worse than Illinois average
Illinois average: 7.6 hours Illinois average shift: 7.6 hoursSee full Illinois ranking
Total staff hours (quarter) 20,225

Nursing staff breakdown

Q4 2025 · Oct 1 – Dec 31 More info This data comes from the CMS Payroll-Based Journal report covering October 1 – December 31, 2025.
Registered Nurse

Manages medical care and health needs.

RN Staff 22
Average shift length Info Average shift length. Calculated as total hours divided by days worked and average staff per day. 6.9 hours

No contractors work on this role.

Licensed Practical Nurse

Assists with medical care and medications.

LPN Staff 13
Average shift length Info Average shift length. Calculated as total hours divided by days worked and average staff per day. 6.6 hours

No contractors work on this role.

Certified Nursing Assistant

Helps with daily care and mobility.

CNA Staff 79
Average shift length Info Average shift length. Calculated as total hours divided by days worked and average staff per day. 7 hours

No contractors work on this role.

Contractor staffing

Q4 2025 · Oct 1 – Dec 31 More info This data comes from the CMS Payroll-Based Journal report covering October 1 – December 31, 2025.

Total hours from contractors

10.1%

2,039 contractor hours this quarter

Speech Language Pathologist: 3 Physical Therapy Aide: 2 Respiratory Therapy Technician: 2 Physical Therapy Assistant: 2 Qualified Social Worker: 1 Medical Director: 1 Occupational Therapy Assistant: 1

Staff by category

Q4 2025 · Oct 1 – Dec 31 More info This data comes from the CMS Payroll-Based Journal report covering October 1 – December 31, 2025.
Certified Nursing Assistant7907910,39092100%7
Registered Nurse220223,35592100%6.9
Licensed Practical Nurse130131,0668390%6.6
Clinical Nurse Specialist2029476368%8
Speech Language Pathologist0338536773%7.6
Other Dietary Services Staff2028529098%7.4
Mental Health Service Worker1015526672%8.4
Dental Services Staff2025405762%9.3
Physical Therapy Aide0224106672%6.2
Administrator1013924953%8
Physical Therapy Assistant0223856571%5.9
Respiratory Therapy Technician0222496368%3.3
Qualified Social Worker0111223639%3.4
Occupational Therapy Aide101934751%2
Occupational Therapy Assistant0111433%4.5
Medical Director011778%1
79 Certified Nursing Assistant
% of Days 100%
22 Registered Nurse
% of Days 100%
13 Licensed Practical Nurse
% of Days 90%
2 Clinical Nurse Specialist
% of Days 68%
3 Speech Language Pathologist
% of Days 73%
2 Other Dietary Services Staff
% of Days 98%
1 Mental Health Service Worker
% of Days 72%
2 Dental Services Staff
% of Days 62%
2 Physical Therapy Aide
% of Days 72%
1 Administrator
% of Days 53%
2 Physical Therapy Assistant
% of Days 71%
2 Respiratory Therapy Technician
% of Days 68%
1 Qualified Social Worker
% of Days 39%
1 Occupational Therapy Aide
% of Days 51%
1 Occupational Therapy Assistant
% of Days 3%
1 Medical Director
% of Days 8%

Penalties and fines

Includes penalties issued in 2024

Federal penalties imposed by CMS for regulatory violations, including civil money penalties (fines) and denials of payment for new Medicare/Medicaid admissions.

Source: CMS Penalties Database (Data as of Jan 2026)

Total fines amount $12K Rank #72 / 168Federal fines — State benchmarkedThis home is ranked 72nd out of 168 homes in Illinois. Shows this facility's cumulative CMS federal fine dollars versus the Illinois average among facilities with fines, and where it ranks among 168 skilled nursing facilities in the pool. Lower total dollars mean a better rank.Click the rank badge to see the full State ranking.Click here to see the full State ranking.
91% lower than Illinois average

Illinois average: $143K

Number of fines 1
66% fewer fines than Illinois average

Illinois average: 3.0

Payment Denials Info Serious action where Medicare and/or Medicaid temporarily stops payments for new residents until issues are fixed. 1
6% fewer payment denials than Illinois average

Illinois average: 1.1

Fines amount comparison
This facility $12K
Illinois average $143K
Penalty History

Penalties are imposed by CMS for violations of federal nursing home regulations.

2 penalties in the past 3 years

Multiple penalties were reported in the last 3 years.

Civil Money Penalty Info Fines imposed for noncompliance, which can be assessed per day or per instance of violation. Mar 26, 2024
$12K
Payment Denial Info Serious action where Medicare and/or Medicaid temporarily stops payments for new residents until issues are fixed. Mar 26, 2024
5 days

Last updated: Jan 2026

Quality of care over time

These measures show how residents usually do over time at this home, based on health outcomes and preventive care.

High-risk clinical events score Info A composite score based on pressure ulcers, falls with injury, weight loss, walking ability decline, and activities of daily living decline. 10.6
9% worse than Illinois average

Illinois average: 9.7

Functional decline score Info A composite score based on activities of daily living decline, walking ability decline, and incontinence. 21.6
16% worse than Illinois average

Illinois average: 18.6

Long-stay resident measures
Above average Illinois avg: 3.6 Info CMS star rating based on long-stay quality measure performance. 5 stars = significantly above average, 1 star = significantly below average.
Need for Help with Daily Activities Increased Info Percent of long-stay residents whose need for help with daily activities has increased 15.2%
In line with Illinois average

Illinois average: 15.5%

Walking Ability Worsened Info Percent of long-stay residents whose ability to move independently worsened 21.1%
15% worse than Illinois average

Illinois average: 18.4%

Low Risk Residents with Bowel/Bladder Incontinence Info Percent of low risk long-stay residents who lose control of their bowels or bladder 28.4%
31% worse than Illinois average

Illinois average: 21.6%

Falls with Major Injury Info Percent of long-stay residents experiencing one or more falls with major injury 0.8%
76% better than Illinois average

Illinois average: 3.4%

High Risk Residents with Pressure Ulcers Info Percent of long-stay high risk residents with pressure ulcers 10.4%
98% worse than Illinois average

Illinois average: 5.3%

Urinary Tract Infection Info Percent of long-stay residents with a urinary tract infection 3.3%
80% worse than Illinois average

Illinois average: 1.8%

Lost Too Much Weight Info Percent of long-stay residents who lose too much weight 5.4%
18% better than Illinois average

Illinois average: 6.5%

Depressive Symptoms Info Percent of long-stay residents who have depressive symptoms 48.8%
In line with Illinois average

Illinois average: 48.1%

Antipsychotic Use Info Percent of long-stay residents who received an antipsychotic medication 15.2%
25% better than Illinois average

Illinois average: 20.2%

Pneumococcal Vaccine Info Percent of long-stay residents assessed and appropriately given the pneumococcal vaccine 100.0%
12% better than Illinois average

Illinois average: 89.2%

Influenza Vaccine Info Percent of long-stay residents assessed and appropriately given the seasonal influenza vaccine 100.0%
9% better than Illinois average

Illinois average: 91.6%

Hospitalizations per 1,000 days Info Number of hospitalizations per 1,000 long-stay resident days. 0.45
78% better than Illinois average

Illinois average: 2.04

ED visits per 1,000 days Info Number of outpatient emergency department visits per 1,000 long-stay resident days. 0.68
70% better than Illinois average

Illinois average: 2.25

Short-stay resident measures
Average Illinois avg: 2.3 Info CMS star rating based on short-stay quality measure performance. 5 stars = much above average, 1 star = much below average.
Pneumococcal Vaccine Info Percent of short-stay residents assessed and appropriately given the pneumococcal vaccine 100.0%
46% better than Illinois average

Illinois average: 68.3%

Antipsychotic medication increase Info Percent of short-stay residents who newly received an antipsychotic medication 1.2%
47% better than Illinois average

Illinois average: 2.3%

Influenza Vaccine Info Percent of short-stay residents assessed and appropriately given the seasonal influenza vaccine 97.9%
55% better than Illinois average

Illinois average: 63.0%

Re-hospitalized after SNF stay Info Percentage of short-stay residents who were re-hospitalized after their nursing home admission. 24.3%
7% better than Illinois average

Illinois average: 26.2%

Emergency department visits Info Percentage of short-stay residents who had an outpatient emergency department visit. 6.7%
52% better than Illinois average

Illinois average: 14.0%

Falls with major injury Info Percentage of SNF residents who experience falls with major injury during their stay. 0.0%
100% better than Illinois average

Illinois average: 0.8%

Ability to care for self at discharge Info Percentage of residents at or above expected ability to care for themselves at discharge. 40.5%
25% worse than Illinois average

Illinois average: 53.7%

Successful return to home or community Info Rate of successful return to home or community from a skilled nursing facility. 45.7%
10% worse than Illinois average

Illinois average: 50.6%

Breakdown by payment type

Medicare

46% of new residents, usually for short-term rehab.

Typical stay 20 days

Private pay

54% of new residents, often for short stays.

Typical stay 1 - 2 years

Facility Characteristics

Source: CMS Long-Term Care Facility Characteristics (Data as of Jan 2026)

Total residents 90
Medicare
45
50% of residents
Private pay or other
45
50% of residents
Programs & Services
Residents Group

Residents meet regularly to discuss policies, care quality, and activities

Family Member Group

Family members meet regularly to discuss policies, care quality, and activities

CCRC

Part of a Continuing Care Retirement Community offering multiple care levels

Active Family Council

Organized group of family members that meets regularly to discuss facility policies, resident care, and activities.

Active Resident Council

Organized group of residents that meets regularly to discuss facility policies, quality of life, and activities.

Finances and operations

Voluntary non-profit community
Home revenue
$32.0M
Operating deficit
-$351.9K
Voluntary non-profit community
Home revenue
$32.0M Rank #20 / 166Revenue — State benchmarkedThis home is ranked 20th out of 166 homes in Illinois. Shows this facility's annual revenue compared to the Illinois SNF average. Higher revenue generally means more resources for staffing and capital — read alongside Payroll %.Click the rank badge to see the full State ranking.Click here to see the full State ranking.
Operating deficit
-$351.9K
Payroll costs Info The portion of the home's budget spent on staff, including nurses, caregivers, and other employees who support care and operations. Rank #10 / 166Payroll — State benchmarkedThis home is ranked 10th out of 166 homes in Illinois. Shows total annual staff payroll benchmarked to the Illinois average. Higher payroll investment relative to peers often signals better staffing and less reliance on cheaper contract labor.Click the rank badge to see the full State ranking.Click here to see the full State ranking.
$15.1M
47.3% of revenue Rank #84 / 166Payroll % — State benchmarkedThis home is ranked 84th out of 166 homes in Illinois. Shows payroll as a percentage of revenue versus the Illinois average. Well-run Illinois SNFs typically land around 54–67% — the top third Statewide. Below 25% may signal understaffing or heavy agency use — read with Staffing ratings.Click the rank badge to see the full State ranking.Click here to see the full State ranking.
Other operating costs Info All remaining costs needed to run the home, such as food, utilities, building maintenance, supplies and administrative expenses.
$17.1M
Total costs $32.3M

Who this home usually serves

TYPE OF STAY

Mix of rehab and long-term care

This home supports both short-term rehab and long-term care, with residents staying for a wide range of durations.

Places of interest near Westminster Village Al

Address 0.2 miles from city center Info Estimated distance in miles from Bloomington's city center to Westminster Village Al's address, calculated via Google Maps.

Calculate Travel Distance to Westminster Village Al

Add your location

Address

Financial Assistance for
Nursing Home in Illinois

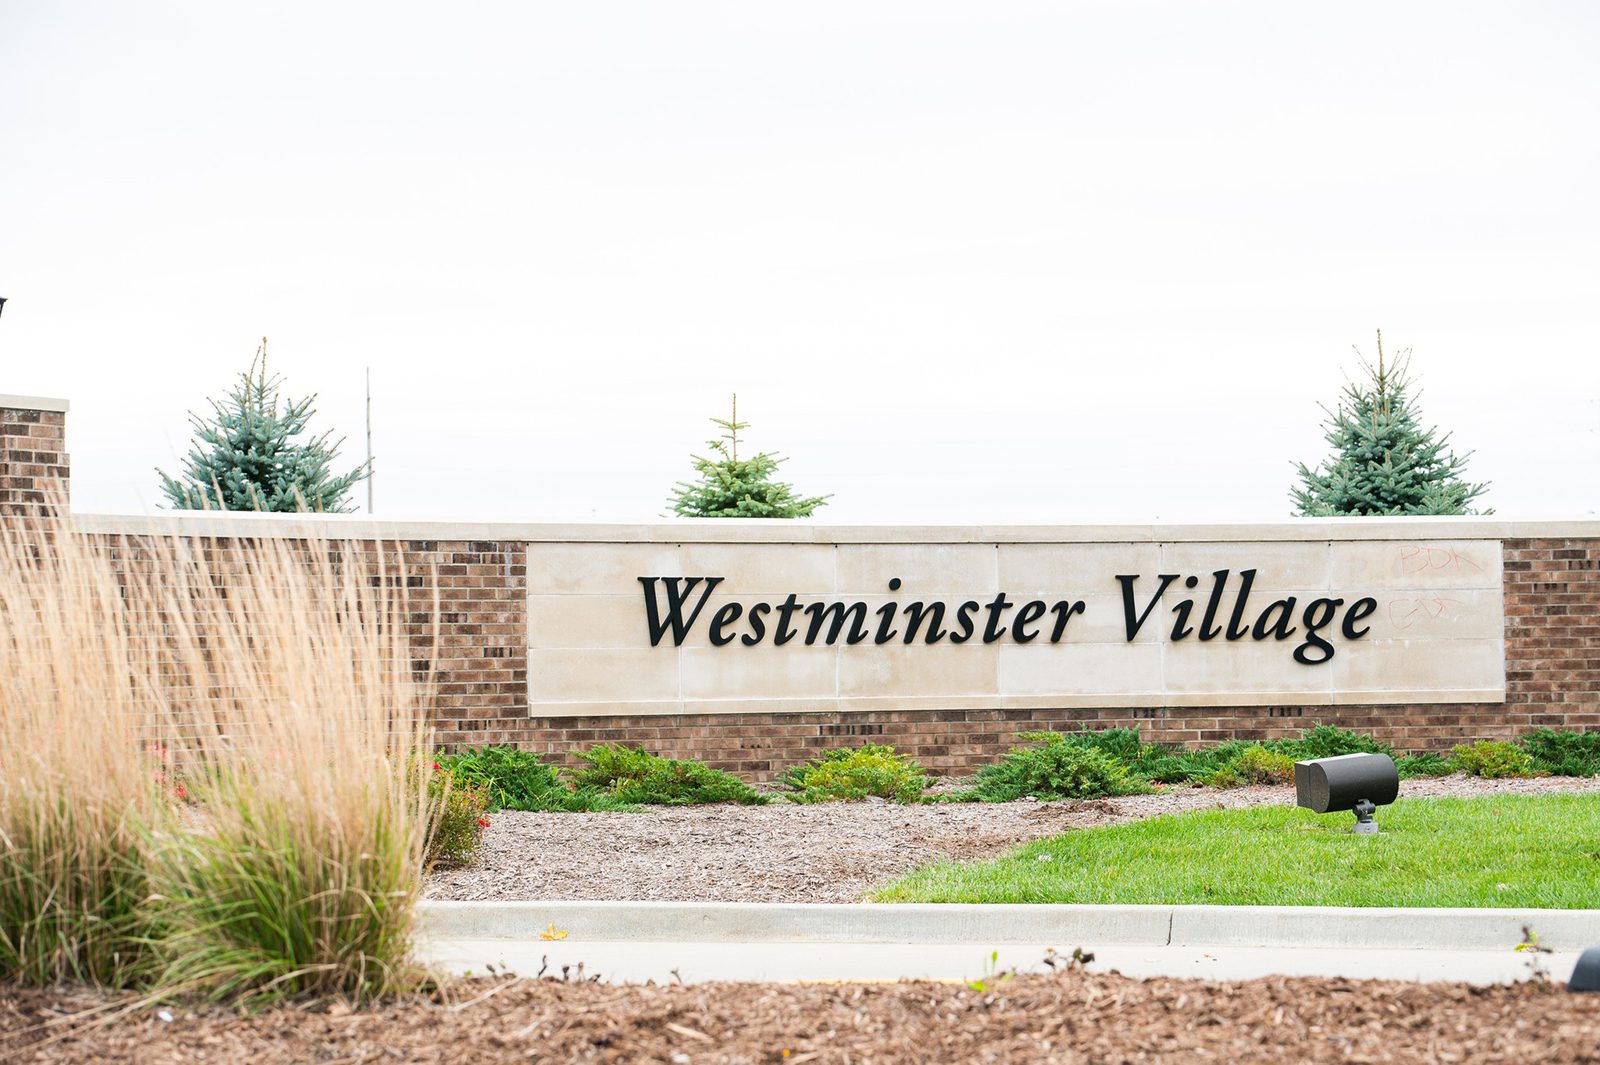
Westminster Village Al is located in Bloomington, Illinois.
Here are the financial assistance programs available to residents in Illinois.

Get Financial aid guidance

Community Care Program

Illinois CCP

Age 60+
General Illinois resident, at risk of nursing home placement.
Income Limits (2025) ~$1,215/month individual
Asset Limits $17,500 individual, excludes home, car
IL

High demand in urban areas; waitlists possible.

Benefits
In-home care (3-5 hours/day) Adult day services ($65/day) Emergency home response systems ($30/month)

Illinois Respite Program

IL Respite (via NFCSP)

Age Caregiver of someone 60+ (or with dementia)
General Illinois resident.
Income Limits No strict limit; prioritizes low-income.
Asset Limits Not applicable.
IL

Limited slots; urban/rural balance.

Benefits
In-home respite (4-6 hours/day) Adult day care (~$65/day) Short-term facility care (up to 5 days)

Supportive Living Program (SLP)

Illinois Medicaid Supportive Living Program

Age 65+ or 22-64 with disability
General Illinois resident, Medicaid-eligible, needs moderate assistance (not nursing home-level).
Income Limits (2025) ~$2,829/month (300% FBR, individual); QIT allowed.
Asset Limits $2,000 (individual), $3,000 (couple) (excludes home, car).
IL

~200 SLP sites statewide; room/board not covered.

Benefits
Personal care (5-7 hours/day, e.g., bathing, mobility) Meals Housekeeping Medication management Respite (~240 hours/year)

Persons Who Are Elderly Waiver

Illinois Medicaid Elderly Waiver

Age 65+
General Illinois resident, Medicaid-eligible, nursing home-level care need.
Income Limits (2025) ~$2,829/month 300% FBR, individual
Asset Limits $2,000 (individual), $3,000 (couple).
IL

Part of HealthChoice Illinois; consumer-directed options available.

Benefits
Personal care (5-7 hours/day, e.g., dressing, eating) Homemaker Adult day care (~$60/day) Respite (240 hours/year) Home mods ($1,000 avg.)

Medicare Savings Program (MSP)

Illinois Medicare Savings Program

Age 65+ or disabled
General Illinois resident, Medicare Part A/B.
Income Limits (2025) ~$2,510/month (QMB), ~$3,380/month (SLMB), ~$3,598/month (QI)—individual.
Asset Limits $9,430 (individual), $14,130 (couple).
IL

Three tiers; no waitlist.

Benefits
Covers Part B premiums ($174.70/month) Deductibles ($240/year) Copays (~20%)

Optional State Supplementation (OSS)

Illinois Optional State Supplementation

Age 65+ or disabled
General Illinois resident, in approved facility, SSI recipient or low-income.
Income Limits (2025) ~$1,004/month including SSI
Asset Limits $2,000 (individual), $3,000 (couple).
IL

~$50-$500/month based on facility type.

Benefits
Cash (~$50-$500/month) for room/board in personal care homes or SLFs

VA Aid and Attendance (A&A) and Housebound Benefits

Illinois VA Aid and Attendance/Housebound

Age 65+ or disabled veteran/spouse
General Illinois resident, wartime service, need for ADL help (A&A) or homebound.
Income Limits (2025) Net income < ~$1,984/month (veteran with dependent, A&A); pension offsets income.
Asset Limits ~$155,356 net worth limit
IL

High veteran demand in urban/rural areas.

Benefits
Cash (~$1,433-$2,642/month veteran, ~$951-$1,318 spouse) for care costs (e.g., in-home, assisted living)

Frequently Asked Questions about Westminster Village Al

Who is the owner of Westminster Village Al?

The legal owner and operator of Westminster Village Al is Westminster Village, Inc..

Is Westminster Village Al in a walkable area?

Westminster Village Al has a walk score of 84. Very walkable. Most errands can be accomplished on foot, and many essentials are within a short walk.

What is the best email address for Westminster Village Al?

The team at Westminster Village Al can be reached at [email protected].

How many beds does Westminster Village Al have?

Westminster Village Al has 72 beds.

Are there photos of Westminster Village Al?

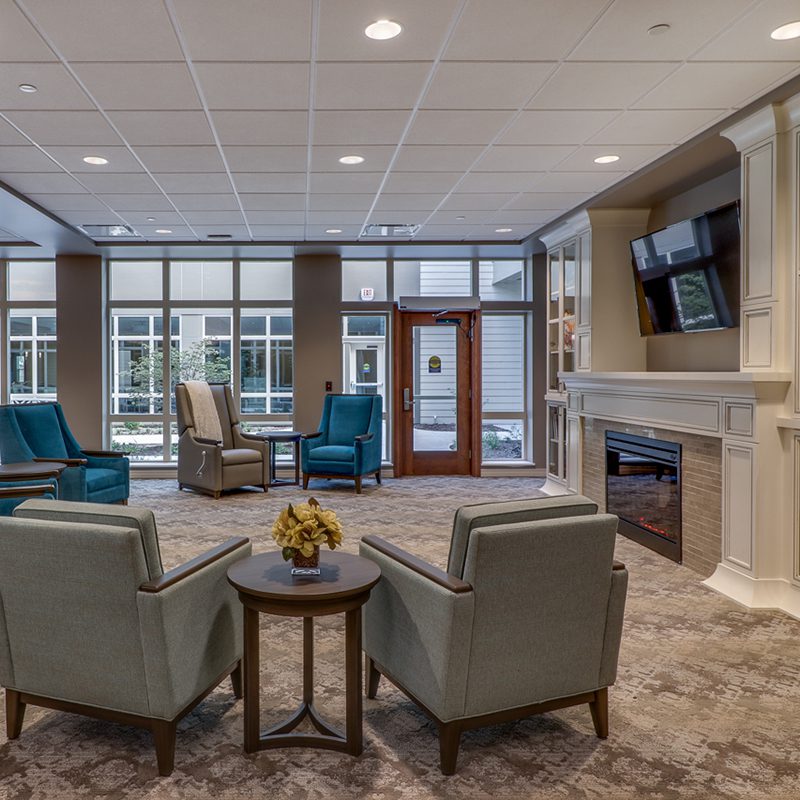
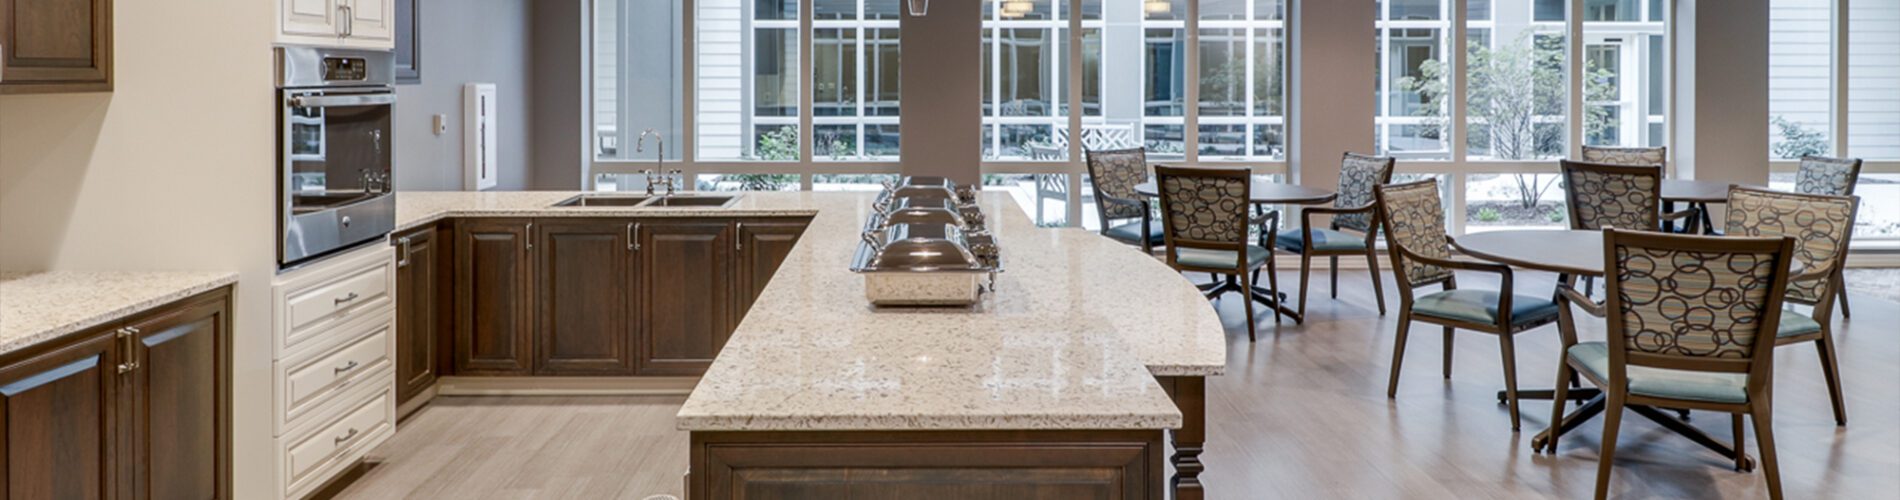
Yes — there are 10 photos of Westminster Village Al in the photo gallery on this page.

What is the address of Westminster Village Al?

Westminster Village Al is located at 2025 E Lincoln St.

What is the phone number of Westminster Village Al?

(309) 663-6474 will put you in contact with the team at Westminster Village Al.

Guides for Better Senior Living

Care Cost Calculator: See Prices in Your Area

Nursing Home Data Explorer

Don’t Wait Too Long: 7 Red Flag Signs Your Parent Needs Assisted Living Now

The True Cost of Assisted Living in 2025 – And How Families Are Paying For It

Understanding Senior Living Costs: Pricing Models, Discounts & Financial Assistance

Explore Open Rooms
1 Contact details
2 What type of senior care service are you looking for?
3 What budget do you have in mind for senior care?
4 How soon do you need to find care?
5 Additional details

Thank you for your interest!

Our team will be in touch shortly to help with next steps.