Westpark Village
Nursing Home · Billings, MT
CMS overall rating Info The Overall CMS Rating is scored from 1 to 5 stars and combines results from health inspections, staffing levels, and quality measures. Health inspections carry the most weight. Staffing and quality scores can increase or decrease the final rating based on performance compared to state and national standards.

Westpark Village

Nursing Home · Billings, MT
CMS overall rating Info The Overall CMS Rating is scored from 1 to 5 stars and combines results from health inspections, staffing levels, and quality measures. Health inspections carry the most weight. Staffing and quality scores can increase or decrease the final rating based on performance compared to state and national standards.
Calculator: See prices in your area
Westpark Village accepts Medicare, Medicaid, and private pay.

Overview of Westpark Village

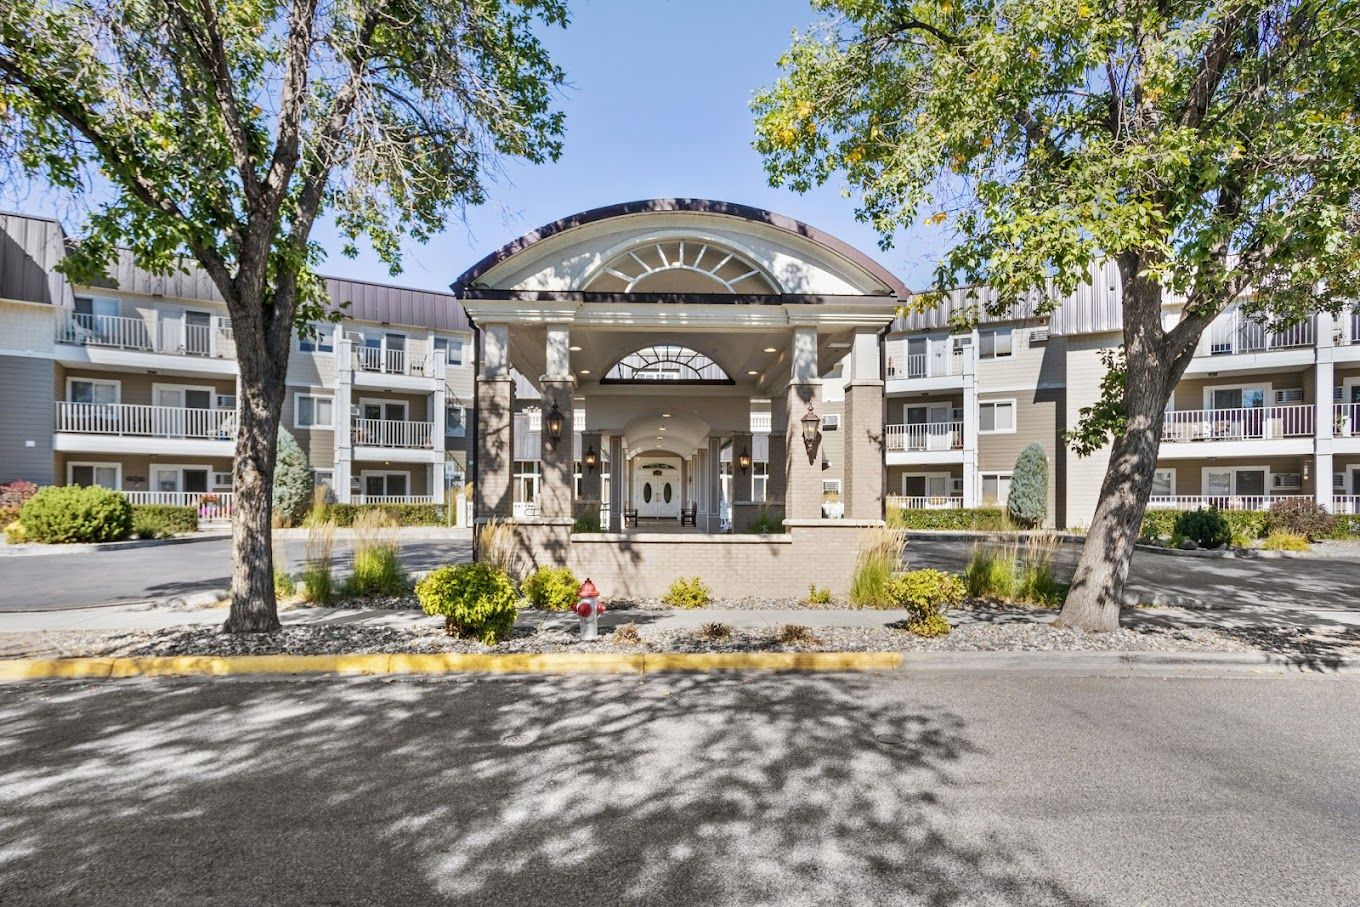
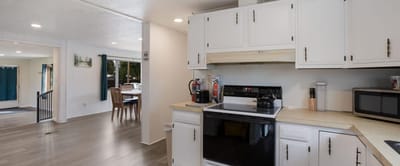
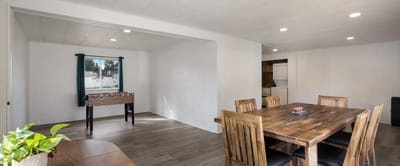
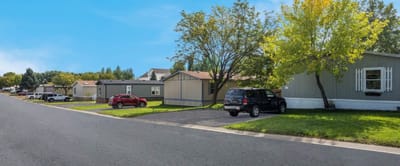
Westpark Village, managed by the esteemed The Goodman Group, has been setting the standard for exceptional senior living since 1986. Its serene and stunning surroundings are unrivaled, offering a range of living options that cater to individual needs, including independent living, assisted living, memory care, and respite care. More than just a place to live, Westpark Village provides a welcoming and supportive environment that allows seniors to savor their golden years. 
Westpark Village boasts an array of amenities that ensure residents are comfortable and cared for, including an emergency call system, gourmet chef-inspired meals, housekeeping, linen service, Wi-Fi, basic cable TV, and personal assistance with daily activities. The facility’s innovative approach to dementia care is based on the Montessori philosophy. With top-notch service and a cozy, family-friendly ambiance, this community is a true haven for those seeking the very best in senior living.

(406) 720-5162

Quality ratings

Measured by Centers for Medicare & Medicaid Services (CMS)

Overall rating Info The Overall CMS Rating combines results from health inspections, staffing levels and quality measures. Health inspections carry the most weight. Staffing and quality scores can increase or decrease the final rating based on performance compared to state and national standards.
▼ 28.6% Below MT avg. ▼ 28.6% Below MT avg.Click the badge to see the full State ranking.Click here to see the full State ranking.
Health Inspection Info Based on the results of the facility's three most recent standard inspections and any complaint investigations. CMS reviews the number, scope, and severity of deficiencies, with more recent findings weighted more heavily.
▼ 23.1% Below MT avg. ▼ 23.1% Below MT avg.Click the badge to see the full State ranking.Click here to see the full State ranking.
Staffing Info Measures average nursing staff hours per resident per day, including Registered Nurses (RNs) and total nursing staff. Ratings are adjusted based on the level of care residents require and are compared to state and national benchmarks.
▲ 37.9% Above MT avg. ▲ 37.9% Above MT avg.Click the badge to see the full State ranking.Click here to see the full State ranking.
Quality Measures Info Based on clinical and physical health indicators reported to CMS, such as hospital readmissions, falls, pressure ulcers, and improvements in mobility. These measures reflect how well residents' health needs are being managed.
At MT avg. At MT avg.Click the badge to see the full State ranking.Click here to see the full State ranking.

Staffing hours breakdown

Info Daily nursing hours per resident by staff type, reported to CMS. Higher is generally better — compare this facility to state and national averages to see where staffing stands.

Hours per resident per day — compared to Montana state averages

Total nursing care / resident Info This home is ranked 12th out of 34 homes in Montana. Total adjusted nursing hours per resident per day, combining RN, LPN, and aide time. CMS adjusts this for case-mix so facilities can be fairly compared.
4h 19m per day
Rank #12 / 34Nurse hours — State benchmarkedThis home is ranked 12th out of 34 homes in Montana. Shows adjusted nurse hours per resident per day benchmarked to the Montana average, with a ranking across 34 Montana SNFs. More hours mean more direct care. The national average is about 3.5 hrs; below 3.0 is a red flag.Click the rank badge to see the full State ranking.Click here to see the full State ranking.
This facility Montana avg (3h 54m per day)
vs Montana avg
+11%
Staff typeHours / Day / Residentvs state avg
Weekend Total Nursing Info Combined nursing hours (RN + LPN + Nurse Aide) per resident per day on weekends. Staffing often drops on weekends — this figure reveals whether the facility maintains adequate coverage outside of weekday hours. 3h 29m per day

Capacity and availability

Avg. Length of Stay
98 days
Bed community size
181-bed community Rank #5 / 106Bed count — State benchmarkedThis home is ranked 5th out of 106 homes in Montana. Shows this facility's certified or reported bed count compared to other Montana SNFs. Larger communities may offer more amenities, programs, and on-site services for residents and families.Click the rank badge to see the full State ranking.Click here to see the full State ranking.
A large-scale community that may provide a wide range of amenities, services, and structured programs.
Walk Score
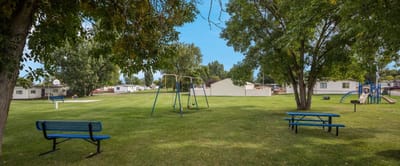
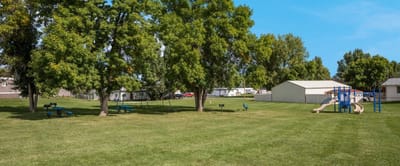
Walk Score: 64 / 100 Rank #37 / 159Walk Score — State benchmarkedThis home is ranked 37th out of 159 homes in Montana. Shows how walkable this facility's neighborhood is compared to the average Walk Score across Montana SNFs. Higher scores benefit residents, families, and staff.Click the rank badge to see the full State ranking.Click here to see the full State ranking.
Moderately walkable. Some errands can be accomplished on foot, with a mix of nearby amenities.

About this community

License Details

Facility TypeAssisted Living Facility
StatusCurrent
IssuanceAugust 19, 2025
ExpirationAugust 18, 2028
License Number12964

Ownership & Operating Entity

Westpark Village is administrated by Megan Brinton.

Safety & Compliance

Safety FeaturesWell-lit streets, On-site management, Snow removal

Additional Policies & Features

Pets Allowed
Minimum Age55+

Amenities & Lifestyle

Bbq Area
Specific Programsorganized activities

Contact Westpark Village

Inspection History

In Montana, the Department of Public Health and Human Services, Quality Assurance Division is the state body responsible for inspecting and licensing all senior residential care facilities.

Since 2023 · 3 years of data 32 deficiencies 6 inspections

Inspection Scorecard Info This scorecard compares key inspection, citation, and complaint metrics at this facility against the Montana state average. Metrics rated ≥15% worse than average are highlighted in red; those ≥15% better are highlighted in green.

Since 2023 vs. Montana state average
Overall vs. MT average 4 Worse Metrics worse than Montana average:
• Total deficiencies (52% above)
• Deficiencies per year (53% above)
• Deficiencies per inspection (26% above)
• Total inspections (20% above)
0 Better No metrics in this bucket.
Latest Inspection July 24, 2025

Deficiencies Info Deficiencies are formal regulatory issues recorded during state inspections.

This FacilityMT Averagevs. MT Avg
Total deficiencies Info Formal regulatory issues recorded by inspectors across all inspection types. 3221 This facility has 52% more total deficiencies than a typical Montana nursing home (32 vs. MT avg 21).↑ 52% worse
Deficiencies per year Info Average deficiencies per year since 2023. 10.77 This facility has 53% more deficiencies per year than a typical Montana nursing home (10.7 vs. MT avg 7).↑ 53% worse
Deficiencies per inspection Info Average deficiencies per inspection. 5.34.2 This facility has 26% more deficiencies per inspection than a typical Montana nursing home (5.3 vs. MT avg 4.2).↑ 26% worse

Inspections Info State inspections evaluate whether the facility meets health and safety standards.

This FacilityMT Averagevs. MT Avg
Total inspections Info Combined count of all routine and focused inspections. Excludes complaint investigations. 65 This facility has 20% more total inspections than a typical Montana nursing home (6 vs. MT avg 5).↑ 20% worse

Read the full inspection reports for this facility, including detailed findings and corrective actions.

Show Inspection Reports

Health Inspection History

Inspections since 2023
Total health inspections 6

Montana average 5.1


Last Health inspection on Aug 2025

Total health citations
28 Rank #17 / 35Health citations — State benchmarkedThis home is ranked 17th out of 35 homes in Montana. Shows this facility's total health deficiency citations benchmarked to the Montana State average, with a ranking across all 35 MT SNFs. Lower citation counts earn a better rank.Click the rank badge to see the full State ranking.Click here to see the full State ranking.

Montana average 29.7

Citations per inspection
4.67 Rank #9 / 35Citations per inspection — State benchmarkedThis home is ranked 9th out of 35 homes in Montana. Shows average deficiency citations per CMS inspection for this facility versus the Montana mean across 35 SNFs with citation data. Lower is better.Click the rank badge to see the full State ranking.Click here to see the full State ranking.

Montana average 5.72


Health citations are formal notices following inspections when they fail to comply with safety and care standards.

14 of 28 citations resulted from standard inspections; 12 of 28 resulted from complaint investigations; and 2 of 28 came from combined inspections (standard and complaint).

Breakdown of citation severity (last 3 years)
Critical health citations
0
100% better than Montana average

Montana average: 0.3


Serious health citations
2
9% better than Montana average

Montana average: 2.2

0 critical citations Montana average: 0.3

2 serious citations Montana average: 2.2

25 moderate citations Montana average: 26.5

1 minor citation Montana average: 0.7
Citations history (last 3 years)
Abuse/Neglect moderate citation Aug 28, 2025
Corrected

Nursing Services moderate citation Aug 28, 2025
Corrected

Nutrition moderate citation Aug 28, 2025
Corrected

Nutrition moderate citation Aug 28, 2025
Corrected

Staffing Data

Reporting period: October 1 – December 31, 2025 (Q4 2025). Source: CMS Payroll-Based Journal report.

Total staff 232
Employees 151
Contractors 81
Staff to resident ratio 1.47:1
21% worse than Montana average
Montana average ratio: 1.86:1 Montana average ratio: 1.86:1See full Montana ranking
Avg staff/day 81
Average shift 8.6 hours
0% compared with Montana average
Montana average: 8.6 hours Montana average shift: 8.6 hoursSee full Montana ranking
Total staff hours (quarter) 63,760

Nursing staff breakdown

Q4 2025 · Oct 1 – Dec 31 More info This data comes from the CMS Payroll-Based Journal report covering October 1 – December 31, 2025.
Registered Nurse

Manages medical care and health needs.

RN Staff 31
Average shift length Info Average shift length. Calculated as total hours divided by days worked and average staff per day. 9.8 hours

This role is partially covered by contractors.

Licensed Practical Nurse

Assists with medical care and medications.

LPN Staff 14
Average shift length Info Average shift length. Calculated as total hours divided by days worked and average staff per day. 9.7 hours

This role is partially covered by contractors.

Certified Nursing Assistant

Helps with daily care and mobility.

CNA Staff 112
Average shift length Info Average shift length. Calculated as total hours divided by days worked and average staff per day. 8.8 hours

This role is partially covered by contractors.

Contractor staffing

Q4 2025 · Oct 1 – Dec 31 More info This data comes from the CMS Payroll-Based Journal report covering October 1 – December 31, 2025.

Total hours from contractors

15.4%

9,806 contractor hours this quarter

Certified Nursing Assistant: 22 Respiratory Therapy Technician: 11 Registered Nurse: 8 Qualified Social Worker: 8 Physical Therapy Assistant: 7 Licensed Practical Nurse: 7 Therapeutic Recreation Specialist: 6 Medication Aide/Technician: 4 Speech Language Pathologist: 4 Physical Therapy Aide: 2 Occupational Therapy Assistant: 1 Medical Director: 1

Staff by category

Q4 2025 · Oct 1 – Dec 31 More info This data comes from the CMS Payroll-Based Journal report covering October 1 – December 31, 2025.
Certified Nursing Assistant902211231,46992100%8.8
Registered Nurse2383110,95792100%9.8
Medication Aide/Technician104144,07292100%9.3
Clinical Nurse Specialist6062,8156975%9.2
Licensed Practical Nurse77142,61492100%9.7
Therapeutic Recreation Specialist0662,02092100%7.1
Other Dietary Services Staff4041,7149098%7.3
Speech Language Pathologist0441,0507582%6.4
Physical Therapy Assistant0779778087%6.3
Qualified Activities Professional3039668997%10.6
Dental Services Staff3039256672%7.7
Respiratory Therapy Technician011118497076%5.2
Qualified Social Worker0886897076%5.1
RN Director of Nursing1014906470%7.7
Mental Health Service Worker1014645863%8
Dietitian1014355560%7.9
Nurse Practitioner1014245358%8
Administrator1013844852%8
Occupational Therapy Assistant0112646672%4
Medical Director0111041314%8
Physical Therapy Aide022792729%2.8
112 Certified Nursing Assistant
% of Days 100%
31 Registered Nurse
% of Days 100%
14 Medication Aide/Technician
% of Days 100%
6 Clinical Nurse Specialist
% of Days 75%
14 Licensed Practical Nurse
% of Days 100%
6 Therapeutic Recreation Specialist
% of Days 100%
4 Other Dietary Services Staff
% of Days 98%
4 Speech Language Pathologist
% of Days 82%
7 Physical Therapy Assistant
% of Days 87%
3 Qualified Activities Professional
% of Days 97%
3 Dental Services Staff
% of Days 72%
11 Respiratory Therapy Technician
% of Days 76%
8 Qualified Social Worker
% of Days 76%
1 RN Director of Nursing
% of Days 70%
1 Mental Health Service Worker
% of Days 63%
1 Dietitian
% of Days 60%
1 Nurse Practitioner
% of Days 58%
1 Administrator
% of Days 52%
1 Occupational Therapy Assistant
% of Days 72%
1 Medical Director
% of Days 14%
2 Physical Therapy Aide
% of Days 29%

Penalties and fines

Includes penalties issued in 2024-2025

Federal penalties imposed by CMS for regulatory violations, including civil money penalties (fines) and denials of payment for new Medicare/Medicaid admissions.

Source: CMS Penalties Database (Data as of Jan 2026)

Total fines amount $34K Rank #20 / 35Federal fines — State benchmarkedThis home is ranked 20th out of 35 homes in Montana. Shows this facility's cumulative CMS federal fine dollars versus the Montana average among facilities with fines, and where it ranks among 35 skilled nursing facilities in the pool. Lower total dollars mean a better rank.Click the rank badge to see the full State ranking.Click here to see the full State ranking.
61% lower than Montana average

Montana average: $87K

Number of fines 2
14% fewer fines than Montana average

Montana average: 2.3

Payment Denials Info Serious action where Medicare and/or Medicaid temporarily stops payments for new residents until issues are fixed. 0
100% fewer payment denials than Montana average

Montana average: 0.2

Fines amount comparison
This facility $34K
Montana average $87K
Penalty History

Penalties are imposed by CMS for violations of federal nursing home regulations.

2 penalties in the past 3 years

Multiple penalties were reported in the last 3 years.

Civil Money Penalty Info Fines imposed for noncompliance, which can be assessed per day or per instance of violation. Aug 28, 2025
$17K
Civil Money Penalty Info Fines imposed for noncompliance, which can be assessed per day or per instance of violation. Aug 1, 2024
$17K

Last updated: Jan 2026

Quality of care over time

These measures show how residents usually do over time at this home, based on health outcomes and preventive care.

High-risk clinical events score Info A composite score based on pressure ulcers, falls with injury, weight loss, walking ability decline, and activities of daily living decline. 12.8
14% worse than Montana average

Montana average: 11.2

Functional decline score Info A composite score based on activities of daily living decline, walking ability decline, and incontinence. 25.6
18% worse than Montana average

Montana average: 21.8

Long-stay resident measures
Need for Help with Daily Activities Increased Info Percent of long-stay residents whose need for help with daily activities has increased 17.7%
9% better than Montana average

Montana average: 19.4%

Walking Ability Worsened Info Percent of long-stay residents whose ability to move independently worsened 27.0%
30% worse than Montana average

Montana average: 20.8%

Low Risk Residents with Bowel/Bladder Incontinence Info Percent of low risk long-stay residents who lose control of their bowels or bladder 32.2%
28% worse than Montana average

Montana average: 25.2%

Falls with Major Injury Info Percent of long-stay residents experiencing one or more falls with major injury 2.0%
55% better than Montana average

Montana average: 4.3%

High Risk Residents with Pressure Ulcers Info Percent of long-stay high risk residents with pressure ulcers 9.1%
45% worse than Montana average

Montana average: 6.3%

Urinary Tract Infection Info Percent of long-stay residents with a urinary tract infection 0.5%
84% better than Montana average

Montana average: 2.8%

Lost Too Much Weight Info Percent of long-stay residents who lose too much weight 8.1%
33% worse than Montana average

Montana average: 6.1%

Depressive Symptoms Info Percent of long-stay residents who have depressive symptoms 5.7%
21% worse than Montana average

Montana average: 4.7%

Antipsychotic Use Info Percent of long-stay residents who received an antipsychotic medication 19.8%
In line with Montana average

Montana average: 19.1%

Pneumococcal Vaccine Info Percent of long-stay residents assessed and appropriately given the pneumococcal vaccine 98.9%
6% better than Montana average

Montana average: 93.8%

Influenza Vaccine Info Percent of long-stay residents assessed and appropriately given the seasonal influenza vaccine 99.2%
6% better than Montana average

Montana average: 93.7%

Short-stay resident measures
Pneumococcal Vaccine Info Percent of short-stay residents assessed and appropriately given the pneumococcal vaccine 97.4%
28% better than Montana average

Montana average: 76.4%

Antipsychotic medication increase Info Percent of short-stay residents who newly received an antipsychotic medication 0.2%
91% better than Montana average

Montana average: 1.8%

Influenza Vaccine Info Percent of short-stay residents assessed and appropriately given the seasonal influenza vaccine 93.8%
27% better than Montana average

Montana average: 73.8%

Breakdown by payment type

Medicare

53% of new residents, usually for short-term rehab.

Typical stay 1 - 2 months

Private pay

39% of new residents, often for short stays.

Typical stay 2 - 3 months

Medicaid

8% of new residents, often for long-term daily care.

Typical stay 1 - 2 years

Facility Characteristics

Source: CMS Long-Term Care Facility Characteristics (Data as of Jan 2026)

Total residents 158
Medicare
40
25.3% of residents
Medicaid
76
48.1% of residents
Private pay or other
42
26.6% of residents
Programs & Services
Residents Group

Residents meet regularly to discuss policies, care quality, and activities

Active Resident Council

Organized group of residents that meets regularly to discuss facility policies, quality of life, and activities.

Finances and operations

Privately-owned community
Operated by a business corporation.
Home revenue
$17.7M
Operating loss
-$1.7M
Privately-owned community Operated by a business corporation.
Home revenue
$17.7M Rank #2 / 31Revenue — State benchmarkedThis home is ranked 2nd out of 31 homes in Montana. Shows this facility's annual revenue compared to the Montana SNF average. Higher revenue generally means more resources for staffing and capital — read alongside Payroll %.Click the rank badge to see the full State ranking.Click here to see the full State ranking.
Operating loss
-$1.7M
Payroll costs Info The portion of the home's budget spent on staff, including nurses, caregivers, and other employees who support care and operations. Rank #2 / 31Payroll — State benchmarkedThis home is ranked 2nd out of 31 homes in Montana. Shows total annual staff payroll benchmarked to the Montana average. Higher payroll investment relative to peers often signals better staffing and less reliance on cheaper contract labor.Click the rank badge to see the full State ranking.Click here to see the full State ranking.
$11.7M
66.1% of revenue Rank #8 / 31Payroll % — State benchmarkedThis home is ranked 8th out of 31 homes in Montana. Shows payroll as a percentage of revenue versus the Montana average. Well-run Montana SNFs typically land around 65–71% — the top third Statewide. Below 25% may signal understaffing or heavy agency use — read with Staffing ratings.Click the rank badge to see the full State ranking.Click here to see the full State ranking.
Other operating costs Info All remaining costs needed to run the home, such as food, utilities, building maintenance, supplies and administrative expenses.
$7.7M
Total costs $19.5M

Who this home usually serves

TYPE OF STAY

Mostly short-term rehab stays

Most residents typically stay for a few weeks or months before returning home or moving on.

Places of interest near Westpark Village

Address 3.4 miles from city center Info Estimated distance in miles from Billings's city center to Westpark Village's address, calculated via Google Maps. — 0.75 miles to nearest hospital (Linde LLC)

Calculate Travel Distance to Westpark Village

Add your location

Address

Financial Assistance for
Nursing Home in Montana

Westpark Village is located in Billings, Montana.
Here are the financial assistance programs available to residents in Montana.

Get Financial aid guidance

Big Sky Waiver

Montana Medicaid Big Sky Waiver

Age 65+ or disabled
General Montana resident, Medicaid- eligible, nursing home-level care need.
Income Limits (2025) ~$2,829/month 300% FBR, individual
Asset Limits $2,000 (individual), $3,000 (couple).
MT

Rural state; limited providers in some areas.

Benefits
Personal care (5-7 hours/day) Respite (240 hours/year) Home modifications ($1,500 avg.) Meals ($6/meal)

Montana Community First Choice

MT CFC

Age 65+ or disabled
General Montana resident, Medicaid- eligible.
Income Limits ~$1,732/month individual, Medicaid threshold
Asset Limits $2,000 individual
MT

Less intensive than waiver; rural focus.

Benefits
Personal care (up to 40 hours/month) Homemaker services Respite (varies)

Big Sky Rx

Montana Big Sky Rx

Age 65+ or disabled
General Montana resident, enrolled in Medicare Part D, income below limit.
Income Limits (2025) ~$2,510/month (individual), ~$3,380/month (couple).
Asset Limits Not assessed.
MT

Covers up to $38.75/month premium; statewide via AAAs.

Benefits
Prescription drug premium assistance (~$465/year) Reducing out-of-pocket costs

Medicare Savings Program (MSP)

Montana Medicare Savings Program

Age 65+ or disabled
General Montana resident, Medicare Part A/B.
Income Limits (2025) ~$2,510/month (QMB), ~$3,380/month (SLMB), ~$3,598/month (QI)—individual.
Asset Limits $9,430 (individual), $14,130 (couple).
MT

Three tiers; no waitlist; includes Extra Help for Part D.

Benefits
Covers Part B premiums ($174.70/month) Deductibles ($240/year) Copays (~20%)

Montana Caregiver Support Program (via NFCSP)

Montana Caregiver Support Program

Age
General Caregivers of 60+ needing care or 55+ caregivers of others; Montana resident; functional needs (2+ ADLs).
Income Limits (2025) Prioritizes ~$24,980/year (individual); no strict cap.
Asset Limits Not assessed; need-based.
MT

10 AAAs; prioritizes low-income, rural caregivers.

Benefits
Respite (4-6 hours/week or 5 days/year) Adult day care ($50/day) Training Supplies (~$500/year)

VA Aid and Attendance (A&A) and Housebound Benefits

Montana VA Aid and Attendance/Housebound

Age 65+ or disabled veteran/spouse
General Montana resident, wartime service, need for ADL help (A&A) or homebound.
Income Limits (2025) Net income < ~$1,984/month (veteran with dependent, A&A); pension offsets income.
Asset Limits ~$155,356 net worth limit
MT

High veteran demand in rural areas.

Benefits
Cash (~$1,433-$2,642/month veteran, ~$951-$1,318 spouse) for care costs (e.g., in-home, assisted living)

Compare Nursing Home around Billings

The information below is reported by the Montana Department of Public Health and Human Services, Quality Assurance Division.

4 facilities compared · CMS & MT Dept. of Health data

Filter by care type
St. John‘s United
NH

Nursing Home Licensed facility providing 24/7 skilled nursing care for residents with complex, ongoing medical needs. Staffed by RNs, LPNs, and CNAs. Inspected and star-rated annually by CMS. Accepts Medicare (short-term rehab) and Medicaid (long-term care).

AL

Assisted Living A licensed, long-term care setting for seniors or individuals with disabilities who need help with daily activities — like bathing, dressing, and medication management — but not 24-hour skilled nursing. Offers housing, meals, and around-the-clock support while aiming to maximize resident independence.

HC

Home Care Professional care delivered in the person's own home — from companionship and errands to skilled nursing and therapy. Allows seniors to age in place. Medicare covers skilled home health when medically necessary.

HC

Home Care Professional care delivered in the person's own home — from companionship and errands to skilled nursing and therapy. Allows seniors to age in place. Medicare covers skilled home health when medically necessary.

IL

Independent Living Lifestyle-focused communities for older adults offering dining, activities, and transportation with minimal personal care. Best for active, independent seniors who want community without medical support.

MC

Memory Care Secured, specialized care for people living with Alzheimer's or dementia. Staff trained in cognitive impairment, with higher staff-to-resident ratios and an environment designed to reduce confusion and wandering risk.

Billings104 25.0% -59%5.27 -29%+16%$0338.3-26 6 Gerald Pearsall$40.6M$19.6M48.4%275024
Westpark Village
NH

Nursing Home Licensed facility providing 24/7 skilled nursing care for residents with complex, ongoing medical needs. Staffed by RNs, LPNs, and CNAs. Inspected and star-rated annually by CMS. Accepts Medicare (short-term rehab) and Medicaid (long-term care).

AL

Assisted Living A licensed, long-term care setting for seniors or individuals with disabilities who need help with daily activities — like bathing, dressing, and medication management — but not 24-hour skilled nursing. Offers housing, meals, and around-the-clock support while aiming to maximize resident independence.

Billings (Solomon Avenue)181 15.5% -75%4.31 -14%-5%$33.9k284.7228 64 Community Nursing, Inc$17.7M$11.7M66.1%275043
Yellowstone River Nursing and Rehabilitation
NH

Nursing Home Licensed facility providing 24/7 skilled nursing care for residents with complex, ongoing medical needs. Staffed by RNs, LPNs, and CNAs. Inspected and star-rated annually by CMS. Accepts Medicare (short-term rehab) and Medicaid (long-term care).

AL

Assisted Living A licensed, long-term care setting for seniors or individuals with disabilities who need help with daily activities — like bathing, dressing, and medication management — but not 24-hour skilled nursing. Offers housing, meals, and around-the-clock support while aiming to maximize resident independence.

Billings (East Central)160 1.3% -98%3.57 +50%-21%$61.2k496.152 67 Sarah Caldwell$7.6M$4.6M60.4%275029
Eagle Cliff Healthcare Community
NH

Nursing Home Licensed facility providing 24/7 skilled nursing care for residents with complex, ongoing medical needs. Staffed by RNs, LPNs, and CNAs. Inspected and star-rated annually by CMS. Accepts Medicare (short-term rehab) and Medicaid (long-term care).

AL

Assisted Living A licensed, long-term care setting for seniors or individuals with disabilities who need help with daily activities — like bathing, dressing, and medication management — but not 24-hour skilled nursing. Offers housing, meals, and around-the-clock support while aiming to maximize resident independence.

Billings (Heights)129 27.9% -55%3.54 -29%-22%$99.4k6410.7436 3 Amin Family Limited Partnership$4.5M$2.2M50.1%275123

Frequently Asked Questions about Westpark Village

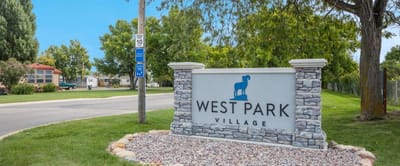
What neighborhood is Westpark Village in?

Westpark Village is in the Solomon Avenue neighborhood of Billings.

Is Westpark Village in a walkable area?

Westpark Village has a walk score of 64. Moderately walkable. Some errands can be accomplished on foot, with a mix of nearby amenities.

What is the license number of Westpark Village?

According to MT state health department records, Westpark Village's license number is 12964.

When does Westpark Village's license expire?

According to MT state health department records, Westpark Village's license expires on August 18, 2028.

Who is the administrator of Westpark Village?

Megan Brinton is the administrator of Westpark Village.

How many beds does Westpark Village have?

Westpark Village has 181 beds.

Are there photos of Westpark Village?

Yes — there are 13 photos of Westpark Village in the photo gallery on this page.

Guides for Better Senior Living

Care Cost Calculator: See Prices in Your Area

Nursing Home Data Explorer

Don’t Wait Too Long: 7 Red Flag Signs Your Parent Needs Assisted Living Now

The True Cost of Assisted Living in 2025 – And How Families Are Paying For It

Understanding Senior Living Costs: Pricing Models, Discounts & Financial Assistance

Explore Open Rooms
1 Contact details
2 What type of senior care service are you looking for?
3 What budget do you have in mind for senior care?
4 How soon do you need to find care?
5 Additional details

Thank you for your interest!

Our team will be in touch shortly to help with next steps.