Westwood Nursing Center
Nursing Home & Nursing Care · Detroit, MI
CMS overall rating Info CMS (the Centers for Medicare & Medicaid Services) is the federal agency that rates nursing home quality. Its Overall Rating runs from 1 to 5 stars, combining health inspections, staffing, and quality measures, with inspections weighted most heavily.

Westwood Nursing Center

Nursing Home & Nursing Care · Detroit, MI
CMS overall rating Info CMS (the Centers for Medicare & Medicaid Services) is the federal agency that rates nursing home quality. Its Overall Rating runs from 1 to 5 stars, combining health inspections, staffing, and quality measures, with inspections weighted most heavily.
Calculator: See prices in your area
Westwood Nursing Center accepts Medicare and private pay.

Overview of Westwood Nursing Center

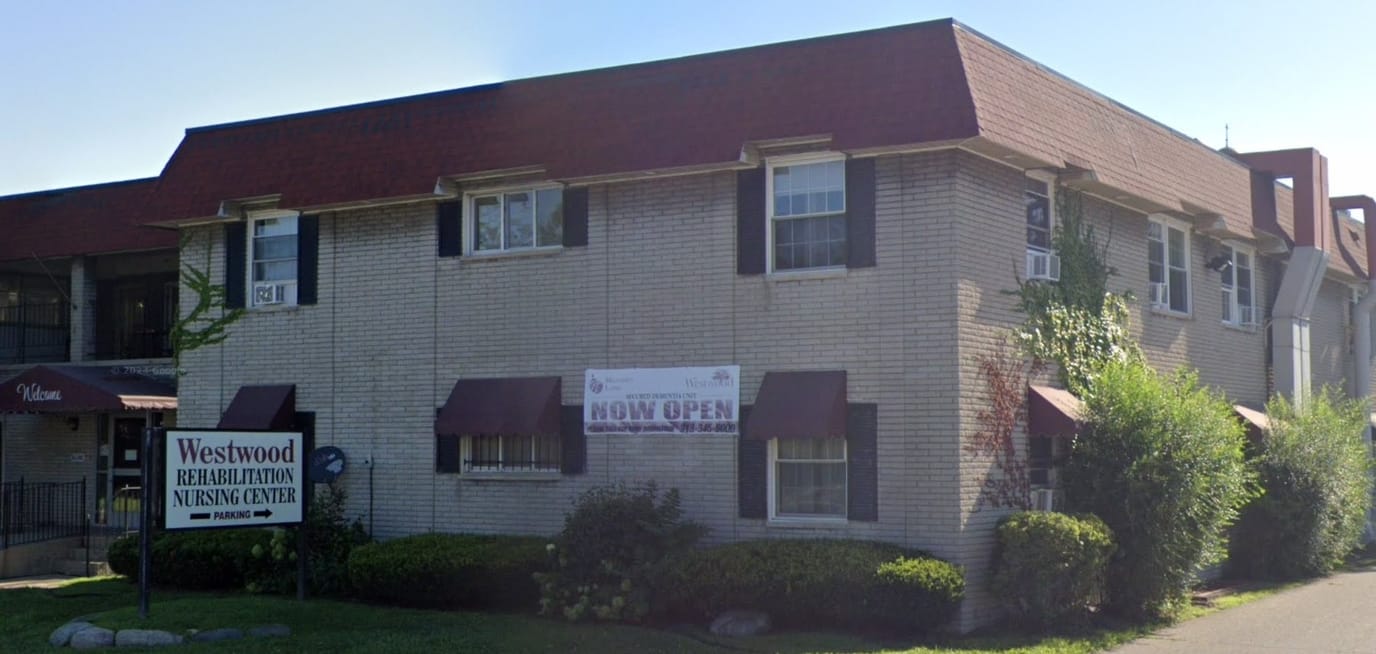
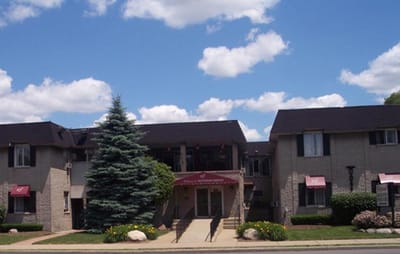
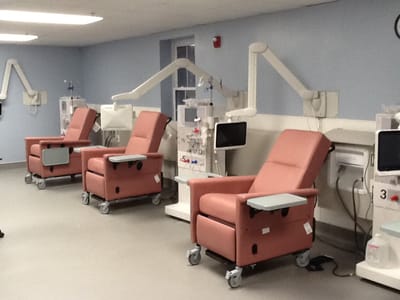
Set in the serene area of Detroit, MI, Westwood Nursing Center provides residents with a healing environment for skilled nursing care and rehabilitation. Their highly-trained team of LPNs, RNs, and CNAs are available 24/7 to provide residents with loving nursing care and assistance with their daily activities. Those looking to regain their skills to get back to their old routines have access to excellent physical, speech, and occupational therapy services on-site

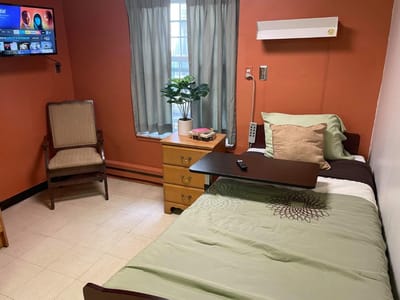
To ensure residents feel comfortable and secure in their accommodations, the community features a dedicated housekeeping department to maintain the cleanliness and organization of their living spaces. Nutritionally balanced and flavorful meals are also served fresh with options for fine dining for those seeking a restaurant feel. Fun recreational activities are also held regularly to keep residents moving and connected. At Westwood Nursing Center, they provide all the comforts and conveniences residents need to maintain their overall well-being.

(313) 345-5000

Quality ratings

Measured by Centers for Medicare & Medicaid Services (CMS)

Overall rating Info The Overall CMS Rating combines results from health inspections, staffing levels and quality measures. Health inspections carry the most weight. Staffing and quality scores can increase or decrease the final rating based on performance compared to state and national standards.
▼ 15.5% Below MI avg. ▼ 15.5% Below MI avg.MI average: 3.6Click the badge to see the full State ranking.Click here to see the full State ranking.
Health Inspection Info Based on the results of the facility's three most recent standard inspections and any complaint investigations. CMS reviews the number, scope, and severity of deficiencies, with more recent findings weighted more heavily.
▼ 9.9% Below MI avg. ▼ 9.9% Below MI avg.MI average: 3.3Click the badge to see the full State ranking.Click here to see the full State ranking.
Staffing Info Measures average nursing staff hours per resident per day, including Registered Nurses (RNs) and total nursing staff. Ratings are adjusted based on the level of care residents require and are compared to state and national benchmarks.
▼ 40.5% Below MI avg. ▼ 40.5% Below MI avg.MI average: 3.4Click the badge to see the full State ranking.Click here to see the full State ranking.
Quality Measures Info Based on clinical and physical health indicators reported to CMS, such as hospital readmissions, falls, pressure ulcers, and improvements in mobility. These measures reflect how well residents' health needs are being managed.
▼ 47.5% Below MI avg. ▼ 47.5% Below MI avg.MI average: 3.8Click the badge to see the full State ranking.Click here to see the full State ranking.

Staffing hours breakdown

Info Daily nursing hours per resident by staff type, reported to CMS. Higher is generally better — compare this facility to state and national averages to see where staffing stands.

Hours per resident per day — compared to Michigan state averages

Total nursing care / resident Info This home is ranked 130th out of 133 homes in Michigan for nurse hours. Total adjusted nursing hours per resident per day, combining RN, LPN, and aide time. CMS adjusts this for case-mix so facilities can be fairly compared.
3h 9m per day
Rank #130 / 133Nurse hours — State benchmarkedThis home is ranked 130th out of 133 homes in Michigan. Shows adjusted nurse hours per resident per day benchmarked to the Michigan average, with a ranking across 133 Michigan facilities. More hours mean more direct care. The national average is about 3.5 hrs; below 3.0 is a red flag.Click the rank badge to see the full State ranking.Click here to see the full State ranking.
This facility Michigan avg (4h 15m per day)
vs Michigan avg
-26%

5 of 6 metrics below state avg

Standout metric LPN / LVN is +8% above state avg
Staff type Hours / Day / Resident vs state avg
Registered Nurse (RN) Info RNs hold the highest nursing license and can assess residents, interpret test results, and direct care plans. More RN hours per day often signals stronger clinical oversight and faster response to health changes. 24m per day ▼ 48% State avg: 46m per day · National avg: 41m per day
LPN / LVN Info Licensed Practical Nurses (LPNs) or Licensed Vocational Nurses (LVNs) deliver routine hands-on care — medication administration, wound dressing, and monitoring vital signs. They work under RN supervision and make up a large share of daily bedside care. 57m per day ▲ 8% State avg: 53m per day · National avg: 52m per day
Nurse Aide Info Certified Nurse Aides (CNAs) provide the most direct day-to-day assistance: bathing, dressing, feeding, and mobility. Nurse aide hours are typically the largest staffing category and directly affect residents' quality of life. 1h 57m per day ▼ 18% State avg: 2h 23m per day · National avg: 2h 21m per day
Weekend Total Nursing Info Combined nursing hours (RN + LPN + Nurse Aide) per resident per day on weekends. Staffing often drops on weekends — this figure reveals whether the facility maintains adequate coverage outside of weekday hours. 2h 43m per day ▼ 23% State avg: 3h 31m per day · National avg: 3h 26m per day
Physical Therapist Info Hours per resident per day provided by licensed Physical Therapists (PTs) or PT Assistants. PT services help residents recover mobility after injury or illness and are especially important for post-acute (short-stay) rehabilitation. 0m per day ▼ 100% State avg: 4m per day · National avg: 4m per day
Weekend RN Info Registered nurse hours specifically on weekends. Facilities sometimes reduce RN presence on Saturdays and Sundays — a low weekend RN figure compared to weekday hours can indicate reduced clinical oversight when most administrative staff are absent. 15m per day ▼ 50% State avg: 29m per day · National avg: 29m per day

Capacity and availability

This home usually has availability

Lower occupancy than the Michigan average: 75.8%
Occupancy rate
65.1% Rank #138 / 386Occupancy rate — State benchmarkedThis home is ranked 138th out of 386 homes in Michigan. Shows this facility's occupancy rate versus the Michigan average, with its Statewide rank out of 386. Higher occupancy signals strong local demand and financial stability.Click the rank badge to see the full State ranking.Click here to see the full State ranking.
Avg. Length of Stay
169 days
Walk Score
Walk Score: 76 / 100 Rank #47 / 703Walk Score — State benchmarkedThis home is ranked 47th out of 703 homes in Michigan. Shows how walkable this facility's neighborhood is compared to the average Walk Score across Michigan facilities. Higher scores benefit residents, families, and staff.Click the rank badge to see the full State ranking.Click here to see the full State ranking.
Very walkable. Most errands can be accomplished on foot, and many essentials are within a short walk.

Contact Westwood Nursing Center

Inspection History

In Michigan, the Department of Licensing and Regulatory Affairs (LARA) conducts unannounced inspections and investigations to ensure long-term care facilities comply with state health codes.

Since 2022 · 4 years of data 49 deficiencies 9 inspections

Inspection Scorecard Info This scorecard compares key inspection, citation, and complaint metrics at this facility against the Michigan state average. Metrics rated ≥15% worse than average are highlighted in red; those ≥15% better are highlighted in green.

Since 2022 vs. Michigan state average
Overall vs. MI average 4 Worse Metrics worse than Michigan average:
• Total deficiencies (513% above)
• Deficiencies per year (515% above)
• Deficiencies per inspection (238% above)
• Total inspections (80% above)
0 Better No metrics in this bucket.
Latest Inspection February 20, 2025 Complaint Investigation

Deficiencies Info Deficiencies are formal regulatory issues recorded during state inspections.

This Facility MI Average vs. MI Avg
Total deficiencies Info Formal regulatory issues recorded by inspectors across all inspection types. 49 8 This facility has 513% more total deficiencies than a typical Michigan nursing home (49 vs. MI avg 8).↑ 513% worse
Deficiencies per year Info Average deficiencies per year since 2022. 12.3 2 This facility has 515% more deficiencies per year than a typical Michigan nursing home (12.3 vs. MI avg 2).↑ 515% worse
Deficiencies per inspection Info Average deficiencies per inspection. 5.4 1.6 This facility has 238% more deficiencies per inspection than a typical Michigan nursing home (5.4 vs. MI avg 1.6).↑ 238% worse

Inspections Info State inspections evaluate whether the facility meets health and safety standards.

This Facility MI Average vs. MI Avg
Total inspections Info Combined count of all routine and focused inspections. Excludes complaint investigations. 9 5 This facility has 80% more total inspections than a typical Michigan nursing home (9 vs. MI avg 5).↑ 80% worse

Health Inspection History

Inspections since 2022
Total health inspections 9

Michigan average 6.5


Last Health inspection on Feb 2025

Total health citations
44 Rank #95 / 135Health citations — State benchmarkedThis home is ranked 95th out of 135 homes in Michigan. Shows this facility's total health deficiency citations benchmarked to the Michigan State average, with a ranking across all 135 MI facilities. Lower citation counts earn a better rank.Click the rank badge to see the full State ranking.Click here to see the full State ranking.

Michigan average 33.5

Citations per inspection
4.89 Rank #64 / 135Citations per inspection — State benchmarkedThis home is ranked 64th out of 135 homes in Michigan. Shows average deficiency citations per CMS inspection for this facility versus the Michigan mean across 135 facilities with citation data. Lower is better.Click the rank badge to see the full State ranking.Click here to see the full State ranking.

Michigan average 5.18


Health citations are formal notices following inspections when they fail to comply with safety and care standards.

30 of 44 citations resulted from standard inspections; 9 of 44 resulted from complaint investigations; and 5 of 44 came from combined inspections (standard and complaint).

Breakdown of citation severity (last 4 years)
Critical health citations
0
100% better than Michigan average

Michigan average: 0.3


Serious health citations
0
100% better than Michigan average

Michigan average: 1.9

0 critical citations Michigan average: 0.3

0 serious citations Michigan average: 1.9

43 moderate citations Michigan average: 30.8

1 minor citation Michigan average: 0.5
Citations history (last 4 years)
Resident Rights moderate citation Feb 20, 2025
Corrected

Pharmacy moderate citation Oct 11, 2024
Corrected

Quality of Care moderate citation Oct 11, 2024
Corrected

Care Planning moderate citation Oct 11, 2024
Corrected

Staffing Data

Reporting period: October 1 – December 31, 2025 (Q4 2025). Source: CMS Payroll-Based Journal report.

Total staff 95
Employees 95
Contractors 0
Staff to resident ratio 0.86 : 1
49% fewer staff per resident than Michigan average
Michigan average ratio: 1.70 : 1 Michigan average ratio: 1.70 : 1See full Michigan ranking
Avg staff/day 49
Average shift 7.7 hours
0% compared with Michigan average
Michigan average: 7.9 hours Michigan average shift: 7.9 hoursSee full Michigan ranking
Total staff hours (quarter) 34,655

Nursing staff breakdown

Q4 2025 · Oct 1 – Dec 31 More info This data comes from the CMS Payroll-Based Journal report covering October 1 – December 31, 2025.
Registered Nurse

Manages medical care and health needs.

RN Staff Info All 7 RN Staff are full-time employees. No contractors work on this role. 7
Average shift length Info Average shift length. Calculated as total hours divided by days worked and average staff per day. 8.1 hours
Licensed Practical Nurse

Assists with medical care and medications.

LPN Staff Info All 26 LPN Staff are full-time employees. No contractors work on this role. 26
Average shift length Info Average shift length. Calculated as total hours divided by days worked and average staff per day. 9 hours
Certified Nursing Assistant

Helps with daily care and mobility.

CNA Staff Info All 52 CNA Staff are full-time employees. No contractors work on this role. 52
Average shift length Info Average shift length. Calculated as total hours divided by days worked and average staff per day. 7.3 hours

Contractor staffing

Q4 2025 · Oct 1 – Dec 31 More info This data comes from the CMS Payroll-Based Journal report covering October 1 – December 31, 2025.
Total hours from contractors 0% — all staff are direct employees this quarter

Staff by category

Q4 2025 · Oct 1 – Dec 31 More info This data comes from the CMS Payroll-Based Journal report covering October 1 – December 31, 2025.
Certified Nursing Assistant 52 0 52 19,258 92 100% 7.3
Licensed Practical Nurse 26 0 26 8,402 92 100% 9
Registered Nurse 7 0 7 2,666 91 99% 8.1
Administrator 3 0 3 1,387 71 77% 7.8
RN Director of Nursing 2 0 2 1,045 66 72% 8.1
Nurse Practitioner 2 0 2 788 67 73% 7.9
Mental Health Service Worker 2 0 2 599 86 93% 5.4
Clinical Nurse Specialist 1 0 1 512 64 70% 8
52 Certified Nursing Assistant
% of Days 100%
26 Licensed Practical Nurse
% of Days 100%
7 Registered Nurse
% of Days 99%
3 Administrator
% of Days 77%
2 RN Director of Nursing
% of Days 72%
2 Nurse Practitioner
% of Days 73%
2 Mental Health Service Worker
% of Days 93%
1 Clinical Nurse Specialist
% of Days 70%

Penalties and fines

Includes penalties issued in 2023

Federal penalties imposed by CMS for regulatory violations, including civil money penalties (fines) and denials of payment for new Medicare/Medicaid admissions.

Source: CMS Penalties Database (Data as of Jan 2026)

Total fines amount $69K Rank #109 / 136Federal fines — State benchmarkedThis home is ranked 109th out of 136 homes in Michigan. Shows this facility's cumulative CMS federal fine dollars versus the Michigan average among facilities with fines, and where it ranks among 136 facilities in the pool. Lower total dollars mean a better rank.Click the rank badge to see the full State ranking.Click here to see the full State ranking.
10% lower than Michigan average

Michigan average: $76K

Number of fines 11
444% more fines than Michigan average

Michigan average: 2.0

Payment Denials Info Serious action where Medicare and/or Medicaid temporarily stops payments for new residents until issues are fixed. 0
100% fewer payment denials than Michigan average

Michigan average: 0.8

Fines amount comparison
This facility $69K
Michigan average $76K
Penalty History

Penalties are imposed by CMS for violations of federal nursing home regulations.

4 penalties in the past 3 years

Multiple penalties were reported in the last 3 years.

Civil Money Penalty Info Fines imposed for noncompliance, which can be assessed per day or per instance of violation. Aug 14, 2023
$5K
Civil Money Penalty Info Fines imposed for noncompliance, which can be assessed per day or per instance of violation. Aug 7, 2023
$5K
Civil Money Penalty Info Fines imposed for noncompliance, which can be assessed per day or per instance of violation. Jul 17, 2023
$14K
Civil Money Penalty Info Fines imposed for noncompliance, which can be assessed per day or per instance of violation. Jun 26, 2023
$5K

Last updated: Jan 2026

Quality of care over time

These measures show how residents usually do over time at this home, based on health outcomes and preventive care.

High-risk clinical events score Info A composite score based on pressure ulcers, falls with injury, weight loss, walking ability decline, and activities of daily living decline. 12.1
44% worse than Michigan average

Michigan average: 8.4

Functional decline score Info A composite score based on activities of daily living decline, walking ability decline, and incontinence. 22.2
36% worse than Michigan average

Michigan average: 16.3

Long-stay resident measures
Below average Info CMS star rating based on long-stay quality measure performance. 5 stars = significantly above average, 1 star = significantly below average.
Need for Help with Daily Activities Increased Info Percent of long-stay residents whose need for help with daily activities has increased 23.8%
91% worse than Michigan average

Michigan average: 12.5%

Walking Ability Worsened Info Percent of long-stay residents whose ability to move independently worsened 22.2%
45% worse than Michigan average

Michigan average: 15.3%

Low Risk Residents with Bowel/Bladder Incontinence Info Percent of low risk long-stay residents who lose control of their bowels or bladder 20.6%
In line with Michigan average

Michigan average: 21.0%

Falls with Major Injury Info Percent of long-stay residents experiencing one or more falls with major injury 3.3%
In line with Michigan average

Michigan average: 3.2%

High Risk Residents with Pressure Ulcers Info Percent of long-stay high risk residents with pressure ulcers 7.8%
36% worse than Michigan average

Michigan average: 5.7%

Urinary Tract Infection Info Percent of long-stay residents with a urinary tract infection 1.1%
37% better than Michigan average

Michigan average: 1.7%

Lost Too Much Weight Info Percent of long-stay residents who lose too much weight 3.3%
42% better than Michigan average

Michigan average: 5.7%

Depressive Symptoms Info Percent of long-stay residents who have depressive symptoms 0.3%
92% better than Michigan average

Michigan average: 3.9%

Antipsychotic Use Info Percent of long-stay residents who received an antipsychotic medication 37.3%
149% worse than Michigan average

Michigan average: 15.0%

Pneumococcal Vaccine Info Percent of long-stay residents assessed and appropriately given the pneumococcal vaccine 52.2%
45% worse than Michigan average

Michigan average: 94.9%

Influenza Vaccine Info Percent of long-stay residents assessed and appropriately given the seasonal influenza vaccine 66.9%
30% worse than Michigan average

Michigan average: 95.0%

Hospitalizations per 1,000 days Info Number of hospitalizations per 1,000 long-stay resident days. 1.44
17% better than Michigan average

Michigan average: 1.74

ED visits per 1,000 days Info Number of outpatient emergency department visits per 1,000 long-stay resident days. 2.47
60% worse than Michigan average

Michigan average: 1.54

Short-stay resident measures
Below average Info CMS star rating based on short-stay quality measure performance. 5 stars = much above average, 1 star = much below average.
Pneumococcal Vaccine Info Percent of short-stay residents assessed and appropriately given the pneumococcal vaccine 18.9%
77% worse than Michigan average

Michigan average: 82.5%

Antipsychotic medication increase Info Percent of short-stay residents who newly received an antipsychotic medication 7.7%
431% worse than Michigan average

Michigan average: 1.4%

Influenza Vaccine Info Percent of short-stay residents assessed and appropriately given the seasonal influenza vaccine 20.0%
75% worse than Michigan average

Michigan average: 79.5%

Re-hospitalized after SNF stay Info Percentage of short-stay residents who were re-hospitalized after their nursing home admission. 28.9%
19% worse than Michigan average

Michigan average: 24.2%

Emergency department visits Info Percentage of short-stay residents who had an outpatient emergency department visit. 10.6%
8% better than Michigan average

Michigan average: 11.5%

Falls with major injury Info Percentage of SNF residents who experience falls with major injury during their stay. 0.7%
8% better than Michigan average

Michigan average: 0.8%

Ability to care for self at discharge Info Percentage of residents at or above expected ability to care for themselves at discharge. 66.7%
24% better than Michigan average

Michigan average: 53.7%

Successful return to home or community Info Rate of successful return to home or community from a skilled nursing facility. 34.9%
31% worse than Michigan average

Michigan average: 50.6%

Breakdown by payment type

Medicare

12% of new residents, usually for short-term rehab.

Typical stay 1 - 2 months

Private pay

88% of new residents, often for short stays.

Typical stay 6 - 7 months

Facility Characteristics

Source: CMS Long-Term Care Facility Characteristics (Data as of Jan 2026)

Total residents 110
Medicare
30
27.3% of residents
Medicaid
55
50% of residents
Private pay or other
25
22.7% of residents
Programs & Services
Residents Group

Residents meet regularly to discuss policies, care quality, and activities

Family Member Group

Family members meet regularly to discuss policies, care quality, and activities

Active Family Council

Organized group of family members that meets regularly to discuss facility policies, resident care, and activities.

Active Resident Council

Organized group of residents that meets regularly to discuss facility policies, quality of life, and activities.

Finances and operations

Based on the 2023 CMS SNF Cost Report.

Voluntary non-profit community
Operated by a church.
Home revenue
$17.9M
Operating deficit
-$744.8K
Voluntary non-profit community Operated by a church.
Home revenue
$17.9M Rank #58 / 134Revenue — State benchmarkedThis home is ranked 58th out of 134 homes in Michigan. Shows this facility's annual revenue compared to the Michigan average. Higher revenue generally means more resources for staffing and capital — read alongside Payroll %.Click the rank badge to see the full State ranking.Click here to see the full State ranking.
Operating deficit
-$744.8K
Payroll costs Info The portion of the home's budget spent on staff, including nurses, caregivers, and other employees who support care and operations. Rank #95 / 134Payroll — State benchmarkedThis home is ranked 95th out of 134 homes in Michigan. Shows total annual staff payroll benchmarked to the Michigan average. Higher payroll investment relative to peers often signals better staffing and less reliance on cheaper contract labor.Click the rank badge to see the full State ranking.Click here to see the full State ranking.
$5.3M
29.7% of revenue Rank #127 / 134Payroll % — State benchmarkedThis home is ranked 127th out of 134 homes in Michigan. Shows payroll as a percentage of revenue versus the Michigan average. Well-run Michigan facilities typically land around 49–59% — the top third Statewide. Below 25% may signal understaffing or heavy agency use — read with Staffing ratings.Click the rank badge to see the full State ranking.Click here to see the full State ranking.
Other operating costs Info All remaining costs needed to run the home, such as food, utilities, building maintenance, supplies and administrative expenses.
$13.3M
Total costs $18.6M

What does this home offer?

Housing options icon

Housing Options: Private / Semi-Private Rooms

Building type icon
Building type icon

Building Type: 2-story

Beauty services icon

Beauty Services

Transportation services icon

Transportation Services

Housekeeping icon
Housekeeping icon

Housekeeping Services

Recreational activities icon

Recreational Activities

Exercise program icon

Exercise Programs

Health Programs icon

Health Programs

Who this home usually serves

TYPE OF STAY

Primarily short stays

Residents typically stay for brief periods, with frequent admissions and discharges throughout the year.

Most new residents arrive under private pay (88% of admissions), and a typical private pay stay runs around 6 - 7 months.

Admissions
170 total

Coverage residents most often arrive under.

Medicare 12%
Private pay 88%
Discharges
170 total

Coverage residents most often leave under.

Medicare 12%
Private pay 88%

Places of interest near Westwood Nursing Center

Address 11.1 miles from city center Info Estimated distance in miles from Detroit's city center to Westwood Nursing Center's address, calculated via Google Maps.

Calculate Travel Distance to Westwood Nursing Center

Add your location

Address

Financial Assistance for
Nursing Home in Michigan

Westwood Nursing Center is located in Detroit, Michigan.
Here are the financial assistance programs available to residents in Michigan.

Get Financial aid guidance

MI Choice Waiver

Michigan Medicaid MI Choice Waiver

Age 65+ or disabled
General Michigan resident, Medicaid- eligible, nursing home-level care need.
Income Limits (2025) ~$2,829/month 300% FBR, individual
Asset Limits $2,000 (individual), $3,000 (couple).
MI

Delivered through regional waiver agents; waitlists possible.

Benefits
Personal care (5-7 hours/day) Respite care (240 hours/year) Home modifications ($1,500 avg.) Adult day care ($65/day)

Home Help Program

Michigan Home Help

Age 65+ or disabled
General Michigan resident, Medicaid- eligible or low-income.
Income Limits ~$1,732/month individual, Medicaid threshold
Asset Limits $2,000 individual
MI

Can hire family caregivers; less intensive than waiver.

Benefits
Personal care (up to 60 hours/month) Homemaker services Respite (varies)

Program of All-Inclusive Care for the Elderly (PACE)

Michigan PACE

Age 55+
General Michigan resident, nursing home-level care need, safe with PACE support.
Income Limits (2025) ~$2,829/month (Medicaid-eligible); private pay option available.
Asset Limits $2,000 (individual), $3,000 (couple).
MI

16 PACE centers (e.g., Ingham, Wayne counties); expanding slowly.

Benefits
Personal care (5-7 hours/day) Medical care Meals Transportation Therapy Respite

Medicare Savings Program (MSP)

Michigan Medicare Savings Program

Age 65+ or disabled
General Michigan resident, Medicare Part A/B.
Income Limits (2025) ~$2,510/month (QMB), ~$3,380/month (SLMB), ~$3,598/month (QI)—individual.
Asset Limits $9,430 (individual), $14,130 (couple).
MI

Three tiers; no waitlist; includes Extra Help for Part D.

Benefits
Covers Part B premiums ($174.70/month) Deductibles ($240/year) Copays (~20%)

National Family Caregiver Support Program (NFCSP) Respite

Michigan NFCSP Respite Care

Age
General Caregivers of 60+ needing care or 55+ caregivers of others; Michigan resident; functional needs (2+ ADLs).
Income Limits (2025) Prioritizes ~$24,980/year (individual); no strict cap.
Asset Limits Not assessed; need-based.
MI

16 AAAs; prioritizes low-income, rural caregivers.

Benefits
Respite (4-6 hours/week or 5 days/year) Adult day care ($60/day) Caregiver training

VA Aid and Attendance (A&A) and Housebound Benefits

Michigan VA Aid and Attendance/Housebound

Age 65+ or disabled veteran/spouse
General Michigan resident, wartime service, need for ADL help (A&A) or homebound.
Income Limits (2025) Net income < ~$1,984/month (veteran with dependent, A&A); pension offsets income.
Asset Limits ~$155,356 net worth limit
MI

High veteran demand in urban/rural areas.

Benefits
Cash (~$1,433-$2,642/month veteran, ~$951-$1,318 spouse) for care costs

Compare Nursing Home around Detroit

The information below is reported by the Michigan Department of Licensing and Regulatory Affairs (LARA).

5 facilities compared · CMS & MI Dept. of Health data

West Oaks Senior Care & Rehab Center
NH

Nursing Home Licensed facility providing 24/7 skilled nursing care for residents with complex, ongoing medical needs. Staffed by RNs, LPNs, and CNAs. Inspected and star-rated annually by CMS. Accepts Medicare (short-term rehab) and Medicaid (long-term care).

Detroit (Berg-Lahser)
102
Facility 102
MI AVG 75
Rank #121 / 435
81.5%
Facility 81.5%
MI AVG 75.8%
Rank #74 / 386
+8%
4.39
Facility 4.39
MI AVG 4.30
Rank #38 / 133
-26% +2%
$0
Facility $0
MI AVG $87.6k
Rank #1 / 136
16
Facility 16
MI AVG 33.5
Rank #28 / 135
2.0
Facility 2.0
MI AVG 5.2
Rank #5 / 135
- 99 -
59
Facility 59
MI AVG 39
Rank #137 / 703
Rosemary Gardner
$13.9M
Facility $13.9M
MI AVG $15.8M
Rank #82 / 134
$7.1M
Facility $7.1M
MI AVG $5.6M
Rank #64 / 134
51.6%
Facility 51.6%
MI AVG 39%
Rank #29 / 134
235374
Allegria Village
NH

Nursing Home Licensed facility providing 24/7 skilled nursing care for residents with complex, ongoing medical needs. Staffed by RNs, LPNs, and CNAs. Inspected and star-rated annually by CMS. Accepts Medicare (short-term rehab) and Medicaid (long-term care).

AL

Assisted Living A licensed, long-term care setting for seniors or individuals with disabilities who need help with daily activities — like bathing, dressing, and medication management — but not 24-hour skilled nursing. Offers housing, meals, and around-the-clock support while aiming to maximize resident independence.

IL

Independent Living Lifestyle-focused communities for older adults offering dining, activities, and transportation with minimal personal care. Best for active, independent seniors who want community without medical support.

MC

Memory Care Secured, specialized care for people living with Alzheimer's or dementia. Staff trained in cognitive impairment, with higher staff-to-resident ratios and an environment designed to reduce confusion and wandering risk.

Dearborn
132
Facility 132
MI AVG 75
Rank #55 / 435
53.0%
Facility 53.0%
MI AVG 75.8%
Rank #176 / 386
-30%
4.72
Facility 4.72
MI AVG 4.30
Rank #31 / 133
-20% +10%
$0
Facility $0
MI AVG $87.6k
Rank #1 / 136
16
Facility 16
MI AVG 33.5
Rank #28 / 135
3.2
Facility 3.2
MI AVG 5.2
Rank #28 / 135
1 81 D-
52
Facility 52
MI AVG 39
Rank #201 / 703
Firo Operator LLC
$35.3M
Facility $35.3M
MI AVG $15.8M
Rank #8 / 134
$17.0M
Facility $17.0M
MI AVG $5.6M
Rank #8 / 134
48.2%
Facility 48.2%
MI AVG 39%
Rank #45 / 134
235593
Qualicare Nursing Home
NH

Nursing Home Licensed facility providing 24/7 skilled nursing care for residents with complex, ongoing medical needs. Staffed by RNs, LPNs, and CNAs. Inspected and star-rated annually by CMS. Accepts Medicare (short-term rehab) and Medicaid (long-term care).

HC

Home Care Professional care delivered in the person's own home — from companionship and errands to skilled nursing and therapy. Allows seniors to age in place. Medicare covers skilled home health when medically necessary.

PC

Palliative Care

RC

Respite Care Short-term temporary care — days to weeks — to give family caregivers a break. Full care provided during the stay. Often used after hospitalization or to trial a facility before a permanent placement decision.

Detroit (Islandview)
96
Facility 96
MI AVG 75
Rank #143 / 435
94.1%
Facility 94.1%
MI AVG 75.8%
Rank #16 / 386
+24%
3.26
Facility 3.26
MI AVG 4.30
Rank #128 / 133
-14% -24%
$0
Facility $0
MI AVG $87.6k
Rank #1 / 136
15
Facility 15
MI AVG 33.5
Rank #24 / 135
2.5
Facility 2.5
MI AVG 5.2
Rank #9 / 135
1 93 A+
48
Facility 48
MI AVG 39
Rank #232 / 703
Carney Bradford
$19.3M
Facility $19.3M
MI AVG $15.8M
Rank #51 / 134
$6.6M
Facility $6.6M
MI AVG $5.6M
Rank #72 / 134
34.4%
Facility 34.4%
MI AVG 39%
Rank #103 / 134
235622
Westwood Nursing Center
NH

Nursing Home Licensed facility providing 24/7 skilled nursing care for residents with complex, ongoing medical needs. Staffed by RNs, LPNs, and CNAs. Inspected and star-rated annually by CMS. Accepts Medicare (short-term rehab) and Medicaid (long-term care).

NC

Nursing Care

Detroit (Harmony Village)
108
Facility 108
MI AVG 75
Rank #104 / 435
65.1%
Facility 65.1%
MI AVG 75.8%
Rank #138 / 386
-14%
3.15
Facility 3.15
MI AVG 4.30
Rank #130 / 133
-27% -27%
$45.9k
Facility $45.9k
MI AVG $87.6k
Rank #109 / 136
44
Facility 44
MI AVG 33.5
Rank #95 / 135
4.9
Facility 4.9
MI AVG 5.2
Rank #64 / 135
- 107 -
76
Facility 76
MI AVG 39
Rank #47 / 703
Amee Patel
$17.9M
Facility $17.9M
MI AVG $15.8M
Rank #58 / 134
$5.3M
Facility $5.3M
MI AVG $5.6M
Rank #95 / 134
29.7%
Facility 29.7%
MI AVG 39%
Rank #127 / 134
235444
The Orchards at Northwest
NH

Nursing Home Licensed facility providing 24/7 skilled nursing care for residents with complex, ongoing medical needs. Staffed by RNs, LPNs, and CNAs. Inspected and star-rated annually by CMS. Accepts Medicare (short-term rehab) and Medicaid (long-term care).

AL

Assisted Living A licensed, long-term care setting for seniors or individuals with disabilities who need help with daily activities — like bathing, dressing, and medication management — but not 24-hour skilled nursing. Offers housing, meals, and around-the-clock support while aiming to maximize resident independence.

MC

Memory Care Secured, specialized care for people living with Alzheimer's or dementia. Staff trained in cognitive impairment, with higher staff-to-resident ratios and an environment designed to reduce confusion and wandering risk.

RC

Respite Care Short-term temporary care — days to weeks — to give family caregivers a break. Full care provided during the stay. Often used after hospitalization or to trial a facility before a permanent placement decision.

Detroit (Hubbell-Puritan)
154
Facility 154
MI AVG 75
Rank #29 / 435
83.3%
Facility 83.3%
MI AVG 75.8%
Rank #59 / 386
+10%
3.79
Facility 3.79
MI AVG 4.30
Rank #90 / 133
-61% -12%
$15.9k
Facility $15.9k
MI AVG $87.6k
Rank #86 / 136
39
Facility 39
MI AVG 33.5
Rank #91 / 135
6.5
Facility 6.5
MI AVG 5.2
Rank #95 / 135
1 113 -
51
Facility 51
MI AVG 39
Rank #208 / 703
Northwest Opco Holdco LLC
$13.5M
Facility $13.5M
MI AVG $15.8M
Rank #86 / 134
$6.2M
Facility $6.2M
MI AVG $5.6M
Rank #79 / 134
46.3%
Facility 46.3%
MI AVG 39%
Rank #49 / 134
235539

Frequently Asked Questions about Westwood Nursing Center

What neighborhood is Westwood Nursing Center in?

Westwood Nursing Center is in the Harmony Village neighborhood of Detroit.

Is Westwood Nursing Center in a walkable area?

Westwood Nursing Center has a walk score of 76. Very walkable. Most errands can be accomplished on foot, and many essentials are within a short walk.

What is the occupancy rate at Westwood Nursing Center?

Westwood Nursing Center's occupancy is 65.1%.

Are there photos of Westwood Nursing Center?

Yes — there are 4 photos of Westwood Nursing Center in the photo gallery on this page.

What is the address of Westwood Nursing Center?

Westwood Nursing Center is located at 16588 Schaefer Highway, Detroit, MI 48235.

What is the phone number of Westwood Nursing Center?

(313) 345-5000 will put you in contact with the team at Westwood Nursing Center.

Is Westwood Nursing Center Medicare or Medicaid certified?

Yes — Westwood Nursing Center is a CMS-certified provider of Medicare and Medicaid.

Guides for Better Senior Living

Care Cost Calculator: See Prices in Your Area

Nursing Home Data Explorer

Don’t Wait Too Long: 7 Red Flag Signs Your Parent Needs Assisted Living Now

The True Cost of Assisted Living in 2025 – And How Families Are Paying For It

Understanding Senior Living Costs: Pricing Models, Discounts & Financial Assistance

Explore Open Rooms
1 Contact details
2 What type of senior care service are you looking for?
3 What budget do you have in mind for senior care?
4 How soon do you need to find care?
5 Additional details

Thank you for your interest!

Our team will be in touch shortly to help with next steps.