

Total health inspections
20
California average 12.5
Last Health inspection on Dec 2024

We arrange tours, appointments, and even moving support so you don’t have to

Located in Sacramento, California, Windsor Care Center of Sacramento is a distinguished provider of secured Alzheimer’s and dementia care, and has been recognized as a Best Memory Care Community by MemoryCare.com. Proudly standing as one of the two exclusive facilities in the area with a focus on specialized Alzheimer’s and dementia care, the center offers personalized nursing services tailored to the unique needs of those suffering from memory loss conditions. Their team of physicians and professionals closely monitor each resident, ensuring a high level of medical and nursing care, as well as assistance with daily activities such as feeding, bathing, dressing, and mobility support. Moreover, their experienced nurses specialize in diabetes management, providing comprehensive help with blood glucose monitoring, insulin administration, exercise planning, education, and more.
At Windsor Care Center, the rehabilitation team is adept at working with individuals experiencing progressive memory loss, aiming to achieve health goals efficiently. By collaborating with physical, occupational, and speech therapists, the center fosters independence and utilizes state-of-the-art equipment for optimal outcomes. Committed to compassionate, patient-centered care, Windsor Care Center of Sacramento strives to help residents regain their lives safely, making it a premier destination for secured Alzheimer’s and dementia care.
Suzanne Peck serves as the Administrator at Windsor Care Center of Sacramento, providing dedicated leadership to the community. She oversees daily operations to ensure a warm, supportive environment for residents and staff alike.
 Official CMS rating based on health inspections, staffing and quality measures.
Official CMS rating based on deficiencies found during state health inspections.
Official CMS rating based on nurse staffing hours per resident per day.
Official CMS rating based on clinical outcomes for residents.
Average daily nursing hours per resident (adjusted for acuity). Higher values indicate more nursing time per resident.
Official CMS rating based on health inspections, staffing and quality measures.
Official CMS rating based on deficiencies found during state health inspections.
Official CMS rating based on nurse staffing hours per resident per day.
Official CMS rating based on clinical outcomes for residents.
Average daily nursing hours per resident (adjusted for acuity). Higher values indicate more nursing time per resident.
Offers a balance of services and community atmosphere.
Occupancy is moderate, suggesting balanced demand.
This home supports both short-term rehab and long-term care, with residents staying for a wide range of durations.
13% of new residents, usually for short-term rehab.
45% of new residents, often for short stays.
42% of new residents, often for long-term daily care.
The portion of the home's budget spent on staff, including nurses, caregivers, and other employees who support care and operations.
All remaining costs needed to run the home, such as food, utilities, building maintenance, supplies and administrative expenses.
Nursing Home 24/7 care needed
Assisted Living For seniors needing help with daily tasks but not full-time nursing.
Nursing Home 24/7 care needed
Assisted Living For seniors needing help with daily tasks but not full-time nursing.
Nursing Home 24/7 care needed
Assisted Living For seniors needing help with daily tasks but not full-time nursing.
Nursing Home 24/7 care needed
Assisted Living For seniors needing help with daily tasks but not full-time nursing.
Nursing Home 24/7 care needed
Assisted Living For seniors needing help with daily tasks but not full-time nursing.
 Advanced Health Care of Sacramento
  Windsor Care Center of Sacramento
 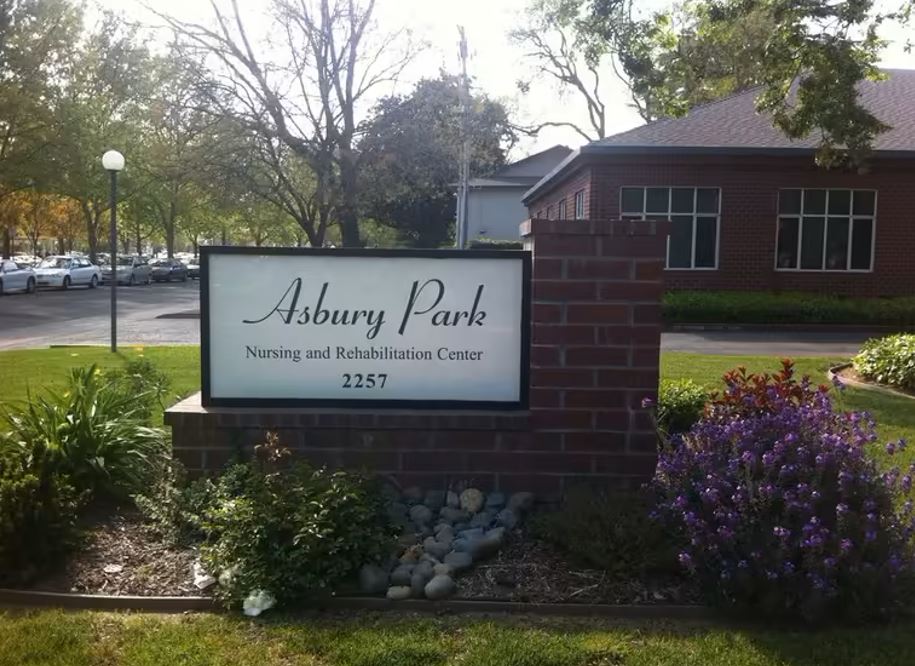 Asbury Park Nursing and Rehabilitation Center
![]() 5.1 miles from city center — 3.9 miles to nearest hospital (McClellan Outpatient Clinic - VA Northern California Health Care System)
5.1 miles from city center — 3.9 miles to nearest hospital (McClellan Outpatient Clinic - VA Northern California Health Care System)
![]() 501 Jessie Ave, Sacramento, CA 95838
501 Jessie Ave, Sacramento, CA 95838
Add your location
Source: CMS Payroll-Based Journal (Q2 2025)
| Role ⓘ | Count ⓘ | Avg Shift (hrs) ⓘ | Uses Contractors? ⓘ |
|---|---|---|---|
| Registered Nurse | 8 | 7.6 | No |
| Licensed Practical Nurse | 14 | 7.9 | No |
| Certified Nursing Assistant | 42 | 7.5 | No |
| Role ⓘ | Employees ⓘ | Contractors ⓘ | Total Staff ⓘ | Total Hours ⓘ | Days Worked ⓘ | % of Days ⓘ | Avg Shift (hrs) ⓘ |
|---|---|---|---|---|---|---|---|
| Certified Nursing Assistant | 42 | 0 | 42 | 4,341 | 31 | 100% | 7.5 |
| Licensed Practical Nurse | 14 | 0 | 14 | 1,461 | 31 | 100% | 7.9 |
| Registered Nurse | 8 | 0 | 8 | 1,210 | 31 | 100% | 7.6 |
| Other Dietary Services Staff | 5 | 0 | 5 | 733 | 31 | 100% | 7.8 |
| RN Director of Nursing | 3 | 0 | 3 | 493 | 23 | 74% | 7.9 |
| Dental Services Staff | 2 | 0 | 2 | 369 | 23 | 74% | 8 |
| Nurse Practitioner | 1 | 0 | 1 | 184 | 23 | 74% | 8 |
| Administrator | 1 | 0 | 1 | 176 | 22 | 71% | 8 |
| Clinical Nurse Specialist | 1 | 0 | 1 | 85 | 14 | 45% | 6 |
| Occupational Therapy Aide | 1 | 0 | 1 | 46 | 7 | 23% | 6.6 |
| Medical Director | 0 | 1 | 1 | 13 | 5 | 16% | 2.5 |
| Occupational Therapy Assistant | 0 | 1 | 1 | 6 | 2 | 6% | 3 |
California average 12.5
Last Health inspection on Dec 2024
Health citations are formal notices following inspections when they fail to comply with safety and care standards.
41 of 60 citations resulted from standard inspections; and 19 of 60 resulted from complaint investigations.
California average: 0.4
California average: 1
Data sourced from CMS Health Deficiencies reports. Citation severity codes range from A (least serious) to L (most serious). Immediate Jeopardy (J-L) citations indicate situations where the facility's noncompliance has placed residents at risk of death or serious harm.
Source: CMS Long-Term Care Facility Characteristics (Data as of Jan 2026)
Active councils help families stay involved in care decisions and facility operations.
These measures show how residents usually do over time at this home, based on health outcomes and preventive care.
California average: 6.6
California average: 11.3
California average: 11.1%
California average: 12.0%
California average: 11.3%
California average: 1.7%
California average: 5.0%
California average: 1.2%
California average: 4.2%
California average: 6.7%
California average: 10.1%
California average: 98.5%
California average: 98.2%
California average: 2.25
California average: 1.59
California average: 94.0%
California average: 1.5%
Quality measures are calculated from Minimum Data Set (MDS) assessments. For most measures, lower percentages indicate better care quality.
Historical financial and operational data for Windsor Care Center of Sacramento based on CMS SNF Cost Reports.
Loading trend charts...
Care Cost Calculator: See Prices in Your Area
Nursing Home Data Explorer
Don’t Wait Too Long: 7 Red Flag Signs Your Parent Needs Assisted Living Now
The True Cost of Assisted Living in 2025 – And How Families Are Paying For It
Understanding Senior Living Costs: Pricing Models, Discounts & Financial Assistance

We help families find affordable senior communities and unlock same day discounts, Medicaid, and Medicare options tailored to your needs.
Contact us Today
Touring a community? Use this expert-backed checklist to stay organized, ask the right questions, and find the perfect fit.
We'll send you a PDF version of the touring checklist.


