Windsor Care Center of Sacramento
Nursing Home & Assisted Living · Sacramento, CA
CMS overall rating Info CMS (the Centers for Medicare & Medicaid Services) is the federal agency that rates nursing home quality. Its Overall Rating runs from 1 to 5 stars, combining health inspections, staffing, and quality measures, with inspections weighted most heavily.

Windsor Care Center of Sacramento

Nursing Home & Assisted Living · Sacramento, CA
CMS overall rating Info CMS (the Centers for Medicare & Medicaid Services) is the federal agency that rates nursing home quality. Its Overall Rating runs from 1 to 5 stars, combining health inspections, staffing, and quality measures, with inspections weighted most heavily.
Calculator: See prices in your area
Windsor Care Center of Sacramento accepts Medicare, Medicaid, and private pay.

Overview of Windsor Care Center of Sacramento

Located in Sacramento, California, Windsor Care Center of Sacramento is a distinguished provider of secured Alzheimer’s and dementia care, and has been recognized as a Best Memory Care Community by MemoryCare.com. Proudly standing as one of the two exclusive facilities in the area with a focus on specialized Alzheimer’s and dementia care, the center offers personalized nursing services tailored to the unique needs of those suffering from memory loss conditions. Their team of physicians and professionals closely monitor each resident, ensuring a high level of medical and nursing care, as well as assistance with daily activities such as feeding, bathing, dressing, and mobility support. Moreover, their experienced nurses specialize in diabetes management, providing comprehensive help with blood glucose monitoring, insulin administration, exercise planning, education, and more.
At Windsor Care Center, the rehabilitation team is adept at working with individuals experiencing progressive memory loss, aiming to achieve health goals efficiently. By collaborating with physical, occupational, and speech therapists, the center fosters independence and utilizes state-of-the-art equipment for optimal outcomes. Committed to compassionate, patient-centered care, Windsor Care Center of Sacramento strives to help residents regain their lives safely, making it a premier destination for secured Alzheimer’s and dementia care.

Quality ratings

Measured by Centers for Medicare & Medicaid Services (CMS)

Overall rating Info The Overall CMS Rating combines results from health inspections, staffing levels and quality measures. Health inspections carry the most weight. Staffing and quality scores can increase or decrease the final rating based on performance compared to state and national standards.
▼ 4.7% Below CA avg. ▼ 4.7% Below CA avg.CA average: 3.1Click the badge to see the full State ranking.Click here to see the full State ranking.
Health Inspection Info Based on the results of the facility's three most recent standard inspections and any complaint investigations. CMS reviews the number, scope, and severity of deficiencies, with more recent findings weighted more heavily.
▼ 28.5% Below CA avg. ▼ 28.5% Below CA avg.CA average: 2.8Click the badge to see the full State ranking.Click here to see the full State ranking.
Staffing Info Measures average nursing staff hours per resident per day, including Registered Nurses (RNs) and total nursing staff. Ratings are adjusted based on the level of care residents require and are compared to state and national benchmarks.
▲ 59.3% Above CA avg. ▲ 59.3% Above CA avg.CA average: 3.1Click the badge to see the full State ranking.Click here to see the full State ranking.
Quality Measures Info Based on clinical and physical health indicators reported to CMS, such as hospital readmissions, falls, pressure ulcers, and improvements in mobility. These measures reflect how well residents' health needs are being managed.
▲ 22.4% Above CA avg. ▲ 22.4% Above CA avg.CA average: 4.1Click the badge to see the full State ranking.Click here to see the full State ranking.

Staffing hours breakdown

Info Daily nursing hours per resident by staff type, reported to CMS. Higher is generally better — compare this facility to state and national averages to see where staffing stands.

Hours per resident per day — compared to California state averages

Total nursing care / resident Info This home is ranked 5th out of 354 homes in California for nurse hours. Total adjusted nursing hours per resident per day, combining RN, LPN, and aide time. CMS adjusts this for case-mix so facilities can be fairly compared.
6h 44m per day
Rank #5 / 354Nurse hours — State benchmarkedThis home is ranked 5th out of 354 homes in California. Shows adjusted nurse hours per resident per day benchmarked to the California average, with a ranking across 354 California facilities. More hours mean more direct care. The national average is about 3.5 hrs; below 3.0 is a red flag.Rankings are based only on facilities in California that report data for that category. Facilities without available data are excluded from the ranking.Click the rank badge to see the full State ranking.Click here to see the full State ranking.
This facility California avg (4h 13m per day)
vs California avg
+59%

0 of 1 metrics below state avg

Standout metric Weekend Total Nursing is +12% above state avg
Staff typeHours / Day / Residentvs state avg
Weekend Total Nursing Info Combined nursing hours (RN + LPN + Nurse Aide) per resident per day on weekends. Staffing often drops on weekends — this figure reveals whether the facility maintains adequate coverage outside of weekday hours. 4h 35m per day ▲ 12% State avg: 4h 5m per day · National avg: 3h 26m per day

Capacity and availability

This home is often near full

Higher occupancy than the California average: 84.7%
Occupancy rate
97.7% Rank #161 / 1537Occupancy rate — State benchmarkedThis home is ranked 161st out of 1537 homes in California. Shows this facility's occupancy rate versus the California average, with its Statewide rank out of 1537. Higher occupancy signals strong local demand and financial stability.Rankings are based only on facilities in California that report data for that category. Facilities without available data are excluded from the ranking.Click the rank badge to see the full State ranking.Click here to see the full State ranking.
Avg. Length of Stay
111 days
Bed community size
128-bed community Rank #506 / 1657Bed count — State benchmarkedThis home is ranked 506th out of 1657 homes in California. Shows this facility's certified or reported bed count compared to other California facilities. Larger communities may offer more amenities, programs, and on-site services for residents and families.Rankings are based only on facilities in California that report data for that category. Facilities without available data are excluded from the ranking.Click the rank badge to see the full State ranking.Click here to see the full State ranking.
A larger shared setting that may offer more common spaces and organized community services.
Years in operation
28 years in operation Rank #158 / 1487Years in operation — State benchmarkedThis home is ranked 158th out of 1487 homes in California. Shows how long this facility has been in operation compared to other California facilities. Longer operating histories may benefit residents, families, and staff.Rankings are based only on facilities in California that report data for that category. Facilities without available data are excluded from the ranking.Click the rank badge to see the full State ranking.Click here to see the full State ranking.
A longer operating history, which may indicate experience navigating regulations and delivering ongoing care.
Walk Score
Walk Score: 60 / 100 Rank #1050 / 2092Walk Score — State benchmarkedThis home is ranked 1050th out of 2092 homes in California. Shows how walkable this facility's neighborhood is compared to the average Walk Score across California facilities. Higher scores benefit residents, families, and staff.Rankings are based only on facilities in California that report data for that category. Facilities without available data are excluded from the ranking.Click the rank badge to see the full State ranking.Click here to see the full State ranking.
Moderately walkable. Some errands can be accomplished on foot, with a mix of nearby amenities.

About this community

License Details

Status2003-05-14t00:00:00z
CMS Certification Number555717

Staffing

Key information about the people who lead and staff this community.

Leadership

ContactMrs. Sally Rapp, CEO

Amenities & Lifestyle

Specific ProgramsProgram Goals
Touring HoursVisitors are welcome every day of the week.

Contact Windsor Care Center of Sacramento

Inspection History

In California, the Department of Social Services (for assisted living facilities) and the Department of Public Health (for nursing homes) conduct inspections to ensure resident safety and regulatory compliance.

Health Inspection History

Inspections since 2021
Total health inspections 20

California average 12.5


Last Health inspection on Dec 2024
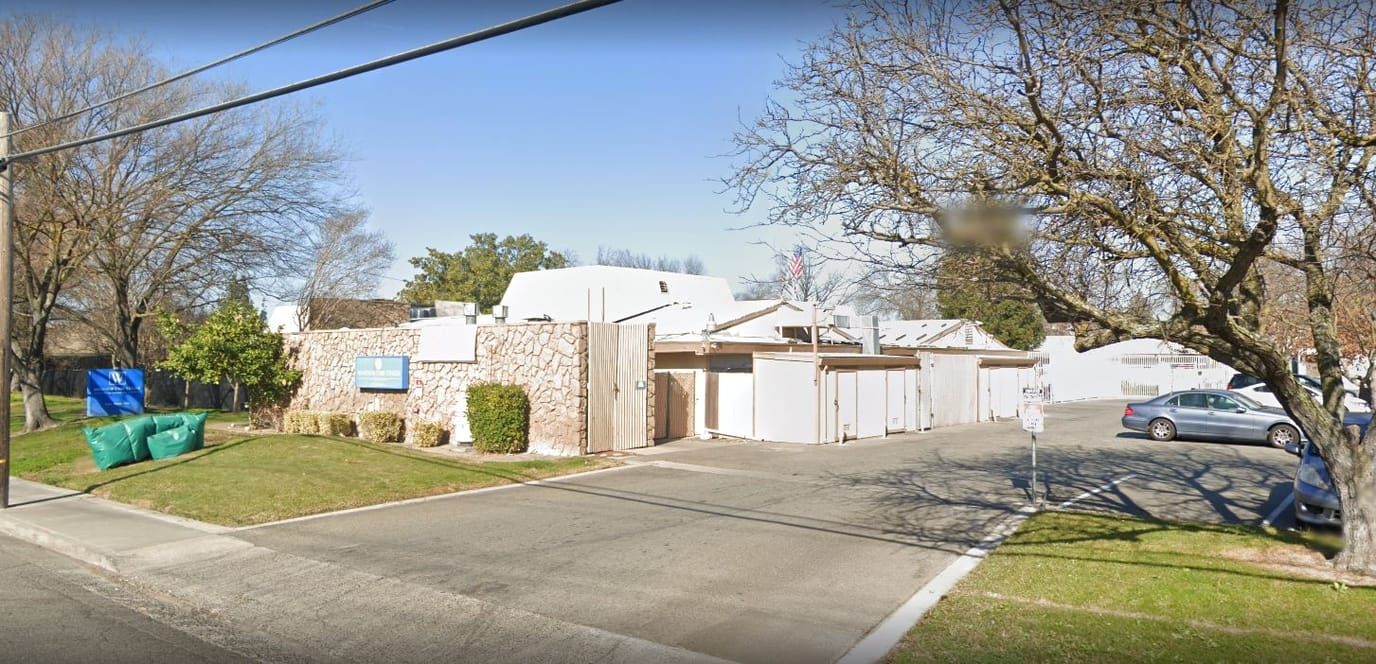
Total health citations
60 Rank #271 / 361Health citations — State benchmarkedThis home is ranked 271st out of 361 homes in California. Shows this facility's total health deficiency citations benchmarked to the California State average, with a ranking across all 361 CA facilities. Lower citation counts earn a better rank.Rankings are based only on facilities in California that report data for that category. Facilities without available data are excluded from the ranking.Click the rank badge to see the full State ranking.Click here to see the full State ranking.

California average 50.2

Citations per inspection
3 Rank #65 / 361Citations per inspection — State benchmarkedThis home is ranked 65th out of 361 homes in California. Shows average deficiency citations per CMS inspection for this facility versus the California mean across 361 facilities with citation data. Lower is better.Rankings are based only on facilities in California that report data for that category. Facilities without available data are excluded from the ranking.Click the rank badge to see the full State ranking.Click here to see the full State ranking.

California average 4.65


Health citations are formal notices following inspections when they fail to comply with safety and care standards.

41 of 60 citations resulted from standard inspections; and 19 of 60 resulted from complaint investigations.

Breakdown of citation severity (last 5 years)
Critical health citations
0
100% better than California average

California average: 0.4


Serious health citations
1
In line with California average

California average: 1

0 critical citations California average: 0.4

1 serious citation California average: 1

59 moderate citations California average: 47.2

0 minor citations California average: 1.5
Citations history (last 5 years)
Abuse/Neglect moderate citation Dec 20, 2024
Corrected

Environmental moderate citation Dec 20, 2024
Corrected

Infection Control moderate citation Dec 20, 2024
Corrected

Nursing Services moderate citation Dec 20, 2024
Corrected

Staffing Data

Reporting period: April 1 – June 30, 2025 (Q2 2025). Source: CMS Payroll-Based Journal report.

Total staff 80
Employees 78
Contractors 2
Staff to resident ratio 0.74 : 1
59% fewer staff per resident than California average
California average ratio: 1.81 : 1 California average ratio: 1.81 : 1See full California ranking
Avg staff/day 39
Average shift 7.5 hours
0% compared with California average
California average: 7.7 hours California average shift: 7.7 hoursSee full California ranking
Total staff hours (quarter) 9,117

Nursing staff breakdown

Q2 2025 · Apr 1 – Jun 30 More info This data comes from the CMS Payroll-Based Journal report covering April 1 – June 30, 2025.
Registered Nurse

Manages medical care and health needs.

RN Staff Info All 8 RN Staff are full-time employees. No contractors work on this role. 8
Average shift length Info Average shift length. Calculated as total hours divided by days worked and average staff per day. 7.6 hours
Licensed Practical Nurse

Assists with medical care and medications.

LPN Staff Info All 14 LPN Staff are full-time employees. No contractors work on this role. 14
Average shift length Info Average shift length. Calculated as total hours divided by days worked and average staff per day. 7.9 hours
Certified Nursing Assistant

Helps with daily care and mobility.

CNA Staff Info All 42 CNA Staff are full-time employees. No contractors work on this role. 42
Average shift length Info Average shift length. Calculated as total hours divided by days worked and average staff per day. 7.5 hours

Contractor staffing

Q2 2025 · Apr 1 – Jun 30 More info This data comes from the CMS Payroll-Based Journal report covering April 1 – June 30, 2025.

Total hours from contractors

0.2%

19 contractor hours this quarter

Medical Director: 1 Occupational Therapy Assistant: 1

Staff by category

Q2 2025 · Apr 1 – Jun 30 More info This data comes from the CMS Payroll-Based Journal report covering April 1 – June 30, 2025.
Certified Nursing Assistant420424,34131100%7.5
Licensed Practical Nurse140141,46131100%7.9
Registered Nurse8081,21031100%7.6
Other Dietary Services Staff50573331100%7.8
RN Director of Nursing3034932374%7.9
Dental Services Staff2023692374%8
Nurse Practitioner1011842374%8
Administrator1011762271%8
Clinical Nurse Specialist101851445%6
Occupational Therapy Aide10146723%6.6
Medical Director01113516%2.5
Occupational Therapy Assistant011626%3
42 Certified Nursing Assistant
% of Days 100%
14 Licensed Practical Nurse
% of Days 100%
8 Registered Nurse
% of Days 100%
5 Other Dietary Services Staff
% of Days 100%
3 RN Director of Nursing
% of Days 74%
2 Dental Services Staff
% of Days 74%
1 Nurse Practitioner
% of Days 74%
1 Administrator
% of Days 71%
1 Clinical Nurse Specialist
% of Days 45%
1 Occupational Therapy Aide
% of Days 23%
1 Medical Director
% of Days 16%
1 Occupational Therapy Assistant
% of Days 6%

Penalties and fines

Federal penalties imposed by CMS for regulatory violations, including civil money penalties (fines) and denials of payment for new Medicare/Medicaid admissions.

Source: CMS Penalties Database

No penalties in the past 3 years

No civil money penalties or payment denials were reported in the last 3 years.

Quality of care over time

These measures show how residents usually do over time at this home, based on health outcomes and preventive care.

High-risk clinical events score Info A composite score based on pressure ulcers, falls with injury, weight loss, walking ability decline, and activities of daily living decline. 4.4
34% better than California average

California average: 6.6

Functional decline score Info A composite score based on activities of daily living decline, walking ability decline, and incontinence. 3.3
71% better than California average

California average: 11.3

Long-stay resident measures
Significantly above average California avg: 4.2 Info CMS star rating based on long-stay quality measure performance. 5 stars = significantly above average, 1 star = significantly below average.
Need for Help with Daily Activities Increased Info Percent of long-stay residents whose need for help with daily activities has increased 3.4%
69% better than California average

California average: 11.1%

Walking Ability Worsened Info Percent of long-stay residents whose ability to move independently worsened 5.4%
55% better than California average

California average: 12.0%

Low Risk Residents with Bowel/Bladder Incontinence Info Percent of low risk long-stay residents who lose control of their bowels or bladder 1.0%
91% better than California average

California average: 11.3%

Falls with Major Injury Info Percent of long-stay residents experiencing one or more falls with major injury 6.0%
259% worse than California average

California average: 1.7%

High Risk Residents with Pressure Ulcers Info Percent of long-stay high risk residents with pressure ulcers 1.7%
65% better than California average

California average: 5.0%

Urinary Tract Infection Info Percent of long-stay residents with a urinary tract infection 1.6%
25% worse than California average

California average: 1.2%

Lost Too Much Weight Info Percent of long-stay residents who lose too much weight 5.6%
32% worse than California average

California average: 4.2%

Depressive Symptoms Info Percent of long-stay residents who have depressive symptoms 0.0%
100% better than California average

California average: 6.7%

Antipsychotic Use Info Percent of long-stay residents who received an antipsychotic medication 17.8%
77% worse than California average

California average: 10.1%

Pneumococcal Vaccine Info Percent of long-stay residents assessed and appropriately given the pneumococcal vaccine 96.6%
In line with California average

California average: 98.5%

Influenza Vaccine Info Percent of long-stay residents assessed and appropriately given the seasonal influenza vaccine 86.1%
12% worse than California average

California average: 98.2%

Hospitalizations per 1,000 days Info Number of hospitalizations per 1,000 long-stay resident days. 0.80
64% better than California average

California average: 2.25

ED visits per 1,000 days Info Number of outpatient emergency department visits per 1,000 long-stay resident days. 0.76
52% better than California average

California average: 1.59

Short-stay resident measures
Pneumococcal Vaccine Info Percent of short-stay residents assessed and appropriately given the pneumococcal vaccine 93.6%
In line with California average

California average: 94.0%

Antipsychotic medication increase Info Percent of short-stay residents who newly received an antipsychotic medication 6.7%
360% worse than California average

California average: 1.5%

Breakdown by payment type

Medicare

13% of new residents, usually for short-term rehab.

Typical stay 20 days

Private pay

45% of new residents, often for short stays.

Typical stay 1 - 2 months

Medicaid

42% of new residents, often for long-term daily care.

Typical stay 12 months

Facility Characteristics

Source: CMS Long-Term Care Facility Characteristics (Data as of Jan 2026)

Total residents 108
Medicare
1
0.9% of residents
Medicaid
106
98.1% of residents
Private pay or other
1
0.9% of residents
Programs & Services
Residents Group

Residents meet regularly to discuss policies, care quality, and activities

Active Resident Council

Organized group of residents that meets regularly to discuss facility policies, quality of life, and activities.

Finances and operations

Based on CMS SNF Cost Report for fiscal year ending in 12/2023.

For-profit
Operated by a single business entity.
Net patient revenue Info Net patient revenue — what the home actually collects for resident care, after contractual allowances, bad debt and discounts are subtracted from its gross charges (CMS cost report, Worksheet G-3). It covers resident care only; money the home earns from other sources is shown separately as "Other income."
$13.1M
Net patient income Info Net patient income: net patient revenue minus the home's total operating expenses. A positive figure means it earns more from resident care than it spends to deliver it; a negative figure means the opposite. It excludes non-operating "other income."
-$1.4M
For-profit Operated by a single business entity.
Net patient revenue Info Net patient revenue — what the home actually collects for resident care, after contractual allowances, bad debt and discounts are subtracted from its gross charges (CMS cost report, Worksheet G-3). It covers resident care only; money the home earns from other sources is shown separately as "Other income."
$13.1M Rank #211 / 355Revenue — State benchmarkedThis home is ranked 211th out of 355 homes in California. Shows this facility's annual revenue compared to the California average. Higher revenue generally means more resources for staffing and capital — read alongside Payroll %.Rankings are based only on facilities in California that report data for that category. Facilities without available data are excluded from the ranking.Click the rank badge to see the full State ranking.Click here to see the full State ranking.
Net patient income Info Net patient income: net patient revenue minus the home's total operating expenses. A positive figure means it earns more from resident care than it spends to deliver it; a negative figure means the opposite. It excludes non-operating "other income."
-$1.4M
Other income Info Money the home earns outside of resident care — such as investments, grants, rentals and other non-operating sources (CMS cost report, Worksheet G-3). It is tracked separately from net patient revenue: it is not part of that figure, and it is not included in net patient income.
$176.0K
Payroll costs Info Staff salaries plus wage-related costs — benefits such as payroll taxes, health insurance and retirement — from the home's own accounting records (CMS cost report, Worksheet A). Contract or agency labor is counted separately, under other operating costs. Rank #196 / 355Payroll — State benchmarkedThis home is ranked 196th out of 355 homes in California. Shows total annual staff payroll benchmarked to the California average. Higher payroll investment relative to peers often signals better staffing and less reliance on cheaper contract labor.Rankings are based only on facilities in California that report data for that category. Facilities without available data are excluded from the ranking.Click the rank badge to see the full State ranking.Click here to see the full State ranking.
$7.5M 57.2% of net patient revenue Info Payroll as a share of revenue: staff salaries and wage-related benefits divided by net patient revenue. A higher figure means more of each revenue dollar goes to staff pay. Rank #136 / 355Payroll % — State benchmarkedThis home is ranked 136th out of 355 homes in California. Shows payroll as a percentage of revenue versus the California average. Well-run California facilities typically land around 55–67% — the top third Statewide. Below 25% may signal understaffing or heavy agency use — read with Staffing ratings.Rankings are based only on facilities in California that report data for that category. Facilities without available data are excluded from the ranking.Click the rank badge to see the full State ranking.Click here to see the full State ranking.
Other operating costs Info Everything it costs to run the home apart from payroll — food, utilities, supplies, maintenance, contract labor and administration. Calculated as total operating expense minus payroll (staff salaries and wage-related benefits).
$7.0M
Total costs Info The home's total operating expense for the year — all the costs of running it, salaries included (CMS cost report, Worksheet G-3).
$14.5M

Who this home usually serves

TYPE OF STAY

Mix of rehab and long-term care

This home supports both short-term rehab and long-term care, with residents staying for a wide range of durations.

New residents most often arrive under private pay (45% of admissions), and a typical private pay stay runs around 1 - 2 months.

Admissions
225 total

Coverage residents most often arrive under.

Medicare 13%
Private pay 45%
Medicaid 42%
Discharges
367 total

Coverage residents most often leave under.

Medicare 4%
Private pay 24%
Medicaid 73%

Managed by Suzanne Peck

Administrator

Places of interest near Windsor Care Center of Sacramento

Address 5.1 miles from city center Info Estimated distance in miles from Sacramento's city center to Windsor Care Center of Sacramento's address, calculated via Google Maps.

Calculate Travel Distance to Windsor Care Center of Sacramento

Add your location

Address

Financial Assistance for
Nursing Home in California

Windsor Care Center of Sacramento is located in Sacramento, California.
Here are the financial assistance programs available to residents in California.

Get Financial aid guidance

Multipurpose Senior Services Program

MSSP (Medi-Cal Waiver)

Age 65+
General California resident, Medi-Cal eligible, nursing home risk.
Income Limits (2025) ~$2,829/month 300% FBR, individual
Asset Limits $2,000 (individual), $3,000 (couple).
CA

County-managed; waitlists possible.

Benefits
In-home support (4-6 hours/day) Respite care (14 days/year) Meals (~$6/meal) Transportation (8 trips/month) Care management

In-Home Supportive Services (IHSS)

California IHSS

Age 65+
General California resident, Medicaid-eligible or low-income.
Income Limits ~$1,732/month individual, Medi-Cal threshold
Asset Limits $2,000 individual
CA

Can hire family as caregivers.

Benefits
Personal care (up to 283 hours/month) Homemaker services Respite (varies)

Multipurpose Senior Services Program (MSSP)

CA MSSP

Age 65+
General California resident, Medi-Cal-eligible, nursing home-eligible but community-capable.
Income Limits ~$2,829/month 300% FBR, individual
Asset Limits $2,000 individual
CA

Available in 38 counties; waitlists common.

Benefits
Case management Respite care (up to 10 days/year) Minor home mods (avg. $500) Adult day care (~$50/day)

Property Tax Postponement Program (PTP)

CA PTP

Age 62+
General California resident, own and live in home, 40% equity.
Income Limits (2025) ~$51,500/year household, adjusted annually
Asset Limits Equity-based; no strict asset cap.
CA

Deferred taxes accrue interest (5% as of 2024); repaid upon sale/death.

Benefits
Property tax deferral (avg. $1,000-$3,000/year, varies by county)

Assisted Living Waiver (ALW)

CA ALW

Age 65+ or disabled
General California resident, Medi-Cal-eligible, nursing home-eligible.
Income Limits ~$2,829/month 300% FBR, individual
Asset Limits $2,000 individual
CA

Available in 15 counties (e.g., LA, Sacramento); waitlists common.

Benefits
Personal care in ALFs (5-7 hours/day) Medication management Social services

California CARES Program

CA CARES

Age
General Caregivers of California residents 60+ needing help with 3+ daily activities; no caregiver age limit.
Income Limits No strict limit; cost-sharing above ~$2,500/month threshold.
Asset Limits Not applicable; need-based.
CA

High demand in urban areas; complements IHSS respite.

Benefits
Respite care (up to 10 days/year) Counseling (4-6 sessions/year) Training (2-3 workshops/year) Supplies (~$200/year)

Frequently Asked Questions about Windsor Care Center of Sacramento

What neighborhood is Windsor Care Center of Sacramento in?

Windsor Care Center of Sacramento is in the North Sacramento neighborhood of Sacramento.

Is Windsor Care Center of Sacramento in a walkable area?

Windsor Care Center of Sacramento has a walk score of 60. Moderately walkable. Some errands can be accomplished on foot, with a mix of nearby amenities.

What is the occupancy rate at Windsor Care Center of Sacramento?

Windsor Care Center of Sacramento's occupancy is 87.4%.

Does Windsor Care Center of Sacramento operate as a for-profit or non-profit?

Windsor Care Center of Sacramento is registered as a for-profit in CA.

Are there photos of Windsor Care Center of Sacramento?

Yes — there is 1 photo of Windsor Care Center of Sacramento in the photo gallery on this page.

What is the address of Windsor Care Center of Sacramento?

Windsor Care Center of Sacramento is located at 501 Jessie Ave, Sacramento, CA 95838.

What is the phone number of Windsor Care Center of Sacramento?

(916) 922-8855 will put you in contact with the team at Windsor Care Center of Sacramento.

Guides for Better Senior Living

Care Cost Calculator: See Prices in Your Area

Nursing Home Data Explorer

Don’t Wait Too Long: 7 Red Flag Signs Your Parent Needs Assisted Living Now

The True Cost of Assisted Living in 2025 – And How Families Are Paying For It

Understanding Senior Living Costs: Pricing Models, Discounts & Financial Assistance