


Total health inspections
8
State average 12.5
Last Health inspection on Apr 2025
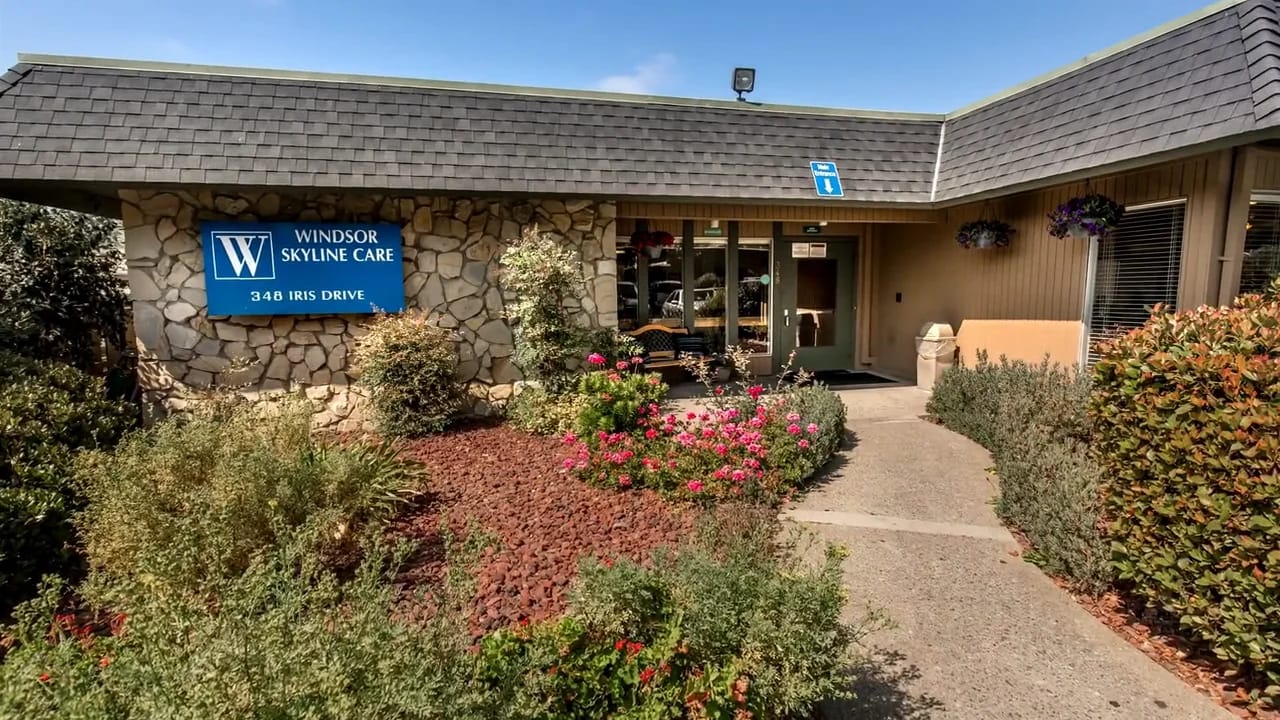
Windsor Skyline Care Center provides skilled nursing, hospice, respite, and memory care services in Salinas, California. Operating for more than three decades, the 80-bed community accepts Medicare, Medicaid, and private-pay residents, offering several payment options for families seeking care.
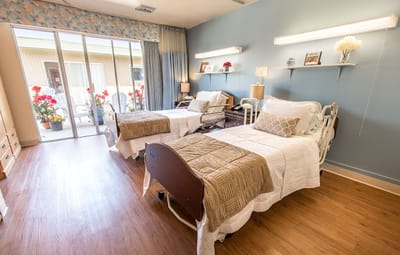
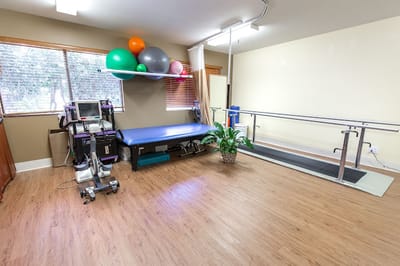
Residents receive support through post-acute nursing services, medication management, therapy programs, laboratory services, and individualized nutrition and hydration plans developed with oversight from a certified dietitian. Daily care also includes assistance with bowel and bladder management. Nursing staff provide an average of 4 hours and 14 minutes of care per resident each day, reflecting a substantial level of clinical support.
Memory care services are available for older adults living with Alzheimer’s disease and other forms of dementia. Safety measures include a wander guard system designed to help protect residents who may be at risk of leaving supervised areas. Current occupancy is approximately 75%, and the average stay is 81 days, indicating a mix of short-term rehabilitation and ongoing care needs.
The community is located in the Laurel West area of Salinas, where a Walk Score of 63 allows some errands and services to be reached on foot. This balance can be convenient for both residents and visiting family members.
| Staff type | Hours / Day / Resident | vs state avg |
|---|---|---|
|
Registered Nurse (RN)
| 28m per day | ▼ 29% State avg: 39m per day · National avg: 41m per day |
|
LPN / LVN
| 57m per day | ▼ 23% State avg: 1h 13m per day · National avg: 52m per day |
|
Nurse Aide
| 2h 27m per day | ▼ 7% State avg: 2h 38m per day · National avg: 2h 20m per day |
|
Weekend Total Nursing
| 3h 37m per day | ▼ 11% State avg: 4h 5m per day · National avg: 3h 26m per day |
|
Physical Therapist
| 5m per day | ▼ 4% State avg: 5m per day · National avg: 4m per day |
|
Weekend RN
| 19m per day | ▼ 36% State avg: 30m per day · National avg: 28m per day |
Key information about the people who lead and staff this community.
In California, the Department of Social Services (for assisted living facilities) and the Department of Public Health (for nursing homes) conduct inspections to ensure resident safety and regulatory compliance.
8 points below the California average for nursing homes (81/100)
Rank #1022 / 1400 in California Inspection Score — State benchmarked This home is ranked 1022nd out of 1400 homes in California for inspection score. Shows this facility's inspection score compared to the California average among 1400 comparable communities in the ranking pool. Facilities with the same value for a metric share the same rank. Rankings are based only on facilities in California that report data for that category. Facilities without available data are excluded from the ranking. This is a proprietary Assisted Living Magazine score. Inspection score: 73 out of 100. Letter grade C. 8 points below the California average for nursing homes (81/100)
Citations
| This Facility | CA Average | vs. CA Avg |
|---|---|---|---|
|
Total citations
| 41 | 10 | This facility has 310% more total citations than a typical California nursing home (41 vs. CA avg 10).↑ 310% worse |
|
Citations per inspection
| 5.1 | 3.3 | This facility has 55% more citations per inspection than a typical California nursing home (5.1 vs. CA avg 3.3).↑ 55% worse |
Inspections & Visits
| This Facility | CA Average | vs. CA Avg |
|---|---|---|---|
|
Total visits
| 5 | 16 | This facility has 69% fewer total visits than a typical California nursing home (5 vs. CA avg 16).↓ 69% better |
|
Complaint visits
| 5 | 13 | This facility has 62% fewer complaint visits than a typical California nursing home (5 vs. CA avg 13).↓ 62% better |
|
Other visits
| 0 | 7 | This facility has 100% fewer other visits than a typical California nursing home (0 vs. CA avg 7).↓ 100% better |
State average 12.5
Last Health inspection on Apr 2025
State average 50.2
State average 4.65
Health citations are formal notices following inspections when they fail to comply with safety and care standards.
34 of 41 citations resulted from standard inspections; 6 of 41 resulted from complaint investigations; and 1 of 41 came from combined inspections (standard and complaint).
State average: 0.4
State average: 1
Reporting period: October 1 – December 31, 2025 (Q4 2025). Source: CMS Payroll-Based Journal report.
Manages medical care and health needs.
Assists with medical care and medications.
Helps with daily care and mobility.
Total hours from contractors
2,520 contractor hours this quarter
| Certified Nursing Assistant | 56 | 0 | 56 | 15,943 | 92 | 100% | 7.4 |
| Licensed Practical Nurse | 19 | 0 | 19 | 5,095 | 92 | 100% | 7.4 |
| Registered Nurse | 7 | 0 | 7 | 2,089 | 92 | 100% | 7 |
| Other Dietary Services Staff | 5 | 0 | 5 | 1,384 | 92 | 100% | 6.5 |
| RN Director of Nursing | 3 | 0 | 3 | 1,016 | 69 | 75% | 7.9 |
| Speech Language Pathologist | 0 | 4 | 4 | 599 | 70 | 76% | 7.7 |
| Respiratory Therapy Technician | 0 | 3 | 3 | 519 | 73 | 79% | 6.8 |
| Nurse Practitioner | 1 | 0 | 1 | 488 | 61 | 66% | 8 |
| Physical Therapy Assistant | 0 | 7 | 7 | 457 | 64 | 70% | 6.6 |
| Administrator | 1 | 0 | 1 | 456 | 57 | 62% | 8 |
| Mental Health Service Worker | 1 | 0 | 1 | 456 | 57 | 62% | 8 |
| Clinical Nurse Specialist | 1 | 0 | 1 | 437 | 55 | 60% | 7.9 |
| Therapeutic Recreation Specialist | 0 | 1 | 1 | 398 | 57 | 62% | 7 |
| Occupational Therapy Aide | 0 | 1 | 1 | 218 | 28 | 30% | 7.8 |
| Physical Therapy Aide | 0 | 3 | 3 | 172 | 34 | 37% | 4.8 |
| Qualified Social Worker | 0 | 4 | 4 | 90 | 40 | 43% | 2.2 |
| Occupational Therapy Assistant | 0 | 1 | 1 | 37 | 7 | 8% | 5.3 |
| Medical Director | 0 | 1 | 1 | 30 | 16 | 17% | 1.9 |
Includes penalties issued in 2025
Federal penalties imposed by CMS for regulatory violations, including civil money penalties (fines) and denials of payment for new Medicare/Medicaid admissions.
Source: CMS Penalties Database (Data as of Jan 2026)
California average: $55K
California average: 2.4
California average: 0.5
Penalties are imposed by CMS for violations of federal nursing home regulations.
1 penalty in the past 3 years
Mar 14, 2025 · $64K
Last updated: Jan 2026
These measures show how residents usually do over time at this home, based on health outcomes and preventive care.
California average: 6.6
California average: 11.3
California average: 11.1%
California average: 12.0%
California average: 11.3%
California average: 1.7%
California average: 5.0%
California average: 1.2%
California average: 4.2%
California average: 6.7%
California average: 10.1%
California average: 98.5%
California average: 98.2%
California average: 2.25
California average: 1.59
California average: 94.0%
California average: 1.5%
California average: 93.2%
California average: 23.2%
California average: 11.2%
California average: 0.8%
California average: 53.7%
California average: 50.6%
Quality measures are calculated from Minimum Data Set (MDS) assessments. For most measures, lower percentages indicate better care quality.
39% of new residents, usually for short-term rehab.
22% of new residents, often for short stays.
39% of new residents, often for long-term daily care.
Source: CMS Long-Term Care Facility Characteristics (Data as of Jan 2026)
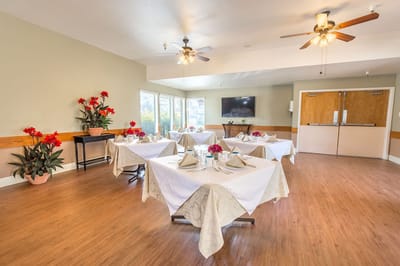
Residents meet regularly to discuss policies, care quality, and activities
Organized group of residents that meets regularly to discuss facility policies, quality of life, and activities.
Data sourced from CMS Long-Term Care Facility Characteristics quarterly report. Payer mix reflects the current resident census by primary payment source.
Historical financial and operational data for Windsor Skyline Care Center from 2011–2023, based on CMS SNF Cost Reports.
Key figures below are for fiscal year ending in 12/2023.
Based on CMS SNF Cost Report for fiscal year ending in 12/2023.
Most residents stay for extended periods and receive ongoing daily care.
New residents most often arrive under Medicare (39% of admissions), and a typical Medicare stay runs around 26 days.
Coverage residents most often arrive under.
Coverage residents most often leave under.
![]() 1.5 miles from city center
1.5 miles from city center
![]() Estimated distance in miles from Salinas's city center to Windsor Skyline Care Center's address, calculated via Google Maps.
Estimated distance in miles from Salinas's city center to Windsor Skyline Care Center's address, calculated via Google Maps.
Add your location
Info below is compiled from CMS reports & the CA Dept. of Social Services (CDSS), senior community websites & trusted data sources such as Walk Score & BBB.
Communities are listed from highest to lowest based on our ranking methodology.
| Harrison Villa of Mt. San Antonio Gardens | NH AL IL MC SNF | Pomona | 520
Facility
520
CA AVG
104
Rank
#16 / 1644 |
84.0%
Facility
84.0%
CA AVG
73.9
Rank
#483 / 1492 | +14% | 6.62
Facility
6.62
CA AVG
4.22
Rank
#5 / 293 | +3% | +57% | $0
Facility
$0
CA AVG
$56.5k
Rank
#1 / 298 | 94
Facility
94
CA AVG
81
Rank
#185 / 1400 | 16
Facility
16
CA AVG
50.2
Rank
#21 / 293 | 5.3
Facility
5.3
CA AVG
4.6
Rank
#218 / 293 | - | 437 | - |
45
Facility
45
CA AVG
57
Rank
#1470 / 2087 | Congregational Homes | $5.9MFiscal year ending 09/2023
Facility
$5.9MFiscal year ending 09/2023
CA AVG
$17.0M
Rank
#20 / 295 | $18.0MFiscal year ending 09/2023
Facility
$18.0MFiscal year ending 09/2023
CA AVG
$7.0M
Rank
#13 / 295 | 306%Fiscal year ending 09/2023
Facility
306%Fiscal year ending 09/2023
CA AVG
45.2%
Rank
#202 / 295 | 55016 | ||||
| Carlsbad By The Sea Care Center | NH SNF | Carlsbad (Carlsbad Village) | 224
Facility
224
CA AVG
104
Rank
#116 / 1644 |
84.8%
Facility
84.8%
CA AVG
73.9
Rank
#460 / 1492 | +15% | 5.00
Facility
5.00
CA AVG
4.22
Rank
#36 / 293 | 0% | +18% | $0
Facility
$0
CA AVG
$56.5k
Rank
#1 / 298 | 94
Facility
94
CA AVG
81
Rank
#185 / 1400 | 12
Facility
12
CA AVG
50.2
Rank
#9 / 293 | 4.0
Facility
4.0
CA AVG
4.6
Rank
#142 / 293 | - | 190 | A+ |
96
Facility
96
CA AVG
57
Rank
#43 / 2087 | Paula Digerness | $6.3MFiscal year ending 03/2024
Facility
$6.3MFiscal year ending 03/2024
CA AVG
$17.0M
Rank
#74 / 295 | $8.0MFiscal year ending 03/2024
Facility
$8.0MFiscal year ending 03/2024
CA AVG
$7.0M
Rank
#135 / 295 | 128.1%Fiscal year ending 03/2024
Facility
128.1%Fiscal year ending 03/2024
CA AVG
45.2%
Rank
#270 / 295 | 56496 | ||||
| Vi at La Jolla Village | NH AL IL MC SNF | San Diego (University City) | 783
Facility
783
CA AVG
104
Rank
#5 / 1644 |
69.3%
Facility
69.3%
CA AVG
73.9
Rank
#947 / 1492 | -6% | 5.26
Facility
5.26
CA AVG
4.22
Rank
#20 / 293 | +43% | +25% | $0
Facility
$0
CA AVG
$56.5k
Rank
#1 / 298 | 84
Facility
84
CA AVG
81
Rank
#731 / 1400 | 15
Facility
15
CA AVG
50.2
Rank
#19 / 293 | 2.1
Facility
2.1
CA AVG
4.6
Rank
#8 / 293 | - | 543 | - |
88
Facility
88
CA AVG
57
Rank
#218 / 2087 | Cc-La Jolla, Inc | $10.6MFiscal year ending 12/2023
Facility
$10.6MFiscal year ending 12/2023
CA AVG
$17.0M
Rank
#5 / 295 | $9.6MFiscal year ending 12/2023
Facility
$9.6MFiscal year ending 12/2023
CA AVG
$7.0M
Rank
#106 / 295 | 91.3%Fiscal year ending 12/2023
Facility
91.3%Fiscal year ending 12/2023
CA AVG
45.2%
Rank
#294 / 295 | 555793 | ||||
| Vi at Palo Alto | NH AL IL MC SNF | Palo Alto | 876
Facility
876
CA AVG
104
Rank
#1 / 1644 |
73.1%
Facility
73.1%
CA AVG
73.9
Rank
#851 / 1492 | -1% | 5.11
Facility
5.11
CA AVG
4.22
Rank
#32 / 293 | +28% | +21% | $0
Facility
$0
CA AVG
$56.5k
Rank
#1 / 298 | 90
Facility
90
CA AVG
81
Rank
#398 / 1400 | 18
Facility
18
CA AVG
50.2
Rank
#28 / 293 | 3.0
Facility
3.0
CA AVG
4.6
Rank
#55 / 293 | 1 | 640 | - |
80
Facility
80
CA AVG
57
Rank
#416 / 2087 | Cary Maslow | $15.0MFiscal year ending 12/2023
Facility
$15.0MFiscal year ending 12/2023
CA AVG
$17.0M
Rank
#2 / 295 | $10.6MFiscal year ending 12/2023
Facility
$10.6MFiscal year ending 12/2023
CA AVG
$7.0M
Rank
#63 / 295 | 70.6%Fiscal year ending 12/2023
Facility
70.6%Fiscal year ending 12/2023
CA AVG
45.2%
Rank
#295 / 295 | 555835 | ||||
| Windsor Skyline Care Center | NH HOS RC SNF | Salinas (Laurel West) | 80
Facility
80
CA AVG
104
Rank
#911 / 1644 |
75.0%
Facility
75.0%
CA AVG
73.9
Rank
#804 / 1492 | +2% | 4.24
Facility
4.24
CA AVG
4.22
Rank
#116 / 293 | -34% | 0% | $63.9k
Facility
$63.9k
CA AVG
$56.5k
Rank
#267 / 298 | 73
Facility
73
CA AVG
81
Rank
#1022 / 1400 | 41
Facility
41
CA AVG
50.2
Rank
#145 / 293 | 5.1
Facility
5.1
CA AVG
4.6
Rank
#211 / 293 | 1 | 60 | A+ |
63
Facility
63
CA AVG
57
Rank
#949 / 2087 | - | $9.8MFiscal year ending 12/2023
Facility
$9.8MFiscal year ending 12/2023
CA AVG
$17.0M
Rank
#227 / 295 | $5.4MFiscal year ending 12/2023
Facility
$5.4MFiscal year ending 12/2023
CA AVG
$7.0M
Rank
#237 / 295 | 54.9%Fiscal year ending 12/2023
Facility
54.9%Fiscal year ending 12/2023
CA AVG
45.2%
Rank
#144 / 295 | 55871 |
Windsor Skyline Care Center is in the Laurel West neighborhood of Salinas.
Windsor Skyline Care Center has a walk score of 63. Moderately walkable. Some errands can be accomplished on foot, with a mix of nearby amenities.
Windsor Skyline Care Center's occupancy is 84.9%.
Windsor Skyline Care Center has been operating for approximately 35 years, based on available licensing and registration records.
No, Windsor Skyline Care Center has a no-pet policy.
Windsor Skyline Care Center is registered as a for-profit in CA.
Windsor Skyline Care Center has had 41 reported citations since 2019 according to records from California Department of Social Services (CDSS).
Care Cost Calculator: See Prices in Your Area
Nursing Home Data Explorer
Don’t Wait Too Long: 7 Red Flag Signs Your Parent Needs Assisted Living Now
The True Cost of Assisted Living in 2025 – And How Families Are Paying For It
Understanding Senior Living Costs: Pricing Models, Discounts & Financial Assistance


