Woods Edge Rehab and Nursing
Nursing Home · Hamilton County, OH
CMS overall rating Info The Overall CMS Rating is scored from 1 to 5 stars and combines results from health inspections, staffing levels, and quality measures. Health inspections carry the most weight. Staffing and quality scores can increase or decrease the final rating based on performance compared to state and national standards.

Woods Edge Rehab and Nursing

Nursing Home · Hamilton County, OH
CMS overall rating Info The Overall CMS Rating is scored from 1 to 5 stars and combines results from health inspections, staffing levels, and quality measures. Health inspections carry the most weight. Staffing and quality scores can increase or decrease the final rating based on performance compared to state and national standards.
Calculator: See prices in your area
Woods Edge Rehab and Nursing accepts Medicaid, Medicare, and private pay.

Overview of Woods Edge Rehab and Nursing

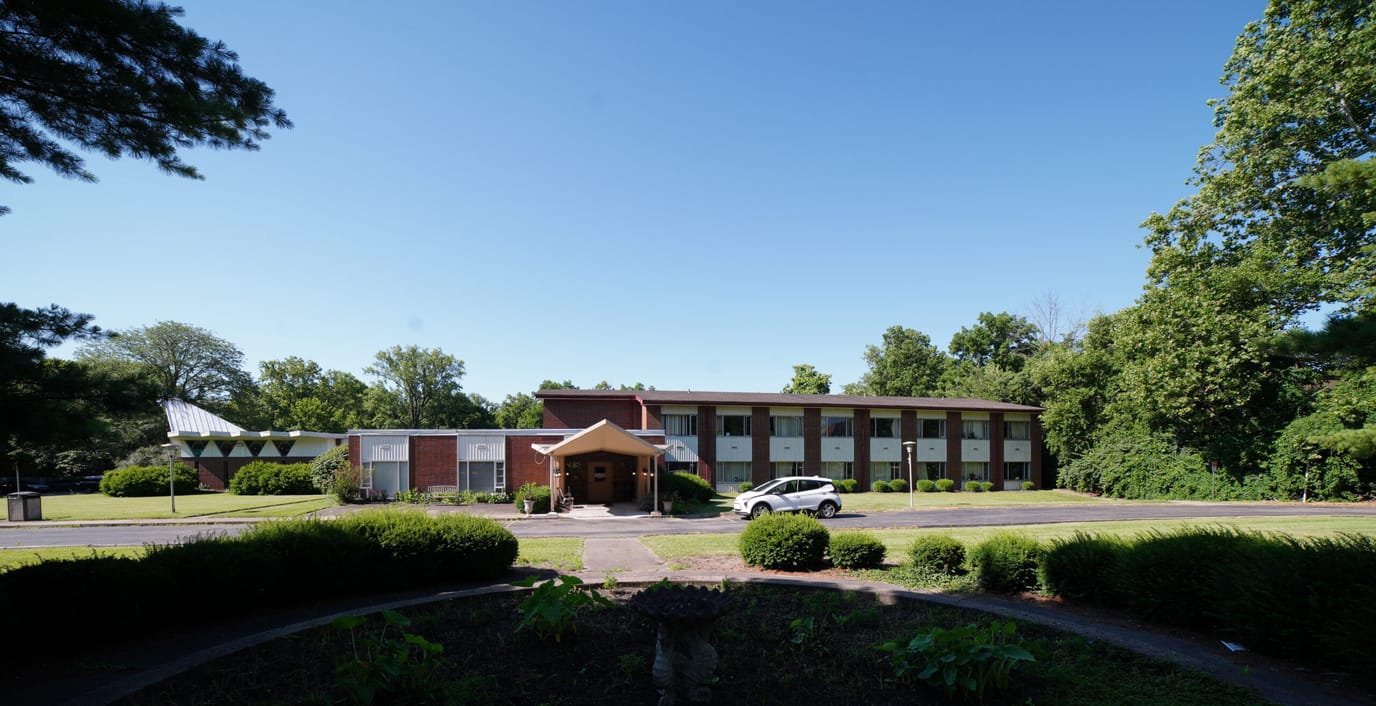
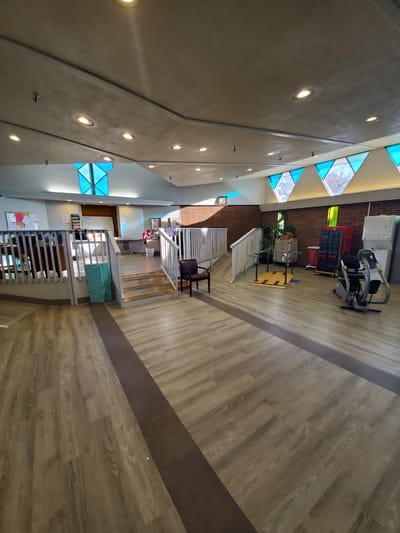
Achieve your highest potential with Woods Edge Rehab and Nursing, a trusted community in Cincinnati, OH, for skilled nursing care and rehabilitation. Residents here enjoy the utmost comfort with kind and reliable nurses available to attend to their needs and assist them with their daily living activities 24/7. Physical, speech, and occupational therapists are available 7 days a week to ensure residents’ progress and closely monitored and their care plans are regularly updated.

Fun and therapeutic activities are also available to ensure residents maintain an active and fulfilling lifestyle. Fresh and healthy meals approved by a registered dietician are also served daily to make sure residents are properly nourished and healthy. At Woods Edge Rehab and Nursing, residents can recover quickly or maintain their optimal well-being while making new memories.

Quality ratings

Measured by Centers for Medicare & Medicaid Services (CMS)

Overall rating Info The Overall CMS Rating combines results from health inspections, staffing levels and quality measures. Health inspections carry the most weight. Staffing and quality scores can increase or decrease the final rating based on performance compared to state and national standards.
▼ 41.2% Below OH avg.
Health Inspection Info Based on the results of the facility's three most recent standard inspections and any complaint investigations. CMS reviews the number, scope, and severity of deficiencies, with more recent findings weighted more heavily.
▼ 65.3% Below OH avg.
Staffing Info Measures average nursing staff hours per resident per day, including Registered Nurses (RNs) and total nursing staff. Ratings are adjusted based on the level of care residents require and are compared to state and national benchmarks.
▼ 29.8% Below OH avg.
Quality Measures Info Based on clinical and physical health indicators reported to CMS, such as hospital readmissions, falls, pressure ulcers, and improvements in mobility. These measures reflect how well residents' health needs are being managed.
▲ 13.1% Above OH avg.

Staffing hours breakdown

Info Daily nursing hours per resident by staff type, reported to CMS. Higher is generally better — compare this facility to state and national averages to see where staffing stands.

Hours per resident per day — compared to Ohio state averages

Total nursing care / resident Info This home is ranked 105th out of 165 homes in Ohio.

Total adjusted nursing hours per resident per day, combining RN, LPN, and aide time. CMS adjusts this for case-mix so facilities can be fairly compared.
3h 16m per day
Rank #105 / 165Nurse hours — state benchmarkedThis home is ranked 105th out of 165 homes in Ohio.Shows adjusted nurse hours per resident per day benchmarked to the Ohio average, with a ranking across 165 Ohio SNFs. More hours mean more direct care. The national average is about 3.5 hrs; below 3.0 is a red flag.
This facility Ohio avg (3h 50m per day)
vs Ohio avg
-15%

4 of 6 metrics below state avg

Standout metric Nurse Aide is +5% above state avg
Staff typeHours / dayvs state avg
Registered Nurse (RN) Info RNs hold the highest nursing license and can assess residents, interpret test results, and direct care plans. More RN hours per day often signals stronger clinical oversight and faster response to health changes. 20m per day ▼ 47% State avg: 38m per day · National avg: 41m per day
LPN / LVN Info Licensed Practical Nurses (LPNs) or Licensed Vocational Nurses (LVNs) deliver routine hands-on care — medication administration, wound dressing, and monitoring vital signs. They work under RN supervision and make up a large share of daily bedside care. 58m per day ■ Avg State avg: 58m per day · National avg: 52m per day
Nurse Aide Info Certified Nurse Aides (CNAs) provide the most direct day-to-day assistance: bathing, dressing, feeding, and mobility. Nurse aide hours are typically the largest staffing category and directly affect residents' quality of life. 2h 15m per day ▲ 5% State avg: 2h 8m per day · National avg: 2h 21m per day
Total Nursing (Weekend) Info Combined nursing hours (RN + LPN + Nurse Aide) per resident per day on weekends. Staffing often drops on weekends — this figure reveals whether the facility maintains adequate coverage outside of weekday hours. 2h 47m per day ▼ 15% State avg: 3h 17m per day · National avg: 3h 26m per day
Physical Therapist Info Hours per resident per day provided by licensed Physical Therapists (PTs) or PT Assistants. PT services help residents recover mobility after injury or illness and are especially important for post-acute (short-stay) rehabilitation. 1m per day ▼ 67% State avg: 3m per day · National avg: 4m per day
RN (Weekend) Info Registered nurse hours specifically on weekends. Facilities sometimes reduce RN presence on Saturdays and Sundays — a low weekend RN figure compared to weekday hours can indicate reduced clinical oversight when most administrative staff are absent. 11m per day ▼ 56% State avg: 25m per day · National avg: 29m per day

Capacity and availability

This home usually has availability

Occupancy lower than 85% suggests more openings may be available.

Higher occupancy than the Ohio average: 78.7%
Occupancy rate 80.6% Rank #85 / 166Occupancy rate — state benchmarkedThis home is ranked 85th out of 166 homes in Ohio.Shows this facility's occupancy rate versus the Ohio average, with its statewide rank out of 166. Higher occupancy signals strong local demand and financial stability.
Avg. Length of Stay 256 days
Occupancy rate
80.6% Rank #85 / 166Occupancy rate — state benchmarkedThis home is ranked 85th out of 166 homes in Ohio.Shows this facility's occupancy rate versus the Ohio average, with its statewide rank out of 166. Higher occupancy signals strong local demand and financial stability.
Avg. Length of Stay
256 days

Who this home usually serves

TYPE OF STAY

Primarily long-term care, limited rehab

Most residents stay long-term, while a smaller portion are admitted for short-term rehab.

Breakdown by payment type

Medicare

6% of new residents, usually for short-term rehab.

Typical stay 1 - 2 months

Private pay

64% of new residents, often for short stays.

Typical stay 8 - 9 months

Medicaid

30% of new residents, often for long-term daily care.

Typical stay 9 - 10 months

Finances and operations

Privately-owned community
Operated by a partnership between two or more business owners.
Home revenue
$9.3M
Profit
$1.5M
Privately-owned community Operated by a partnership between two or more business owners.
Home revenue
$9.3M Rank #102 / 165Revenue — state benchmarkedThis home is ranked 102nd out of 165 homes in Ohio.Shows this facility's annual revenue compared to the Ohio SNF average. Higher revenue generally means more resources for staffing and capital — read alongside Payroll %.
Profit
$1.5M
Payroll costs Info The portion of the home's budget spent on staff, including nurses, caregivers, and other employees who support care and operations. Rank #91 / 165Payroll — state benchmarkedThis home is ranked 91st out of 165 homes in Ohio.Shows total annual staff payroll benchmarked to the Ohio average. Higher payroll investment relative to peers often signals better staffing and less reliance on cheaper contract labor.
$4.4M
47.7% of revenue Rank #45 / 165Payroll % — state benchmarkedThis home is ranked 45th out of 165 homes in Ohio.Shows payroll as a percentage of revenue versus the Ohio average. Well-run SNFs often land around 55–65%. Below 25% may signal understaffing or heavy agency use — read with Staffing ratings.
Other operating costs Info All remaining costs needed to run the home, such as food, utilities, building maintenance, supplies and administrative expenses.
$3.4M
Total costs $7.8M
Years in operation
29 years in operation
A longer operating history, which may indicate experience navigating regulations and delivering ongoing care.
Walk Score
Walk Score: 53 / 100 Rank #32 / 115Walk Score — state benchmarkedThis home is ranked 32nd out of 115 homes in Ohio.Shows how walkable this facility's neighborhood is compared to the average Walk Score across Ohio SNFs. Higher scores benefit residents, families, and staff.
Moderately walkable. Some errands can be accomplished on foot, with a mix of nearby amenities.
BBB Rating
BBB Rating: A+ (Not Accredited)
An independent rating from the Better Business Bureau based on factors such as complaint history, transparency, and business practices.
How BBB ratings work

About this community

License Details

CMS Certification Number366209

Staffing

Key information about the people who lead and staff this community.

Leadership

ContactMs. Wanda J. Rice, Controller

Payment & Insurance

2 services
Accept Medicaid
Accept Medicare

Therapy & Rehabilitation

3 services
Rehabilitation Services
Respite Care
Short-Term Rehab

Staffing & Medical

1 service
24-Hour Staffing

Amenities & Lifestyle

Case Management Services
Chapel Services
Community Life Activities
Complimentary Laundry Service
Free Cable And Wi-Fi Access
Housekeeping Services
On Site Salon
Outdoor Courtyard
Specific ProgramsMedical Services
Operating Hours7 Days a Week

What does this home offer?

Housing options icon

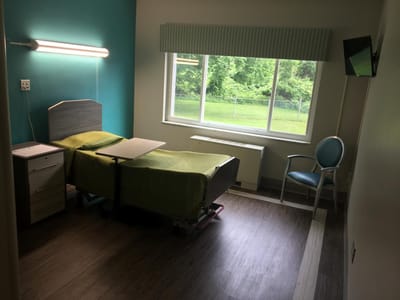
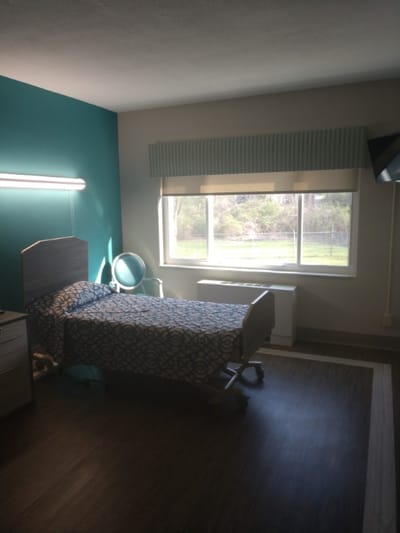
Housing Options: Private Rooms

Building type icon
Building type icon

Building Type: 2-story

Beauty services icon

Beauty Services

Housekeeping icon
Housekeeping icon

Housekeeping Services

Exercise program icon

Exercise Programs

Health Programs icon

Health Programs

Types of Care at Woods Edge Rehab and Nursing

Nursing Home

Contact Woods Edge Rehab and Nursing

Inspection History

In Ohio, the Department of Health, Bureau of Survey and Certification conducts unannounced onsite inspections to evaluate the quality of care and environment in all licensed facilities.

Since 2018 · 8 years of data 53 citations

Inspection Scorecard Info This scorecard compares key inspection, citation, and complaint metrics at this facility against the Ohio state average. Metrics rated ≥15% worse than average are highlighted in red; those ≥15% better are highlighted in green.

Since 2018 vs. Ohio state average
Overall vs. OH average 2 Worse Metrics worse than Ohio average:
• Total citations (2550% above)
• Citations per year (2100% above)
0 Better No metrics in this bucket.
Latest Inspection December 1, 2025 Complaint Investigation

Citations Info Citations are formal regulatory issues recorded during state inspections.

MetricThis FacilityOH Averagevs. OH Avg
Total citations Info Formal regulatory issues recorded by inspectors across all inspection types. 532 This facility has 2550% more total citations than a typical Ohio nursing home (53 vs. OH avg 2).↑ 2550% worse
Citations per year Info Average citations per year since 2018. 6.60.3 This facility has 2100% more citations per year than a typical Ohio nursing home (6.6 vs. OH avg 0.3).↑ 2100% worse

Inspection Reports Summary Info An editor-reviewed summary of the themes and findings across this facility's recent inspection reports.

The most recent inspection on December 1, 2025, identified deficiencies related to fall investigations and infection control practices during wound care. Earlier inspections showed a pattern of issues including inadequate supervision leading to resident elopements, medication documentation errors, food service and labeling problems, and lapses in staff registration and infection control. Complaint investigations substantiated concerns about supervision failures that resulted in injury and infection control deficiencies, but enforcement actions such as fines or license suspensions were not listed in the available reports. Most complaints were substantiated, particularly those involving resident safety and infection control. The facility’s inspection history indicates ongoing challenges with supervision and infection control, with no clear trend of improvement or worsening in recent reports.

Read the full inspection reports for this facility, including detailed findings and corrective actions.

Show Inspection Reports

Health Inspection History

Inspections
Total health inspections 12

Ohio average 6.7


Last Health inspection on Sep 2025

Total health citations
50 Rank #144 / 166Health citations — state benchmarkedThis home is ranked 144th out of 166 homes in Ohio.Shows this facility's total health deficiency citations benchmarked to the Ohio state average, with a ranking across all 166 OH SNFs. Lower citation counts earn a better rank.

Ohio average 30.9

Citations per inspection
4.17 Rank #90 / 166Citations per inspection — state benchmarkedThis home is ranked 90th out of 166 homes in Ohio.Shows average deficiency citations per CMS inspection for this facility versus the Ohio mean across 166 SNFs with citation data. Lower is better.

Ohio average 4.59


Health citations are formal notices following inspections when they fail to comply with safety and care standards.

32 of 50 citations resulted from standard inspections; and 18 of 50 resulted from complaint investigations.

Breakdown of citation severity (last 8 years)
Critical Health citations More info
1
233% worse than Ohio average

Ohio average: 0.3


Serious Health citations More info 0
100% better than Ohio average

Ohio average: 0.9

1 critical citation More info Ohio average: 0.3

0 serious citations More info Ohio average: 0.9

47 moderate citations More info Ohio average: 29

2 minor citations More info Ohio average: 0.7
Citations history (last 8 years)
Infection Control moderate citation Info Issues related to preventing and controlling infections, including hygiene practices and safety protocols. Sep 30, 2025

Quality of Care critical citation Info Issues related to how well residents receive appropriate treatment and support for their medical and daily care needs. Sep 30, 2025
Corrected

Pharmacy moderate citation Info Issues related to medication management, including how drugs are stored, administered, and monitored. Apr 10, 2025
Corrected

Nutrition moderate citation Info Issues related to food quality, meal service, and resident's nutritional needs. Mar 20, 2025
Corrected

Financial Assistance for
Nursing Home in Ohio

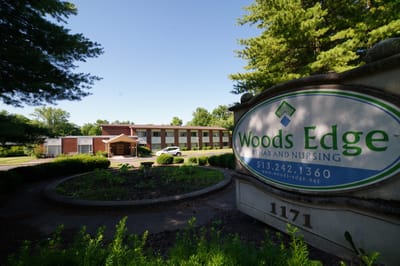
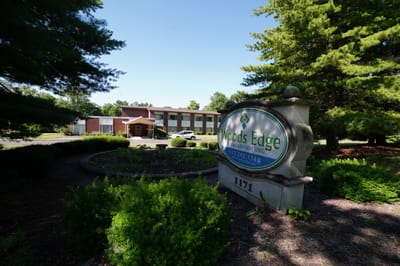
Woods Edge Rehab and Nursing is located in Cincinnati, Ohio.
Here are the financial assistance programs available to residents in Ohio.

Get Financial aid guidance

PASSPORT Waiver

Ohio Medicaid PASSPORT

Age 60+
General Ohio resident, Medicaid-eligible, nursing home-level care need.
Income Limits (2025) ~$2,829/month 300% FBR, individual
Asset Limits $2,000 (individual), $3,000 (couple).
OH

Administered through regional agencies; waitlists possible.

Benefits
Personal care (5-7 hours/day) Respite (240 hours/year) Adult day care ($65/day) Home modifications ($1,500 avg.)

Ohio Home Care Program (non-Medicaid)

OH HCP

Age 60+
General Ohio resident, at risk of decline.
Income Limits ~$2,000/month individual, varies
Asset Limits $5,000 individual
OH

Limited funding; regional variation.

Benefits
In-home care (3-5 hours/week) Respite (up to 10 days/year) Transportation (~5 trips/month)

Assisted Living Waiver (ALW)

Ohio Assisted Living Waiver

Age 21+ (65+ prioritized)
General OH resident, Medicaid-eligible, NFLOC.
Income Limits (2025) ~$2,829/month (individual); QIT required.
Asset Limits $2,000 (individual), $3,000 (couple).
OH

Covers ~300 facilities; room/board not included (separate cost).

Benefits
Personal care Meals Medication management Transportation (~$3,000-$4,000/month value)

Program of All-Inclusive Care for the Elderly (PACE)

Ohio PACE (e.g., McGregor PACE)

Age 55+
General OH resident (specific counties), NFLOC, safe with PACE support.
Income Limits (2025) ~$2,829/month (Medicaid-eligible); private pay option available.
Asset Limits $2,000 (individual), $3,000 (couple) for Medicaid enrollees.
OH

Available in 9 counties (e.g., Cuyahoga, Franklin); expanding via Healthy Aging Grants.

Benefits
Personal care (5-7 hours/day) Medical care Meals Transportation Respite Therapies

Medicare Savings Program (MSP)

Ohio Medicare Savings Program

Age 65+ or disabled
General OH resident, Medicare Part A/B.
Income Limits (2025) ~$2,510/month (QMB), ~$3,380/month (SLMB), ~$3,598/month (QI)—individual.
Asset Limits $9,430 (individual), $14,130 (couple).
OH

Three tiers; includes Extra Help for Part D; no waitlist.

Benefits
Covers Part B premiums ($174.70/month) Deductibles ($240/year) Copays (~20%)

Home Energy Assistance Program (HEAP)

Ohio HEAP

Age 60+ prioritized
General OH resident, low-income household.
Income Limits (2025) ~$3,970/month individual, 185% FPL
Asset Limits Not assessed; income-focused.
OH

Covers gas, electric, oil; emergency aid via Winter/Summer Crisis Programs.

Benefits
Heating/cooling aid ($300-$1,000/season) Emergency aid ($500 max)

Family Caregiver Support Program (FCSP)

Ohio Family Caregiver Support Program

Age
General Caregivers of 60+ needing care or 55+ caregivers of others; OH resident; functional needs (2+ ADLs).
Income Limits (2025) Prioritizes ~$24,980/year (individual); no strict cap.
Asset Limits Not assessed; need-based.
OH

12 AAAs; rural/low-income priority; volunteer respite option.

Benefits
Respite (4-6 hours/week or 5 days/year) Adult day care ($60/day) Training Supplies (~$500/year)

VA Aid and Attendance (A&A) and Housebound Benefits

Ohio VA Aid and Attendance/Housebound

Age 65+ or disabled veteran/spouse
General OH resident, wartime service, need for ADL help (A&A) or homebound.
Income Limits (2025) Net income < ~$1,984/month (veteran with dependent, A&A); pension offsets income.
Asset Limits ~$155,356 net worth limit
OH

High veteran demand; supports care in multiple settings.

Benefits
Cash (~$1,433-$2,642/month veteran, ~$951-$1,318 spouse) for care costs (e.g., in-home, assisted living)

Homestead Exemption

Ohio Homestead Exemption

Age 65+ (or disabled)
General OH resident, homeowner, low-income.
Income Limits (2025) ~$38,500/year individual, adjusted annually
Asset Limits Not assessed; home ownership required.
OH

Reduces taxable value by $25,000; applies to primary residence.

Benefits
Tax reduction (~$400-$800/year avg., varies by county)

Save the Dream Ohio (Homeowner Assistance Fund)

Ohio Save the Dream

Age 60+ prioritized
General OH resident, homeowner, hardship post-Jan 21, 2020.
Income Limits (2025) ~$147,600/year family of 4, 150% AMI; varies by county
Asset Limits Not assessed; hardship-focused.
OH

Covers delinquent mortgages, utilities, taxes; max $25,000 mortgage aid.

Benefits
Mortgage aid ($25,000 max) Utility/property tax aid ($5,000 avg.)

Places of interest near Woods Edge Rehab and Nursing

Address 8.8 miles from city center Info Estimated distance in miles from Cincinnati's city center to Woods Edge Rehab and Nursing's address, calculated via Google Maps.

Calculate Travel Distance to Woods Edge Rehab and Nursing

Add your location

Address

Staffing Data (Q2 2025)

This data corresponds to Q2 2025 and is based on CMS Payroll-Based Journal.

Total staff 124
Employees 116
Contractors 8
Staff to resident ratio 1.57:1
27% worse than Ohio average

Ohio average ratio: 2.14:1

Avg staff/day 39
Average shift 8 hours
0% compared with Ohio average

Ohio average: 8.1 hours

Total staff hours (quarter) 28,436

Nursing staff breakdown

Registered Nurse

Manages medical care and health needs.

Total count 10
Average shift length Info Average shift length. Calculated as total hours divided by days worked and average staff per day. 9.3 hours

No contractors work on this role.

Licensed Practical Nurse

Assists with medical care and medications.

Total count 23
Average shift length Info Average shift length. Calculated as total hours divided by days worked and average staff per day. 9 hours

This role is partially covered by contractors.

Certified Nursing Assistant

Helps with daily care and mobility.

Total count 63
Average shift length Info Average shift length. Calculated as total hours divided by days worked and average staff per day. 8.8 hours

No contractors work on this role.

Contractor staffing

Total hours from contractors

3.7%

1,045 contractor hours this quarter

Occupational Therapy Aide: 2 Licensed Practical Nurse: 1 Clinical Nurse Specialist: 1 Feeding Assistant: 1 Occupational Therapy Assistant: 1 Medical Director: 1 Other Physician: 1

Staff by category

Certified Nursing Assistant6306314,88891100%8.8
Licensed Practical Nurse221236,87391100%9
Registered Nurse100101,2108695%9.3
Therapeutic Recreation Specialist2027577987%5.5
Nurse Practitioner1015046369%8
Mental Health Service Worker1015026268%8.1
Clinical Nurse Specialist2134854549%8.1
RN Director of Nursing2024786268%7.5
Administrator2024645864%8
Dietitian1014226268%6.8
Qualified Social Worker3033386976%3.6
Respiratory Therapist1013064549%6.8
Feeding Assistant0112725257%5.2
Occupational Therapy Aide0222173943%5.4
Physical Therapy Assistant2022065662%3.7
Other Dietary Services Staff2021852629%6.3
Medical Director0111264651%2.7
Respiratory Therapy Technician202952629%3.7
Other Physician011752527%3
Occupational Therapy Assistant011351314%2.7
63 Certified Nursing Assistant
% of Days 100%
23 Licensed Practical Nurse
% of Days 100%
10 Registered Nurse
% of Days 95%
2 Therapeutic Recreation Specialist
% of Days 87%
1 Nurse Practitioner
% of Days 69%
1 Mental Health Service Worker
% of Days 68%
3 Clinical Nurse Specialist
% of Days 49%
2 RN Director of Nursing
% of Days 68%
2 Administrator
% of Days 64%
1 Dietitian
% of Days 68%
3 Qualified Social Worker
% of Days 76%
1 Respiratory Therapist
% of Days 49%
1 Feeding Assistant
% of Days 57%
2 Occupational Therapy Aide
% of Days 43%
2 Physical Therapy Assistant
% of Days 62%
2 Other Dietary Services Staff
% of Days 29%
1 Medical Director
% of Days 51%
2 Respiratory Therapy Technician
% of Days 29%
1 Other Physician
% of Days 27%
1 Occupational Therapy Assistant
% of Days 14%

Facility Characteristics

Source: CMS Long-Term Care Facility Characteristics (Data as of Jan 2026)

Total residents 79
Medicare
2
2.5% of residents
Medicaid
41
51.9% of residents
Private pay or other
36
45.6% of residents
Programs & Services
Residents Group

Residents meet regularly to discuss policies, care quality, and activities

Nurse Aide Training

State-approved Nurse Aide Training and Competency Evaluation Program on-site

Active Resident Council

Organized group of residents that meets regularly to discuss facility policies, quality of life, and activities.

Quality of care over time

These measures show how residents usually do over time at this home, based on health outcomes and preventive care.

High-risk clinical events score Info A composite score based on pressure ulcers, falls with injury, weight loss, walking ability decline, and activities of daily living decline. 2.3
61% better than Ohio average

Ohio average: 5.8

Functional decline score Info A composite score based on activities of daily living decline, walking ability decline, and incontinence. 9.4
26% better than Ohio average

Ohio average: 12.7

Long-stay resident measures
Significantly above average Ohio avg: 4.7 Info CMS star rating based on long-stay quality measure performance. 5 stars = significantly above average, 1 star = significantly below average.
Need for Help with Daily Activities Increased Info Percent of long-stay residents whose need for help with daily activities has increased 1.7%
76% better than Ohio average

Ohio average: 6.8%

Walking Ability Worsened Info Percent of long-stay residents whose ability to move independently worsened 1.3%
85% better than Ohio average

Ohio average: 8.9%

Low Risk Residents with Bowel/Bladder Incontinence Info Percent of low risk long-stay residents who lose control of their bowels or bladder 25.2%
15% worse than Ohio average

Ohio average: 22.0%

Falls with Major Injury Info Percent of long-stay residents experiencing one or more falls with major injury 3.0%
14% better than Ohio average

Ohio average: 3.4%

High Risk Residents with Pressure Ulcers Info Percent of long-stay high risk residents with pressure ulcers 2.2%
42% better than Ohio average

Ohio average: 3.9%

Urinary Tract Infection Info Percent of long-stay residents with a urinary tract infection 0.0%
100% better than Ohio average

Ohio average: 0.5%

Lost Too Much Weight Info Percent of long-stay residents who lose too much weight 3.2%
49% better than Ohio average

Ohio average: 6.2%

Depressive Symptoms Info Percent of long-stay residents who have depressive symptoms 43.4%
81% worse than Ohio average

Ohio average: 24.0%

Antipsychotic Use Info Percent of long-stay residents who received an antipsychotic medication 13.1%
56% worse than Ohio average

Ohio average: 8.4%

Pneumococcal Vaccine Info Percent of long-stay residents assessed and appropriately given the pneumococcal vaccine 91.7%
In line with Ohio average

Ohio average: 92.4%

Influenza Vaccine Info Percent of long-stay residents assessed and appropriately given the seasonal influenza vaccine 96.7%
In line with Ohio average

Ohio average: 94.5%

Short-stay resident measures
Pneumococcal Vaccine Info Percent of short-stay residents assessed and appropriately given the pneumococcal vaccine 66.2%
15% worse than Ohio average

Ohio average: 78.0%

Antipsychotic medication increase Info Percent of short-stay residents who newly received an antipsychotic medication 0.0%
100% better than Ohio average

Ohio average: 1.3%

Penalties and fines

Federal penalties imposed by CMS for regulatory violations, including civil money penalties (fines) and denials of payment for new Medicare/Medicaid admissions.

Source: CMS Penalties Database

No penalties in the past 3 years

No civil money penalties or payment denials were reported in the last 3 years.

Compare Nursing Home around Hamilton County

The information below is reported by the Ohio Department of Health, Bureau of Survey and Certification.

4 facilities compared · CMS & OH Dept. of Health data · Updated May 2026

Filter by care type
Beechwood Home
NH

Nursing Home Licensed facility providing 24/7 skilled nursing care for residents with complex, ongoing medical needs. Staffed by RNs, LPNs, and CNAs. Inspected and star-rated annually by CMS. Accepts Medicare (short-term rehab) and Medicaid (long-term care).

Cincinnati (Evanston)80 94.5% +20%4.61 -34%+30%0133.3-75- 56 William Baechtold$16.2M$5.6M34.4%365445
Mount Washington Care Center
NH

Nursing Home Licensed facility providing 24/7 skilled nursing care for residents with complex, ongoing medical needs. Staffed by RNs, LPNs, and CNAs. Inspected and star-rated annually by CMS. Accepts Medicare (short-term rehab) and Medicaid (long-term care).

Cincinnati (Fruit Hill)129 64.7% -18%3.25 +27%-8%0394.9178A+ 32 Edith Olanoff 2011 Trust Dated 10/21/2011$11.8M$5.2M44.1%365423
Woods Edge Rehab and Nursing
NH

Nursing Home Licensed facility providing 24/7 skilled nursing care for residents with complex, ongoing medical needs. Staffed by RNs, LPNs, and CNAs. Inspected and star-rated annually by CMS. Accepts Medicare (short-term rehab) and Medicaid (long-term care).

Cincinnati (Bond Hill)93 91.3% +16%3.26 -12%-8%0504.2184A+ 53 Howe Holdings LLC$9.3M$3.9M41.4%366209
CareCore at Meadows
NH

Nursing Home Licensed facility providing 24/7 skilled nursing care for residents with complex, ongoing medical needs. Staffed by RNs, LPNs, and CNAs. Inspected and star-rated annually by CMS. Accepts Medicare (short-term rehab) and Medicaid (long-term care).

Cincinnati (Forest Park)60 76.6% -3%2.86 -12%-19%1617.6282- 44 -$8.2M$3.2M38.5%366175

Guides for Better Senior Living

Care Cost Calculator: See Prices in Your Area

Nursing Home Data Explorer

Don’t Wait Too Long: 7 Red Flag Signs Your Parent Needs Assisted Living Now

The True Cost of Assisted Living in 2025 – And How Families Are Paying For It

Understanding Senior Living Costs: Pricing Models, Discounts & Financial Assistance

Frequently Asked Questions about Woods Edge Rehab and Nursing

What neighborhood is Woods Edge Rehab and Nursing in?

Woods Edge Rehab and Nursing is in the Bond Hill neighborhood of Cincinnati.

Is Woods Edge Rehab and Nursing in a walkable area?

Woods Edge Rehab and Nursing has a walk score of 53. Moderately walkable. Some errands can be accomplished on foot, with a mix of nearby amenities.

What is the occupancy rate at Woods Edge Rehab and Nursing?

Woods Edge Rehab and Nursing's occupancy is 91.3%.

What is the address of Woods Edge Rehab and Nursing?

Woods Edge Rehab and Nursing is located at 1171 Towne St, Cincinnati, OH 45216.

What is the phone number of Woods Edge Rehab and Nursing?

(513) 242-1360 will put you in contact with the team at Woods Edge Rehab and Nursing.

Is Woods Edge Rehab and Nursing Medicare or Medicaid certified?

Yes — Woods Edge Rehab and Nursing is a CMS-certified provider of Medicare and Medicaid.

Explore Open Rooms
1 Contact details
2 What type of senior care service are you looking for?
3 What budget do you have in mind for senior care?
4 How soon do you need to find care?
5 Additional details

Thank you for your interest!

Our team will be in touch shortly to help with next steps.