


Valley Senior Living on 42nd – Woodside Village
Nursing Home & Assisted Living · Grand Forks, ND
Valley Senior Living on 42nd – Woodside Village
Nursing Home & Assisted Living · Grand Forks, ND
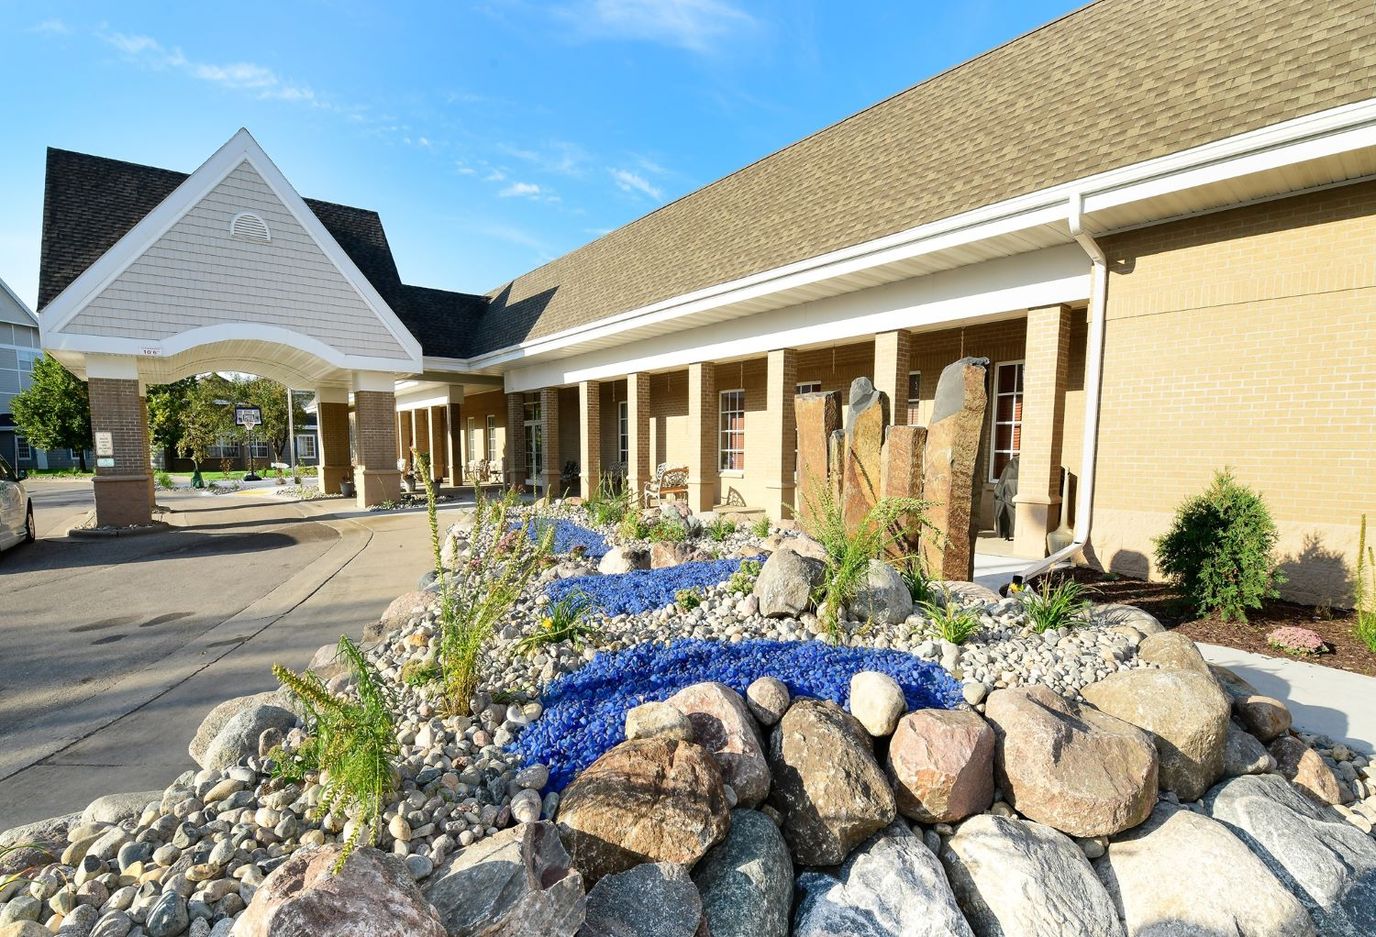
Valley Senior Living on 42nd – Woodside Village serves as a community option for seniors who need supported living in Grand Forks, North Dakota. The facility is found in an area with limited walkability, carrying a Walk Score of 16, so most errands and activities necessitate a car and travel to nearby commercial areas.
For residents and family members used to driving, this car-dependent location may be practical for accessing services and activities outside the community. Instead of a highly walkable urban location, the setting signals a common residential neighborhood appeal.
To learn more about particular care services, amenities, staffing, pricing, and daily programming at Valley Senior Living on 42nd – Woodside Village, a direct visit or dialogue with the community offers an efficient way to understand its offerings and whether it aligns with individual needs.
Walk Score: 16 / 100 Rank #68 / 80Walk Score — State benchmarkedThis home is ranked 68th out of 80 homes in North Dakota for walk score. Shows how walkable this facility's neighborhood is compared to the average walk score across North Dakota facilities. Higher scores benefit residents, families, and staff.Facilities with the same value for a metric share the same rank. Rankings are based only on facilities in North Dakota that report data for that category. Facilities without available data are excluded from the ranking.Click the rank badge to see the full State ranking.Click here to see the full State ranking.
Car-dependent. Most errands require a car, with limited nearby walkable options.
Compare Nursing Homes around Grand Forks
Info below is compiled from CMS reports & the ND Dept. of Health & Human Services (NDHHS), senior community websites & trusted data sources such as Walk Score & BBB.
Communities are listed from highest to lowest based on our ranking methodology.
| Hatton Prairie Village | NH AL IL SNF | Hatton | 17
Facility
17
ND AVG
75
Rank
#51 / 53 | - | - | 4.93
Facility
4.93
ND AVG
5.16
Rank
#13 / 21 | +16% | -4% | $0
Facility
$0
ND AVG
$38.3k
Rank
#1 / 21 | 14
Facility
14
ND AVG
16.5
Rank
#13 / 21 | 3.5
Facility
3.5
ND AVG
3.9
Rank
#11 / 21 | - | 35 | - |
27
Facility
27
ND AVG
42
Rank
#52 / 80 | Beaver Creek Lutheran Church | - | - | - | 355051 | ||||
| Valley Senior Living on 42nd | NH AL IL MC SNF | Grand Forks | 196
Facility
196
ND AVG
75
Rank
#1 / 53 |
94.9%
Facility
94.9%
ND AVG
87.2
Rank
#8 / 12 | +9% | 5.36
Facility
5.36
ND AVG
5.16
Rank
#9 / 21 | -21% | +4% | $20.1k
Facility
$20.1k
ND AVG
$38.3k
Rank
#15 / 21 | 12
Facility
12
ND AVG
16.5
Rank
#10 / 21 | 4.0
Facility
4.0
ND AVG
3.9
Rank
#16 / 21 | 2 | 186 | - |
16
Facility
16
ND AVG
42
Rank
#68 / 80 | Gina Roller | $35.0MFiscal year ending 06/2024
Facility
$35.0MFiscal year ending 06/2024
ND AVG
$11.5M
Rank
#2 / 20 | $20.7MFiscal year ending 06/2024
Facility
$20.7MFiscal year ending 06/2024
ND AVG
$5.6M
Rank
#3 / 20 | 59.3%Fiscal year ending 06/2024
Facility
59.3%Fiscal year ending 06/2024
ND AVG
48.6%
Rank
#14 / 20 | 355067 |
Financial Assistance for
Nursing Home in North Dakota
Valley Senior Living on 42nd – Woodside Village is located in Grand Forks, North Dakota.
Here are the financial assistance programs available to residents in North Dakota.
Frequently Asked Questions about Valley Senior Living on 42nd – Woodside Village
Is Valley Senior Living on 42nd – Woodside Village in a walkable area?
Valley Senior Living on 42nd – Woodside Village has a walk score of 16. Car-dependent. Most errands require a car, with limited nearby walkable options.
Are pets allowed at Valley Senior Living on 42nd – Woodside Village?
No, Valley Senior Living on 42nd – Woodside Village has a no-pet policy.
Are there photos of Valley Senior Living on 42nd – Woodside Village?
Yes — there is 1 photo of Valley Senior Living on 42nd – Woodside Village in the photo gallery on this page.
What is the phone number of Valley Senior Living on 42nd – Woodside Village?
(701) 787-7621 will put you in contact with the team at Valley Senior Living on 42nd – Woodside Village.
Guides for Better Senior Living
Care Cost Calculator: See Prices in Your Area
Nursing Home Data Explorer
Don’t Wait Too Long: 7 Red Flag Signs Your Parent Needs Assisted Living Now
The True Cost of Assisted Living in 2025 – And How Families Are Paying For It
Understanding Senior Living Costs: Pricing Models, Discounts & Financial Assistance
Updated on
