


Total staff
142
Employees
103
Contractors
39
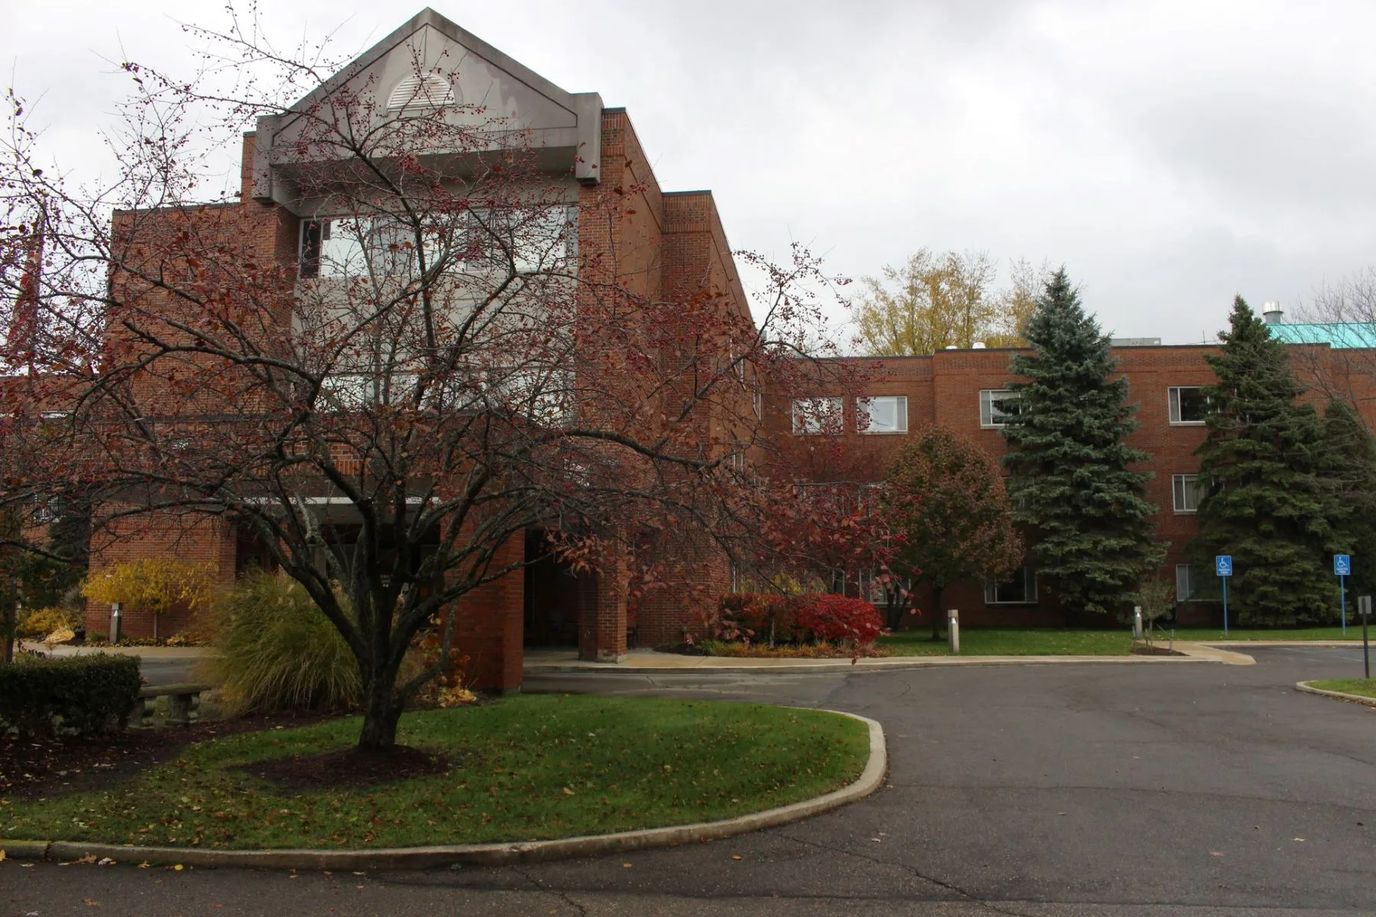
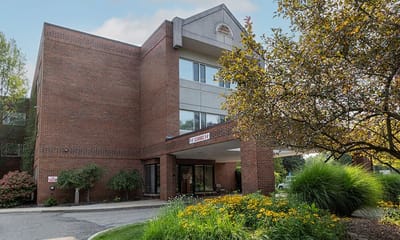
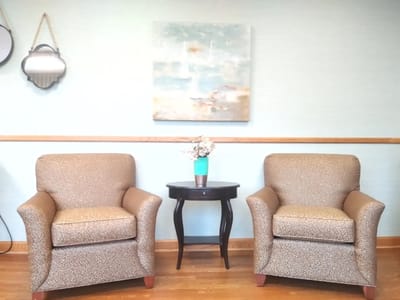
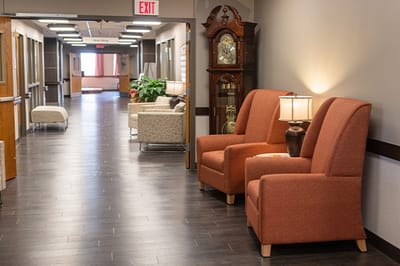
Lake Orion Nursing and Rehabilitation Center, located in Lake Orion, MI, as a healthcare facility by McLaren, providing top quality skilled nursing and rehabilitation services. Offering a positive, home-like environment to its residents, and personalized 24 hour nursing care, the whole facility aims to provide the perfect balance of comfort and care.
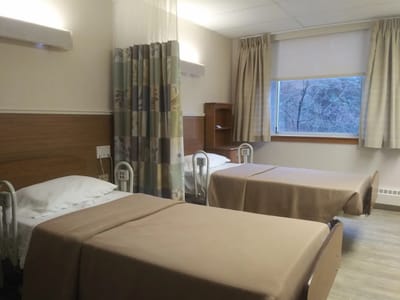
As part of their long-term care services, residents may choose from their private and semi-private accommodations featuring individual emergency call systems, as well as Wi-Fi access. The facility also offers a variety of additional services the residents may benefit from such as dietician services, occupational therapy. physical therapy, and speech therapy.
| Staff type | Hours / Day / Resident | vs state avg |
|---|---|---|
|
Registered Nurse (RN)
| 32m per day | ▼ 31% State avg: 46m per day · National avg: 41m per day |
|
LPN / LVN
| 55m per day | ▲ 3% State avg: 53m per day · National avg: 52m per day |
|
Nurse Aide
| 1h 52m per day | ▼ 22% State avg: 2h 23m per day · National avg: 2h 21m per day |
|
Weekend Total Nursing
| 3h 0m per day | ▼ 15% State avg: 3h 31m per day · National avg: 3h 26m per day |
|
Physical Therapist
| 6m per day | ▲ 54% State avg: 4m per day · National avg: 4m per day |
|
Weekend RN
| 26m per day | ▼ 9% State avg: 29m per day · National avg: 29m per day |
Reporting period: October 1 – December 31, 2025 (Q4 2025). Source: CMS Payroll-Based Journal report.
Manages medical care and health needs.
Assists with medical care and medications.
Helps with daily care and mobility.
Total hours from contractors
8,471 contractor hours this quarter
| Certified Nursing Assistant | 49 | 12 | 61 | 16,459 | 92 | 100% | 7.6 |
| Licensed Practical Nurse | 27 | 3 | 30 | 8,080 | 92 | 100% | 9.4 |
| Registered Nurse | 12 | 0 | 12 | 3,392 | 92 | 100% | 8.8 |
| Other Dietary Services Staff | 4 | 0 | 4 | 1,567 | 92 | 100% | 8.1 |
| Physical Therapist | 3 | 0 | 3 | 1,360 | 89 | 97% | 8.5 |
| Respiratory Therapy Technician | 0 | 4 | 4 | 908 | 79 | 86% | 6.5 |
| Speech Language Pathologist | 0 | 6 | 6 | 904 | 78 | 85% | 5.7 |
| Mental Health Service Worker | 2 | 0 | 2 | 886 | 64 | 70% | 8.3 |
| Physical Therapy Aide | 0 | 4 | 4 | 841 | 72 | 78% | 7 |
| Nurse Practitioner | 2 | 0 | 2 | 720 | 56 | 61% | 7.5 |
| Physical Therapy Assistant | 0 | 5 | 5 | 600 | 66 | 72% | 6.4 |
| Clinical Nurse Specialist | 2 | 0 | 2 | 586 | 60 | 65% | 8.5 |
| Occupational Therapy Aide | 0 | 1 | 1 | 491 | 63 | 68% | 7.8 |
| Administrator | 1 | 0 | 1 | 428 | 57 | 62% | 7.5 |
| Dietitian | 1 | 0 | 1 | 413 | 55 | 60% | 7.5 |
| Qualified Social Worker | 0 | 2 | 2 | 334 | 66 | 72% | 5.1 |
| Medical Director | 0 | 1 | 1 | 34 | 29 | 32% | 1.2 |
| Occupational Therapy Assistant | 0 | 1 | 1 | 21 | 13 | 14% | 1.6 |
Includes penalties issued in 2025
Federal penalties imposed by CMS for regulatory violations, including civil money penalties (fines) and denials of payment for new Medicare/Medicaid admissions.
Source: CMS Penalties Database (Data as of Jan 2026)
Michigan average: $76K
Michigan average: 2.0
Michigan average: 0.8
Penalties are imposed by CMS for violations of federal nursing home regulations.
1 penalty in the past 3 years
Sep 10, 2025 · 39 days
Last updated: Jan 2026
These measures show how residents usually do over time at this home, based on health outcomes and preventive care.
Michigan average: 8.4
Michigan average: 16.3
Michigan average: 12.5%
Michigan average: 15.3%
Michigan average: 21.0%
Michigan average: 3.2%
Michigan average: 5.7%
Michigan average: 1.7%
Michigan average: 5.7%
Michigan average: 3.9%
Michigan average: 15.0%
Michigan average: 94.9%
Michigan average: 95.0%
Michigan average: 1.74
Michigan average: 1.54
Michigan average: 82.5%
Michigan average: 1.4%
Michigan average: 79.5%
Michigan average: 24.2%
Michigan average: 11.5%
Michigan average: 0.8%
Michigan average: 53.7%
Michigan average: 50.6%
Quality measures are calculated from Minimum Data Set (MDS) assessments. For most measures, lower percentages indicate better care quality.
34% of new residents, usually for short-term rehab.
59% of new residents, often for short stays.
7% of new residents, often for long-term daily care.
Source: CMS Long-Term Care Facility Characteristics (Data as of Jan 2026)
Residents meet regularly to discuss policies, care quality, and activities
Organized group of residents that meets regularly to discuss facility policies, quality of life, and activities.
Data sourced from CMS Long-Term Care Facility Characteristics quarterly report. Payer mix reflects the current resident census by primary payment source.
Historical financial and operational data for Lake Orion Nursing and Rehabilitation Center from 2012–2023, based on CMS SNF Cost Reports.
Key figures below are for fiscal year ending in 09/2023.
Based on CMS SNF Cost Report for fiscal year ending in 09/2023.
Pets Allowed
This home supports both short-term rehab and long-term care, with residents staying for a wide range of durations.
Most new residents arrive under private pay (59% of admissions), and a typical private pay stay runs around 1 - 2 months.
Coverage residents most often arrive under.
Coverage residents most often leave under.
![]() 0.5 miles from city center
0.5 miles from city center
![]() Estimated distance in miles from Lake Orion's city center to Lake Orion Nursing and Rehabilitation Center's address, calculated via Google Maps.
— 1.73 miles to nearest hospital (Bald Mountain Regional Medical Complex)
Estimated distance in miles from Lake Orion's city center to Lake Orion Nursing and Rehabilitation Center's address, calculated via Google Maps.
— 1.73 miles to nearest hospital (Bald Mountain Regional Medical Complex)
Add your location
Info below is compiled from CMS reports & the MI Licensing & Regulatory Affairs (LARA), senior community websites & trusted data sources such as Walk Score & BBB.
Communities are listed from highest to lowest based on our ranking methodology.
| OakPointe Senior Care & Rehab Center | NH SNF | Detroit (Schulze) | 106
Facility
106
MI AVG
74
Rank
#103 / 430 |
92.4%
Facility
92.4%
MI AVG
74
Rank
#28 / 119 | +25% | 4.36 | -17% | +1% | $0 | 14 | 4.7 | - | 98 | - |
67
Facility
67
MI AVG
39
Rank
#88 / 703 | Thomas Ensign | $13.3MFiscal year ending 12/2023 | $8.0MFiscal year ending 12/2023 | 60.3%Fiscal year ending 12/2023 | 235207 | ||||
| Chelsea Retirement Community | NH AL IL MC SNF | Chelsea | 172
Facility
172
MI AVG
74
Rank
#18 / 430 |
48.3%
Facility
48.3%
MI AVG
74
Rank
#104 / 119 | -35% | 4.49 | -12% | +5% | $0 | 14 | 3.5 | - | 83 | - |
13
Facility
13
MI AVG
39
Rank
#582 / 703 | Umrcph, Inc | $36.6MFiscal year ending 06/2024 | $19.8MFiscal year ending 06/2024 | 54.3%Fiscal year ending 06/2024 | 235021 | ||||
| Friendship Village – Kalamazoo | NH AL IL MC SNF | Kalamazoo | 57
Facility
57
MI AVG
74
Rank
#250 / 430 |
88.4%
Facility
88.4%
MI AVG
74
Rank
#43 / 119 | +19% | 5.72 | +80% | +33% | $0 | 21 | 5.3 | - | 50 | A+ |
7
Facility
7
MI AVG
39
Rank
#636 / 703 | Timothy Cain | $21.8MFiscal year ending 09/2023 | $13.5MFiscal year ending 09/2023 | 62.1%Fiscal year ending 09/2023 | 235248 | ||||
| Medilodge of Monroe | NH PC RC SNF | Monroe | 103
Facility
103
MI AVG
74
Rank
#112 / 430 |
88.3%
Facility
88.3%
MI AVG
74
Rank
#45 / 119 | +19% | 3.61 | -34% | -16% | $0 | 7 | 1.8 | 1 | 91 | A+ |
72
Facility
72
MI AVG
39
Rank
#63 / 703 | - | $11.0MFiscal year ending 12/2023 | $5.7MFiscal year ending 12/2023 | 52.2%Fiscal year ending 12/2023 | 235563 | ||||
| Lake Orion Nursing and Rehabilitation Center | NH SNF | Lake Orion | 120
Facility
120
MI AVG
74
Rank
#71 / 430 |
80.2%
Facility
80.2%
MI AVG
74
Rank
#62 / 119 | +8% | 4.30 | -17% | 0% | $137.6k | 26 | 2.6 | 5 | 96 | - |
42
Facility
42
MI AVG
39
Rank
#300 / 703 | Mclaren Oakland | $9.2MFiscal year ending 09/2023 | $5.1MFiscal year ending 09/2023 | 55.3%Fiscal year ending 09/2023 | 235481 |
Lake Orion Nursing and Rehabilitation Center is in the Lake Orion neighborhood.
Lake Orion Nursing and Rehabilitation Center has a walk score of 42. Somewhat walkable. A few nearby services may be reachable on foot, but most trips require transportation.
Lake Orion Nursing and Rehabilitation Center's occupancy is 57.4%.
Yes, Lake Orion Nursing and Rehabilitation Center allows residents to bring their pets.
Lake Orion Nursing and Rehabilitation Center is registered as a non-profit.
Yes — there are 7 photos of Lake Orion Nursing and Rehabilitation Center in the photo gallery on this page.
Lake Orion Nursing and Rehabilitation Center is located at 585 E Flint St, Lake Orion, MI 48362.
Care Cost Calculator: See Prices in Your Area
Nursing Home Data Explorer
Don’t Wait Too Long: 7 Red Flag Signs Your Parent Needs Assisted Living Now
The True Cost of Assisted Living in 2025 – And How Families Are Paying For It
Understanding Senior Living Costs: Pricing Models, Discounts & Financial Assistance


