Friendship Village – Kalamazoo
Nursing Home, Assisted Living, Independent Living & Memory Care · Kalamazoo, MI
CMS overall rating Info CMS (the Centers for Medicare & Medicaid Services) is the federal agency that rates nursing home quality. Its Overall Rating runs from 1 to 5 stars, combining health inspections, staffing, and quality measures, with inspections weighted most heavily.

Friendship Village – Kalamazoo

Nursing Home, Assisted Living, Independent Living & Memory Care · Kalamazoo, MI
CMS overall rating Info CMS (the Centers for Medicare & Medicaid Services) is the federal agency that rates nursing home quality. Its Overall Rating runs from 1 to 5 stars, combining health inspections, staffing, and quality measures, with inspections weighted most heavily.
Calculator: See prices in your area
Friendship Village – Kalamazoo accepts Medicare and private pay.

Overview of Friendship Village – Kalamazoo

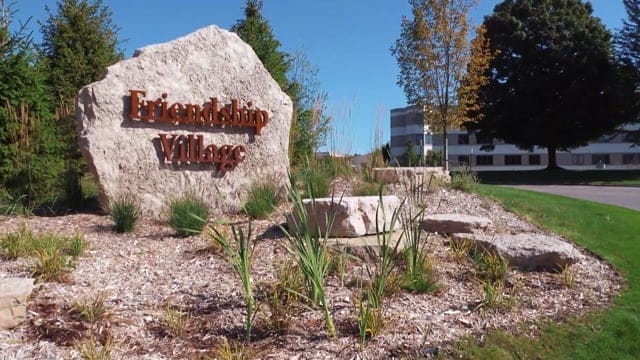
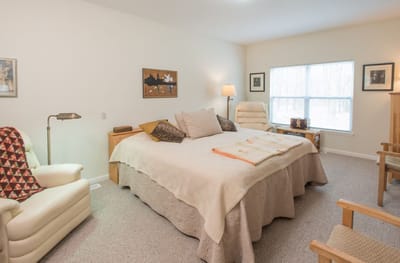
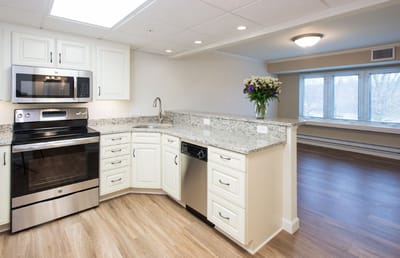
Friendship Village offers gorgeous amenities, specifically well-designed suites to ensure that the residents are enjoying and relaxed during their stay here. They offer flexible care plans so it can be adjusted depending on the comfort and needs of the residents. At Friendship Village, the staff are professionally-trained, providing all the assistance that the residents need.

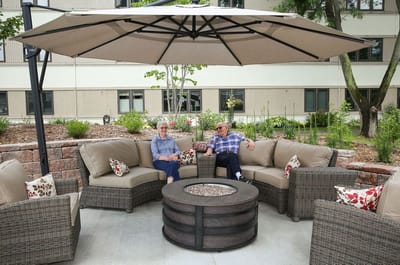
The facility gives the standard assistance and services to its residents. However, aside from that, the facility also hosts several events and activities. This ensures that the residents are kept engaged and will enjoy their stay during their retirement. For those seeking flexibility and comfort for their senior loved ones, then Friendship Village is the place for you.

(269) 381-0560

Quality ratings

Measured by Centers for Medicare & Medicaid Services (CMS)

Overall rating Info The Overall CMS Rating combines results from health inspections, staffing levels and quality measures. Health inspections carry the most weight. Staffing and quality scores can increase or decrease the final rating based on performance compared to state and national standards.
▲ 59.4% Above MI avg. ▲ 59.4% Above MI avg.MI average: 3.1Click the badge to see the full State ranking.Click here to see the full State ranking.
Health Inspection Info Based on the results of the facility's three most recent standard inspections and any complaint investigations. CMS reviews the number, scope, and severity of deficiencies, with more recent findings weighted more heavily.
▲ 41.5% Above MI avg. ▲ 41.5% Above MI avg.MI average: 2.8Click the badge to see the full State ranking.Click here to see the full State ranking.
Staffing Info Measures average nursing staff hours per resident per day, including Registered Nurses (RNs) and total nursing staff. Ratings are adjusted based on the level of care residents require and are compared to state and national benchmarks.
▲ 43.0% Above MI avg. ▲ 43.0% Above MI avg.MI average: 3.5Click the badge to see the full State ranking.Click here to see the full State ranking.
Quality Measures Info Based on clinical and physical health indicators reported to CMS, such as hospital readmissions, falls, pressure ulcers, and improvements in mobility. These measures reflect how well residents' health needs are being managed.
▲ 33.0% Above MI avg. ▲ 33.0% Above MI avg.MI average: 3.8Click the badge to see the full State ranking.Click here to see the full State ranking.

Staffing hours breakdown

Info Daily nursing hours per resident by staff type, reported to CMS. Higher is generally better — compare this facility to state and national averages to see where staffing stands.

Hours per resident per day — compared to Michigan state averages

Total nursing care / resident Info This home is ranked 8th out of 142 homes in Michigan for nurse hours. Total adjusted nursing hours per resident per day, combining RN, LPN, and aide time. CMS adjusts this for case-mix so facilities can be fairly compared.
5h 43m per day
Rank #8 / 142Nurse hours — State benchmarkedThis home is ranked 8th out of 142 homes in Michigan. Shows adjusted nurse hours per resident per day benchmarked to the Michigan average, with a ranking across 142 Michigan facilities. More hours mean more direct care. The national average is about 3.5 hrs; below 3.0 is a red flag.Rankings are based only on facilities in Michigan that report data for that category. Facilities without available data are excluded from the ranking.Click the rank badge to see the full State ranking.Click here to see the full State ranking.
This facility Michigan avg (4h 18m per day)
vs Michigan avg
+33%

1 of 6 metrics below state avg

Standout metric Weekend RN is +117% above state avg
Staff typeHours / Day / Residentvs state avg
Registered Nurse (RN) Info RNs hold the highest nursing license and can assess residents, interpret test results, and direct care plans. More RN hours per day often signals stronger clinical oversight and faster response to health changes. 1h 28m per day ▲ 92% State avg: 46m per day · National avg: 41m per day
LPN / LVN Info Licensed Practical Nurses (LPNs) or Licensed Vocational Nurses (LVNs) deliver routine hands-on care — medication administration, wound dressing, and monitoring vital signs. They work under RN supervision and make up a large share of daily bedside care. 30m per day ▼ 44% State avg: 53m per day · National avg: 52m per day
Nurse Aide Info Certified Nurse Aides (CNAs) provide the most direct day-to-day assistance: bathing, dressing, feeding, and mobility. Nurse aide hours are typically the largest staffing category and directly affect residents' quality of life. 3h 8m per day ▲ 31% State avg: 2h 23m per day · National avg: 2h 20m per day
Weekend Total Nursing Info Combined nursing hours (RN + LPN + Nurse Aide) per resident per day on weekends. Staffing often drops on weekends — this figure reveals whether the facility maintains adequate coverage outside of weekday hours. 4h 32m per day ▲ 29% State avg: 3h 31m per day · National avg: 3h 26m per day
Physical Therapist Info Hours per resident per day provided by licensed Physical Therapists (PTs) or PT Assistants. PT services help residents recover mobility after injury or illness and are especially important for post-acute (short-stay) rehabilitation. 4m per day ■ Avg State avg: 4m per day · National avg: 4m per day
Weekend RN Info Registered nurse hours specifically on weekends. Facilities sometimes reduce RN presence on Saturdays and Sundays — a low weekend RN figure compared to weekday hours can indicate reduced clinical oversight when most administrative staff are absent. 1h 3m per day ▲ 117% State avg: 29m per day · National avg: 28m per day

Capacity and availability

This home usually has availability

Lower occupancy than the Michigan average: 75.8%
Occupancy rate
63.1% Rank #155 / 395Occupancy rate — State benchmarkedThis home is ranked 155th out of 395 homes in Michigan. Shows this facility's occupancy rate versus the Michigan average, with its Statewide rank out of 395. Higher occupancy signals strong local demand and financial stability.Rankings are based only on facilities in Michigan that report data for that category. Facilities without available data are excluded from the ranking.Click the rank badge to see the full State ranking.Click here to see the full State ranking.
Avg. Length of Stay
34 days
Bed community size
57-bed community Rank #255 / 435Bed count — State benchmarkedThis home is ranked 255th out of 435 homes in Michigan. Shows this facility's certified or reported bed count compared to other Michigan facilities. Larger communities may offer more amenities, programs, and on-site services for residents and families.Rankings are based only on facilities in Michigan that report data for that category. Facilities without available data are excluded from the ranking.Click the rank badge to see the full State ranking.Click here to see the full State ranking.
A moderately sized community that may balance personal attention with shared amenities and social activities.
Years in operation
51 years in operation Rank #3 / 182Years in operation — State benchmarkedThis home is ranked 3rd out of 182 homes in Michigan. Shows how long this facility has been in operation compared to other Michigan facilities. Longer operating histories may benefit residents, families, and staff.Rankings are based only on facilities in Michigan that report data for that category. Facilities without available data are excluded from the ranking.Click the rank badge to see the full State ranking.Click here to see the full State ranking.
A longer operating history, which may indicate experience navigating regulations and delivering ongoing care.
Walk Score
Walk Score: 7 / 100 Rank #636 / 703Walk Score — State benchmarkedThis home is ranked 636th out of 703 homes in Michigan. Shows how walkable this facility's neighborhood is compared to the average Walk Score across Michigan facilities. Higher scores benefit residents, families, and staff.Rankings are based only on facilities in Michigan that report data for that category. Facilities without available data are excluded from the ranking.Click the rank badge to see the full State ranking.Click here to see the full State ranking.
Car-dependent. Most errands require a car, with limited nearby walkable options.
BBB Rating
BBB Rating: A+ (Accredited)
An independent rating from the Better Business Bureau based on factors such as complaint history, transparency, and business practices.
How BBB ratings work

Safety & Compliance

Emergency SystemsYes
Safety Features24-hour security.

Staffing

Key information about the people who lead and staff this community.

Leadership

ContactMs. Kathy Harmon, Business Administrator

Therapy & Rehabilitation

2 services
Rehabilitation Services
Respite Care

Staffing & Medical

1 service
24-Hour Staffing

Additional Policies & Features

HousekeepingYes

Amenities & Lifestyle

State-Of-The-Art Fitness And Aquatic Centers
7200 Sq. Ft. Village Clubhouse
Art Gallery
Library
Woodworking Shop
Auditorium For Films And Productions
Gathering Spaces
The Village Garden
Catering Services From Our Executive Chef & Culinary Team
The Village Store Stocked With Essentials
On-Campus Salon
Guest Rooms For Family And Friends
Specific ProgramsVolunteer Opportunities, Fitness & Aquatic Centers
Religious ServicesYes

Dining & Nutrition

Food DescriptionFriendship Village provides two beautifully appointed dining spaces, including a casual café and a gracious dining room.

Contact Friendship Village – Kalamazoo

Inspection History

In Michigan, the Department of Licensing and Regulatory Affairs (LARA) conducts unannounced inspections and investigations to ensure long-term care facilities comply with state health codes.

Since 2023 · 3 years of data 21 deficiencies 4 inspections

Inspection Scorecard Info This scorecard compares key inspection, citation, and complaint metrics at this facility against the Michigan state average. Metrics rated ≥15% worse than average are highlighted in red; those ≥15% better are highlighted in green.

Since 2023 vs. Michigan state average
Overall vs. MI average 3 Worse Metrics worse than Michigan average:
• Total deficiencies (163% above)
• Deficiencies per year (159% above)
• Deficiencies per inspection (231% above)
1 Better Metrics better than Michigan average:
• Total inspections (20% below)
Latest Inspection January 23, 2025 Annual Inspection

Deficiencies Info Deficiencies are formal regulatory issues recorded during state inspections.

This FacilityMI Averagevs. MI Avg
Total deficiencies Info Formal regulatory issues recorded by inspectors across all inspection types. 218 This facility has 163% more total deficiencies than a typical Michigan nursing home (21 vs. MI avg 8).↑ 163% worse
Deficiencies per year Info Average deficiencies per year since 2023. 72.7 This facility has 159% more deficiencies per year than a typical Michigan nursing home (7 vs. MI avg 2.7).↑ 159% worse
Deficiencies per inspection Info Average deficiencies per inspection. 5.31.6 This facility has 231% more deficiencies per inspection than a typical Michigan nursing home (5.3 vs. MI avg 1.6).↑ 231% worse

Inspections Info State inspections evaluate whether the facility meets health and safety standards.

This FacilityMI Averagevs. MI Avg
Total inspections Info Combined count of all routine and focused inspections. Excludes complaint investigations. 45 This facility has 20% fewer total inspections than a typical Michigan nursing home (4 vs. MI avg 5).↓ 20% better

Health Inspection History

Inspections since 2023
Total health inspections 4

Michigan average 6.5


Last Health inspection on Jan 2025

Total health citations
21 Rank #47 / 144Health citations — State benchmarkedThis home is ranked 47th out of 144 homes in Michigan. Shows this facility's total health deficiency citations benchmarked to the Michigan State average, with a ranking across all 144 MI facilities. Lower citation counts earn a better rank.Rankings are based only on facilities in Michigan that report data for that category. Facilities without available data are excluded from the ranking.Click the rank badge to see the full State ranking.Click here to see the full State ranking.

Michigan average 33.5

Citations per inspection
5.25 Rank #81 / 144Citations per inspection — State benchmarkedThis home is ranked 81st out of 144 homes in Michigan. Shows average deficiency citations per CMS inspection for this facility versus the Michigan mean across 144 facilities with citation data. Lower is better.Rankings are based only on facilities in Michigan that report data for that category. Facilities without available data are excluded from the ranking.Click the rank badge to see the full State ranking.Click here to see the full State ranking.

Michigan average 5.18


Health citations are formal notices following inspections when they fail to comply with safety and care standards.

20 of 21 citations resulted from standard inspections; and 1 of 21 resulted from complaint investigations.

Breakdown of citation severity (last 3 years)
Critical health citations
0
100% better than Michigan average

Michigan average: 0.3


Serious health citations
0
100% better than Michigan average

Michigan average: 1.9

0 critical citations Michigan average: 0.3

0 serious citations Michigan average: 1.9

21 moderate citations Michigan average: 30.8

0 minor citations Michigan average: 0.5
Citations history (last 3 years)
Quality of Care moderate citation Jan 23, 2025
Corrected

Quality of Care moderate citation Jan 23, 2025
Corrected

Quality of Care moderate citation Jan 23, 2025
Corrected

Care Planning moderate citation Jan 23, 2025
Corrected

Staffing Data

Reporting period: October 1 – December 31, 2025 (Q4 2025). Source: CMS Payroll-Based Journal report.

Total staff 103
Employees 83
Contractors 20
Staff to resident ratio 2.71 : 1
60% more staff per resident than Michigan average
Michigan average ratio: 1.70 : 1 Michigan average ratio: 1.70 : 1See full Michigan ranking
Avg staff/day 42
Average shift 7.8 hours
0% compared with Michigan average
Michigan average: 7.9 hours Michigan average shift: 7.9 hoursSee full Michigan ranking
Total staff hours (quarter) 30,318

Nursing staff breakdown

Q4 2025 · Oct 1 – Dec 31 More info This data comes from the CMS Payroll-Based Journal report covering October 1 – December 31, 2025.
Registered Nurse

Manages medical care and health needs.

RN Staff Info All 19 RN Staff are full-time employees. No contractors work on this role. 19
Average shift length Info Average shift length. Calculated as total hours divided by days worked and average staff per day. 8.1 hours
Licensed Practical Nurse

Assists with medical care and medications.

LPN Staff Info All 5 LPN Staff are full-time employees. No contractors work on this role. 5
Average shift length Info Average shift length. Calculated as total hours divided by days worked and average staff per day. 9.9 hours
Certified Nursing Assistant

Helps with daily care and mobility.

CNA Staff Info All 45 CNA Staff are full-time employees. No contractors work on this role. 45
Average shift length Info Average shift length. Calculated as total hours divided by days worked and average staff per day. 8.2 hours

Contractor staffing

Q4 2025 · Oct 1 – Dec 31 More info This data comes from the CMS Payroll-Based Journal report covering October 1 – December 31, 2025.

Total hours from contractors

10.6%

3,218 contractor hours this quarter

Physical Therapy Assistant: 6 Speech Language Pathologist: 4 Medical Director: 3 Respiratory Therapy Technician: 2 Physical Therapy Aide: 2 Qualified Social Worker: 1 Feeding Assistant: 1 Occupational Therapy Assistant: 1

Staff by category

Q4 2025 · Oct 1 – Dec 31 More info This data comes from the CMS Payroll-Based Journal report covering October 1 – December 31, 2025.
Certified Nursing Assistant4504514,50192100%8.2
Registered Nurse190195,33092100%8.1
Other Dietary Services Staff5051,6059199%7.7
Licensed Practical Nurse5051,3608491%9.9
Clinical Nurse Specialist2029886470%7.7
RN Director of Nursing2029246975%7.4
Physical Therapy Aide0227856773%6.3
Speech Language Pathologist0447706773%5.5
Physical Therapy Assistant0666116874%6.4
Dietitian1015286672%8
Nurse Practitioner1015066470%7.9
Mental Health Service Worker1014806470%7.5
Administrator1014565762%8
Dental Services Staff1014235358%8
Feeding Assistant0113185358%6
Qualified Social Worker0113115863%5.4
Respiratory Therapy Technician0223056267%4.8
Medical Director033982022%4.9
Occupational Therapy Assistant0112055%3.9
45 Certified Nursing Assistant
% of Days 100%
19 Registered Nurse
% of Days 100%
5 Other Dietary Services Staff
% of Days 99%
5 Licensed Practical Nurse
% of Days 91%
2 Clinical Nurse Specialist
% of Days 70%
2 RN Director of Nursing
% of Days 75%
2 Physical Therapy Aide
% of Days 73%
4 Speech Language Pathologist
% of Days 73%
6 Physical Therapy Assistant
% of Days 74%
1 Dietitian
% of Days 72%
1 Nurse Practitioner
% of Days 70%
1 Mental Health Service Worker
% of Days 70%
1 Administrator
% of Days 62%
1 Dental Services Staff
% of Days 58%
1 Feeding Assistant
% of Days 58%
1 Qualified Social Worker
% of Days 63%
2 Respiratory Therapy Technician
% of Days 67%
3 Medical Director
% of Days 22%
1 Occupational Therapy Assistant
% of Days 5%

Penalties and fines

Federal penalties imposed by CMS for regulatory violations, including civil money penalties (fines) and denials of payment for new Medicare/Medicaid admissions.

Source: CMS Penalties Database

No penalties in the past 3 years

No civil money penalties or payment denials were reported in the last 3 years.

Quality of care over time

These measures show how residents usually do over time at this home, based on health outcomes and preventive care.

High-risk clinical events score Info A composite score based on pressure ulcers, falls with injury, weight loss, walking ability decline, and activities of daily living decline. 13.1
56% worse than Michigan average

Michigan average: 8.4

Functional decline score Info A composite score based on activities of daily living decline, walking ability decline, and incontinence. 31.8
95% worse than Michigan average

Michigan average: 16.3

Long-stay resident measures
Average Michigan avg: 4.1 Info CMS star rating based on long-stay quality measure performance. 5 stars = significantly above average, 1 star = significantly below average.
Need for Help with Daily Activities Increased Info Percent of long-stay residents whose need for help with daily activities has increased 15.8%
27% worse than Michigan average

Michigan average: 12.5%

Walking Ability Worsened Info Percent of long-stay residents whose ability to move independently worsened 40.6%
165% worse than Michigan average

Michigan average: 15.3%

Low Risk Residents with Bowel/Bladder Incontinence Info Percent of low risk long-stay residents who lose control of their bowels or bladder 39.0%
86% worse than Michigan average

Michigan average: 21.0%

Falls with Major Injury Info Percent of long-stay residents experiencing one or more falls with major injury 1.9%
40% better than Michigan average

Michigan average: 3.2%

High Risk Residents with Pressure Ulcers Info Percent of long-stay high risk residents with pressure ulcers 2.5%
57% better than Michigan average

Michigan average: 5.7%

Urinary Tract Infection Info Percent of long-stay residents with a urinary tract infection 2.9%
69% worse than Michigan average

Michigan average: 1.7%

Lost Too Much Weight Info Percent of long-stay residents who lose too much weight 4.8%
16% better than Michigan average

Michigan average: 5.7%

Depressive Symptoms Info Percent of long-stay residents who have depressive symptoms 0.0%
100% better than Michigan average

Michigan average: 3.9%

Antipsychotic Use Info Percent of long-stay residents who received an antipsychotic medication 17.1%
14% worse than Michigan average

Michigan average: 15.0%

Pneumococcal Vaccine Info Percent of long-stay residents assessed and appropriately given the pneumococcal vaccine 100.0%
5% better than Michigan average

Michigan average: 94.9%

Influenza Vaccine Info Percent of long-stay residents assessed and appropriately given the seasonal influenza vaccine 100.0%
5% better than Michigan average

Michigan average: 95.0%

Short-stay resident measures
Significantly above average Michigan avg: 3.3 Info CMS star rating based on short-stay quality measure performance. 5 stars = much above average, 1 star = much below average.
Pneumococcal Vaccine Info Percent of short-stay residents assessed and appropriately given the pneumococcal vaccine 99.8%
21% better than Michigan average

Michigan average: 82.5%

Antipsychotic medication increase Info Percent of short-stay residents who newly received an antipsychotic medication 0.0%
100% better than Michigan average

Michigan average: 1.4%

Influenza Vaccine Info Percent of short-stay residents assessed and appropriately given the seasonal influenza vaccine 92.6%
16% better than Michigan average

Michigan average: 79.5%

Re-hospitalized after SNF stay Info Percentage of short-stay residents who were re-hospitalized after their nursing home admission. 27.8%
15% worse than Michigan average

Michigan average: 24.2%

Emergency department visits Info Percentage of short-stay residents who had an outpatient emergency department visit. 3.4%
70% better than Michigan average

Michigan average: 11.5%

Falls with major injury Info Percentage of SNF residents who experience falls with major injury during their stay. 0.0%
100% better than Michigan average

Michigan average: 0.8%

Ability to care for self at discharge Info Percentage of residents at or above expected ability to care for themselves at discharge. 71.2%
33% better than Michigan average

Michigan average: 53.7%

Successful return to home or community Info Rate of successful return to home or community from a skilled nursing facility. 47.1%
7% worse than Michigan average

Michigan average: 50.6%

Breakdown by payment type

Medicare

27% of new residents, usually for short-term rehab.

Typical stay 14 days

Private pay

73% of new residents, often for short stays.

Typical stay 1 - 2 months

Facility Characteristics

Source: CMS Long-Term Care Facility Characteristics (Data as of Jan 2026)

Total residents 38
Medicare
15
39.5% of residents
Private pay or other
23
60.5% of residents
Programs & Services
Residents Group

Residents meet regularly to discuss policies, care quality, and activities

CCRC

Part of a Continuing Care Retirement Community offering multiple care levels

Active Resident Council

Organized group of residents that meets regularly to discuss facility policies, quality of life, and activities.

Finances and operations

Based on CMS SNF Cost Report for fiscal year ending in 09/2023.

Governmental community
Operated by a subsidized facility district.
Net patient revenue Info Net patient revenue — what the home actually collects for resident care, after contractual allowances, bad debt and discounts are subtracted from its gross charges (CMS cost report, Worksheet G-3). It covers resident care only; money the home earns from other sources is shown separately as "Other income."
$21.8M
Net patient income Info Net patient income: net patient revenue minus the home's total operating expenses. A positive figure means it earns more from resident care than it spends to deliver it; a negative figure means the opposite. It excludes non-operating "other income."
-$5.0M
Governmental community Operated by a subsidized facility district.
Net patient revenue Info Net patient revenue — what the home actually collects for resident care, after contractual allowances, bad debt and discounts are subtracted from its gross charges (CMS cost report, Worksheet G-3). It covers resident care only; money the home earns from other sources is shown separately as "Other income."
$21.8M Rank #27 / 143Revenue — State benchmarkedThis home is ranked 27th out of 143 homes in Michigan. Shows this facility's annual revenue compared to the Michigan average. Higher revenue generally means more resources for staffing and capital — read alongside Payroll %.Rankings are based only on facilities in Michigan that report data for that category. Facilities without available data are excluded from the ranking.Click the rank badge to see the full State ranking.Click here to see the full State ranking.
Net patient income Info Net patient income: net patient revenue minus the home's total operating expenses. A positive figure means it earns more from resident care than it spends to deliver it; a negative figure means the opposite. It excludes non-operating "other income."
-$5.0M
Other income Info Money the home earns outside of resident care — such as investments, grants, rentals and other non-operating sources (CMS cost report, Worksheet G-3). It is tracked separately from net patient revenue: it is not part of that figure, and it is not included in net patient income.
$3.9M
Payroll costs Info Staff salaries plus wage-related costs — benefits such as payroll taxes, health insurance and retirement — from the home's own accounting records (CMS cost report, Worksheet A). Contract or agency labor is counted separately, under other operating costs. Rank #14 / 143Payroll — State benchmarkedThis home is ranked 14th out of 143 homes in Michigan. Shows total annual staff payroll benchmarked to the Michigan average. Higher payroll investment relative to peers often signals better staffing and less reliance on cheaper contract labor.Rankings are based only on facilities in Michigan that report data for that category. Facilities without available data are excluded from the ranking.Click the rank badge to see the full State ranking.Click here to see the full State ranking.
$13.5M 62.1% of net patient revenue Info Payroll as a share of revenue: staff salaries and wage-related benefits divided by net patient revenue. A higher figure means more of each revenue dollar goes to staff pay. Rank #36 / 143Payroll % — State benchmarkedThis home is ranked 36th out of 143 homes in Michigan. Shows payroll as a percentage of revenue versus the Michigan average. Well-run Michigan facilities typically land around 49–59% — the top third Statewide. Below 25% may signal understaffing or heavy agency use — read with Staffing ratings.Rankings are based only on facilities in Michigan that report data for that category. Facilities without available data are excluded from the ranking.Click the rank badge to see the full State ranking.Click here to see the full State ranking.
Other operating costs Info Everything it costs to run the home apart from payroll — food, utilities, supplies, maintenance, contract labor and administration. Calculated as total operating expense minus payroll (staff salaries and wage-related benefits).
$13.2M
Total costs Info The home's total operating expense for the year — all the costs of running it, salaries included (CMS cost report, Worksheet G-3).
$26.8M

What does this home offer?

Pets allowed icon
Pets allowed icon

Pets Allowed

Housing options icon

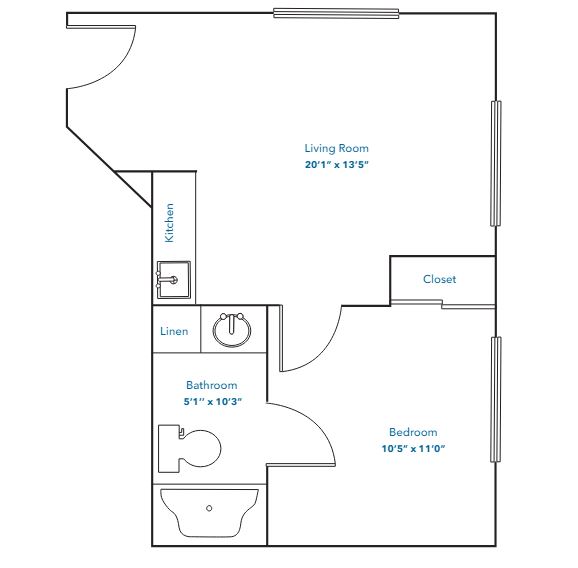
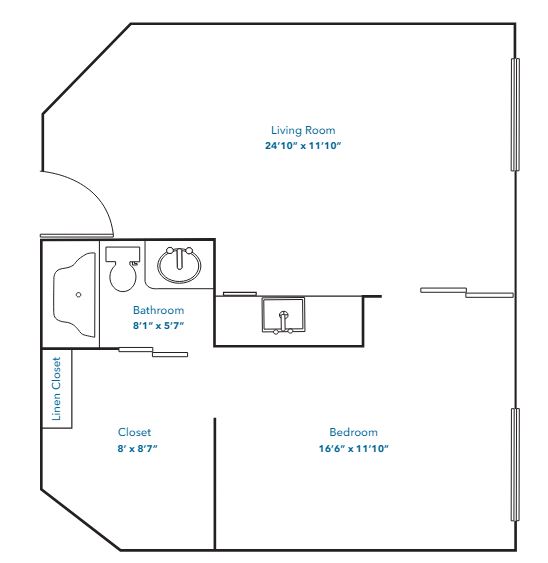
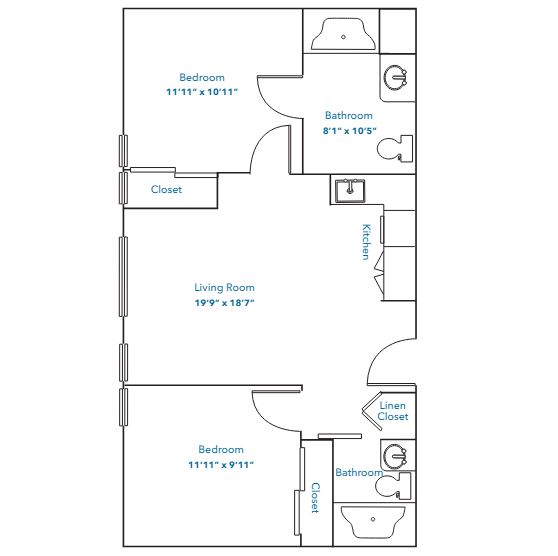
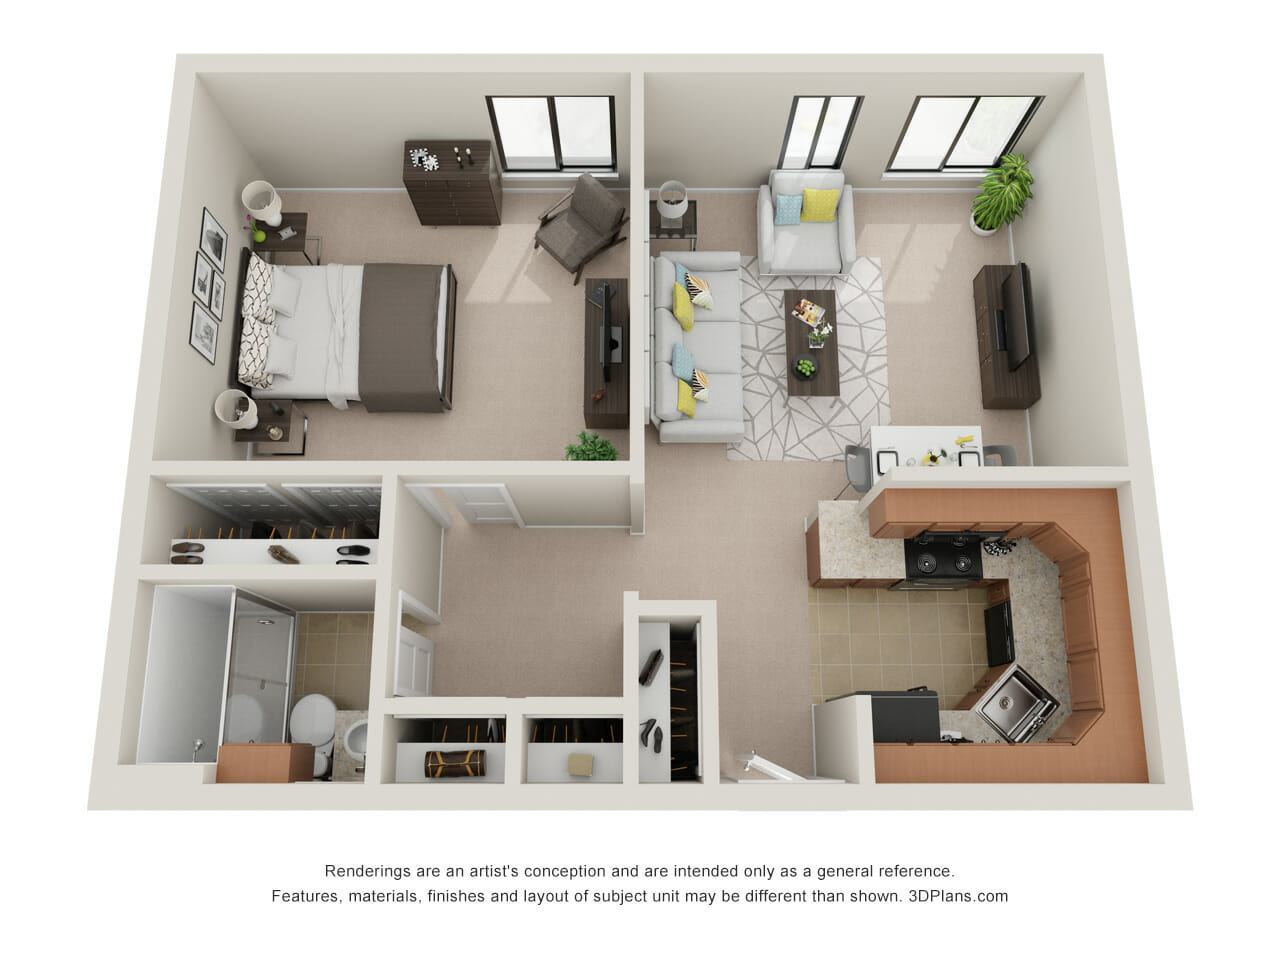
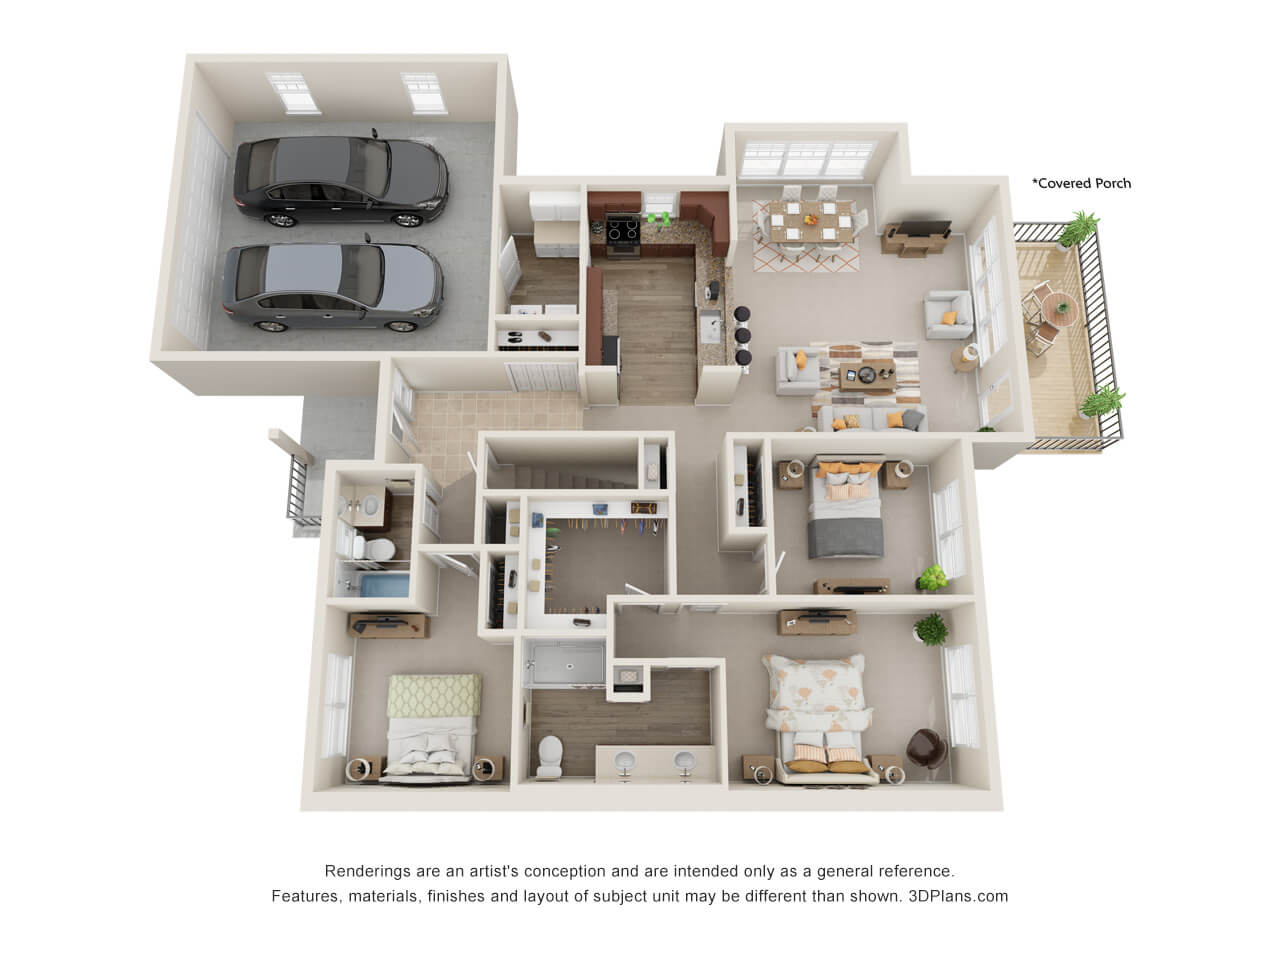
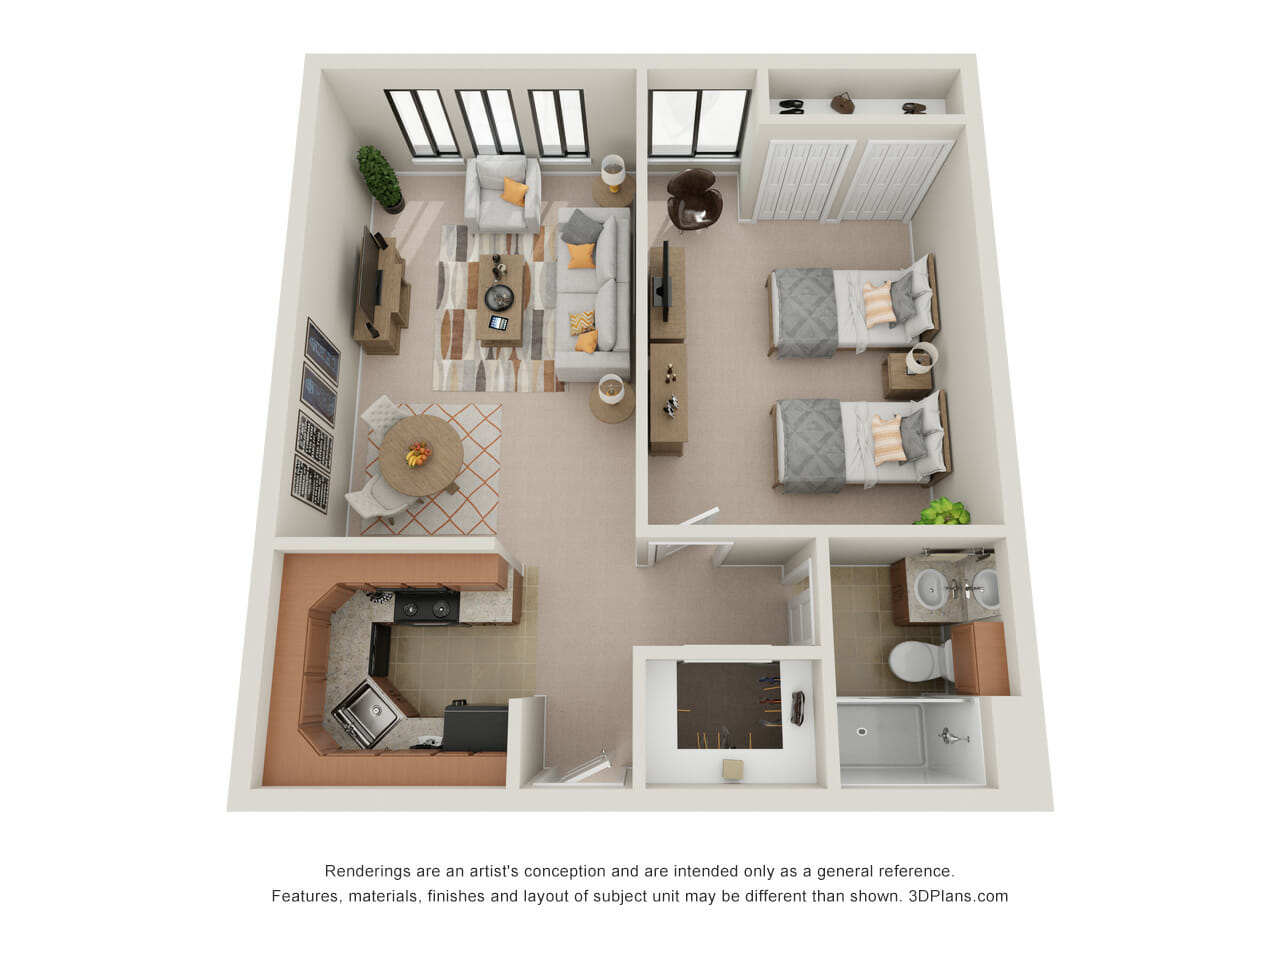
Housing Options: 1 Bed / 2 Bed

Building type icon
Building type icon

Building Type: 3-story

Transportation services icon

Transportation Services

Fitness and recreation icon

Fitness and Recreation

Who this home usually serves

TYPE OF STAY

Primarily short stays

Residents typically stay for brief periods, with frequent admissions and discharges throughout the year.

Most new residents arrive under private pay (73% of admissions), and a typical private pay stay runs around 1 - 2 months.

Admissions
376 total

Coverage residents most often arrive under.

Medicare 27%
Private pay 73%
Discharges
385 total

Coverage residents most often leave under.

Medicare 23%
Private pay 77%

Managed by David Riser

Administrator

David Riser is the Administrator at Friendship Village - Kalamazoo, having been promoted to this leadership role in February 2024. He previously served as Associate Executive Director and has experience at other Life Care Services managed communities. David holds a Bachelor of Business Administration from Northwood University and is a Licensed Nursing Home Administrator in both Florida and Michigan.

Living Spaces & Floor Plans for Friendship Village – Kalamazoo

Friendship Village Kalamazoo 1Bed B
Friendship Village Kalamazoo 1Bed
Friendship Village Kalamazoo 2Bed
Finch Garden Home
Finch Garden Home
Starling Village Apartment
Wren Garden Home
Wren Garden Home
Cardinal Village Apartment

Places of interest near Friendship Village – Kalamazoo

Address 4.3 miles from city center Info Estimated distance in miles from Kalamazoo's city center to Friendship Village – Kalamazoo's address, calculated via Google Maps. — 0.82 miles to nearest hospital (Bronson Kalamazoo)

Calculate Travel Distance to Friendship Village – Kalamazoo

Add your location

Address

Compare Nursing Homes around Kalamazoo

The information below is reported by the Michigan Department of Licensing and Regulatory Affairs (LARA).

4 facilities compared · CMS & MI Dept. of Health data

Friendship Village – Kalamazoo
NH
AL
IL
MC
Kalamazoo
57
Facility 57
MI AVG 75
Rank #255 / 435
63.1%
Facility 63.1%
MI AVG 75.8%
Rank #155 / 395
-17%
5.72
Facility 5.72
MI AVG 4.30
Rank #8 / 142
+80%+33%
$0
Facility $0
MI AVG $87.6k
Rank #1 / 145
21
Facility 21
MI AVG 33.5
Rank #47 / 144
5.3
Facility 5.3
MI AVG 5.2
Rank #81 / 144
-50A+
7
Facility 7
MI AVG 39
Rank #636 / 703
Timothy Cain
$21.8M
Facility $21.8M
MI AVG $15.8M
Rank #27 / 143
$13.5M
Facility $13.5M
MI AVG $5.6M
Rank #14 / 143
62.1%
Facility 62.1%
MI AVG 39%
Rank #36 / 143
235248
Heritage Community of Kalamazoo
NH
AL
MC
Kalamazoo (Milwood)
39
Facility 39
MI AVG 75
Rank #298 / 435
--
5.44
Facility 5.44
MI AVG 4.30
Rank #16 / 142
+123%+27%
$0
Facility $0
MI AVG $87.6k
Rank #1 / 145
22
Facility 22
MI AVG 33.5
Rank #50 / 144
7.3
Facility 7.3
MI AVG 5.2
Rank #113 / 144
-37-
61
Facility 61
MI AVG 39
Rank #125 / 703
----235074
Medilodge of Kalamazoo
NH
HC
MC
NC
PC
RC
Kalamazoo (Oshtemo Charter Township)
39
Facility 39
MI AVG 75
Rank #298 / 435
96.4%
Facility 96.4%
MI AVG 75.8%
Rank #10 / 395
+27%
3.90
Facility 3.90
MI AVG 4.30
Rank #77 / 142
+38%-9%
$0
Facility $0
MI AVG $87.6k
Rank #1 / 145
20
Facility 20
MI AVG 33.5
Rank #40 / 144
4.0
Facility 4.0
MI AVG 5.2
Rank #43 / 144
237-
34
Facility 34
MI AVG 39
Rank #379 / 703
-
$4.4M
Facility $4.4M
MI AVG $15.8M
Rank #137 / 143
$2.7M
Facility $2.7M
MI AVG $5.6M
Rank #138 / 143
62.5%
Facility 62.5%
MI AVG 39%
Rank #75 / 143
235282
Medilodge of Westwood
NH
Kalamazoo
97
Facility 97
MI AVG 75
Rank #142 / 435
82.0%
Facility 82.0%
MI AVG 75.8%
Rank #75 / 395
+8%
3.66
Facility 3.66
MI AVG 4.30
Rank #108 / 142
+13%-15%
$129.2k
Facility $129.2k
MI AVG $87.6k
Rank #133 / 145
84
Facility 84
MI AVG 33.5
Rank #143 / 144
12.0
Facility 12.0
MI AVG 5.2
Rank #144 / 144
686-
5
Facility 5
MI AVG 39
Rank #647 / 703
-
$9.2M
Facility $9.2M
MI AVG $15.8M
Rank #91 / 143
$5.1M
Facility $5.1M
MI AVG $5.6M
Rank #104 / 143
55.7%
Facility 55.7%
MI AVG 39%
Rank #90 / 143
235542

Financial Assistance for
Nursing Home in Michigan

Friendship Village – Kalamazoo is located in Kalamazoo, Michigan.
Here are the financial assistance programs available to residents in Michigan.

Get Financial aid guidance

MI Choice Waiver

Michigan Medicaid MI Choice Waiver

Age 65+ or disabled
General Michigan resident, Medicaid- eligible, nursing home-level care need.
Income Limits (2025) ~$2,829/month 300% FBR, individual
Asset Limits $2,000 (individual), $3,000 (couple).
MI

Delivered through regional waiver agents; waitlists possible.

Benefits
Personal care (5-7 hours/day) Respite care (240 hours/year) Home modifications ($1,500 avg.) Adult day care ($65/day)

Home Help Program

Michigan Home Help

Age 65+ or disabled
General Michigan resident, Medicaid- eligible or low-income.
Income Limits ~$1,732/month individual, Medicaid threshold
Asset Limits $2,000 individual
MI

Can hire family caregivers; less intensive than waiver.

Benefits
Personal care (up to 60 hours/month) Homemaker services Respite (varies)

Program of All-Inclusive Care for the Elderly (PACE)

Michigan PACE

Age 55+
General Michigan resident, nursing home-level care need, safe with PACE support.
Income Limits (2025) ~$2,829/month (Medicaid-eligible); private pay option available.
Asset Limits $2,000 (individual), $3,000 (couple).
MI

16 PACE centers (e.g., Ingham, Wayne counties); expanding slowly.

Benefits
Personal care (5-7 hours/day) Medical care Meals Transportation Therapy Respite

Medicare Savings Program (MSP)

Michigan Medicare Savings Program

Age 65+ or disabled
General Michigan resident, Medicare Part A/B.
Income Limits (2025) ~$2,510/month (QMB), ~$3,380/month (SLMB), ~$3,598/month (QI)—individual.
Asset Limits $9,430 (individual), $14,130 (couple).
MI

Three tiers; no waitlist; includes Extra Help for Part D.

Benefits
Covers Part B premiums ($174.70/month) Deductibles ($240/year) Copays (~20%)

National Family Caregiver Support Program (NFCSP) Respite

Michigan NFCSP Respite Care

Age
General Caregivers of 60+ needing care or 55+ caregivers of others; Michigan resident; functional needs (2+ ADLs).
Income Limits (2025) Prioritizes ~$24,980/year (individual); no strict cap.
Asset Limits Not assessed; need-based.
MI

16 AAAs; prioritizes low-income, rural caregivers.

Benefits
Respite (4-6 hours/week or 5 days/year) Adult day care ($60/day) Caregiver training

VA Aid and Attendance (A&A) and Housebound Benefits

Michigan VA Aid and Attendance/Housebound

Age 65+ or disabled veteran/spouse
General Michigan resident, wartime service, need for ADL help (A&A) or homebound.
Income Limits (2025) Net income < ~$1,984/month (veteran with dependent, A&A); pension offsets income.
Asset Limits ~$155,356 net worth limit
MI

High veteran demand in urban/rural areas.

Benefits
Cash (~$1,433-$2,642/month veteran, ~$951-$1,318 spouse) for care costs

Frequently Asked Questions about Friendship Village – Kalamazoo

Is Friendship Village – Kalamazoo in a walkable area?

Friendship Village – Kalamazoo has a walk score of 7. Car-dependent. Most errands require a car, with limited nearby walkable options.

What is the occupancy rate at Friendship Village – Kalamazoo?

Friendship Village – Kalamazoo's occupancy is 63.1%.

Does Friendship Village – Kalamazoo have different floorplan options?

Yes — see the floorplan options available at Friendship Village – Kalamazoo on this page.

Are there photos of Friendship Village – Kalamazoo?

Yes — there are 5 photos of Friendship Village – Kalamazoo in the photo gallery on this page.

What is the address of Friendship Village – Kalamazoo?

Friendship Village – Kalamazoo is located at 1400 N Drake Rd, Kalamazoo, MI 49006.

What is the phone number of Friendship Village – Kalamazoo?

(269) 381-0560 will put you in contact with the team at Friendship Village – Kalamazoo.

Is Friendship Village – Kalamazoo Medicare or Medicaid certified?

Yes — Friendship Village – Kalamazoo is a CMS-certified provider of Medicare and Medicaid.

Guides for Better Senior Living

Care Cost Calculator: See Prices in Your Area

Nursing Home Data Explorer

Don’t Wait Too Long: 7 Red Flag Signs Your Parent Needs Assisted Living Now

The True Cost of Assisted Living in 2025 – And How Families Are Paying For It

Understanding Senior Living Costs: Pricing Models, Discounts & Financial Assistance