The Grand of Dublin
Nursing Home, Assisted Living, Independent Living, Memory Care & Respite Care · Dublin, OH
CMS overall rating Info CMS (the Centers for Medicare & Medicaid Services) is the federal agency that rates nursing home quality. Its Overall Rating runs from 1 to 5 stars, combining health inspections, staffing, and quality measures, with inspections weighted most heavily.

The Grand of Dublin

Nursing Home, Assisted Living, Independent Living, Memory Care & Respite Care · Dublin, OH
CMS overall rating Info CMS (the Centers for Medicare & Medicaid Services) is the federal agency that rates nursing home quality. Its Overall Rating runs from 1 to 5 stars, combining health inspections, staffing, and quality measures, with inspections weighted most heavily.
Calculator: See prices in your area
The Grand of Dublin accepts Medicare, Medicaid, and private pay.

Overview of The Grand of Dublin

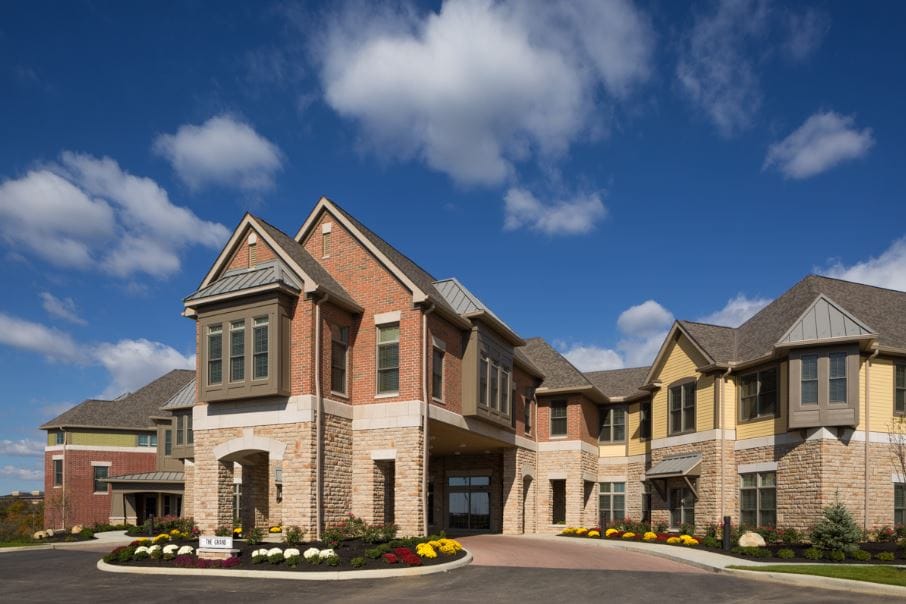
Tucked in the harmonious neighborhood of John Shields Parkway, Dublin, OH, The Grand of Dublin is an astounding senior living community providing rehabilitation and therapy, skilled nursing, memory care, respite care, and hospice care. Enjoy comfort and convenience within the carefully crafted and spacious residences of The Grand of Dublin in variation of private and semi-private rooms. The community strives to deliver the highest quality of care and support for seniors to thrive and reach their full potential.

Enjoy a wide array of engaging activities and exciting programs for leisure and wellness. Have a delightful dining experience with delicious and healthy meals catering to dietary needs and preferences. Surrounded by stunning landscapes and serene spaces, The Grand of Dublin is great for seniors seeking to live a relaxing retirement.

Quality ratings

Measured by Centers for Medicare & Medicaid Services (CMS)

Overall rating Info The Overall CMS Rating combines results from health inspections, staffing levels and quality measures. Health inspections carry the most weight. Staffing and quality scores can increase or decrease the final rating based on performance compared to state and national standards.
Health Inspection Info Based on the results of the facility's three most recent standard inspections and any complaint investigations. CMS reviews the number, scope, and severity of deficiencies, with more recent findings weighted more heavily.
Staffing Info Measures average nursing staff hours per resident per day, including Registered Nurses (RNs) and total nursing staff. Ratings are adjusted based on the level of care residents require and are compared to state and national benchmarks.
Quality Measures Info Based on clinical and physical health indicators reported to CMS, such as hospital readmissions, falls, pressure ulcers, and improvements in mobility. These measures reflect how well residents' health needs are being managed.

Staffing hours breakdown

Info Daily nursing hours per resident by staff type, reported to CMS. Higher is generally better — compare this facility to state and national averages to see where staffing stands.

Hours per resident per day — compared to state averages

Total nursing care / resident Info Total adjusted nursing hours per resident per day, combining RN, LPN, and aide time. CMS adjusts this for case-mix so facilities can be fairly compared.
3h 50m per day
Rank #60 / 210Nurse hours — State benchmarkedThis home is ranked 60th out of 210 homes in Ohio. Shows adjusted nurse hours per resident per day benchmarked to the Ohio average, with a ranking across 210 Ohio facilities. More hours mean more direct care. The national average is about 3.5 hrs; below 3.0 is a red flag.Rankings are based only on facilities in Ohio that report data for that category. Facilities without available data are excluded from the ranking.Click the rank badge to see the full State ranking.Click here to see the full State ranking.
vs avg

0 of 6 metrics below state avg

Standout metric Physical Therapist is +92% above state avg
Staff typeHours / Day / Residentvs state avg
Registered Nurse (RN) Info RNs hold the highest nursing license and can assess residents, interpret test results, and direct care plans. More RN hours per day often signals stronger clinical oversight and faster response to health changes. 40m per day ▲ 4% State avg: 38m per day · National avg: 41m per day
LPN / LVN Info Licensed Practical Nurses (LPNs) or Licensed Vocational Nurses (LVNs) deliver routine hands-on care — medication administration, wound dressing, and monitoring vital signs. They work under RN supervision and make up a large share of daily bedside care. 57m per day ■ Avg State avg: 58m per day · National avg: 52m per day
Nurse Aide Info Certified Nurse Aides (CNAs) provide the most direct day-to-day assistance: bathing, dressing, feeding, and mobility. Nurse aide hours are typically the largest staffing category and directly affect residents' quality of life. 2h 16m per day ▲ 7% State avg: 2h 8m per day · National avg: 2h 21m per day
Weekend Total Nursing Info Combined nursing hours (RN + LPN + Nurse Aide) per resident per day on weekends. Staffing often drops on weekends — this figure reveals whether the facility maintains adequate coverage outside of weekday hours. 3h 39m per day ▲ 11% State avg: 3h 17m per day · National avg: 3h 26m per day
Physical Therapist Info Hours per resident per day provided by licensed Physical Therapists (PTs) or PT Assistants. PT services help residents recover mobility after injury or illness and are especially important for post-acute (short-stay) rehabilitation. 6m per day ▲ 92% State avg: 3m per day · National avg: 4m per day
Weekend RN Info Registered nurse hours specifically on weekends. Facilities sometimes reduce RN presence on Saturdays and Sundays — a low weekend RN figure compared to weekday hours can indicate reduced clinical oversight when most administrative staff are absent. 32m per day ▲ 28% State avg: 25m per day · National avg: 29m per day

Capacity and availability

This home usually has availability

Lower occupancy than the state average
Occupancy rate
83.1% Rank #121 / 211Occupancy rate — State benchmarkedThis home is ranked 121st out of 211 homes in Ohio. Shows this facility's occupancy rate versus the Ohio average, with its Statewide rank out of 211. Higher occupancy signals strong local demand and financial stability.Rankings are based only on facilities in Ohio that report data for that category. Facilities without available data are excluded from the ranking.Click the rank badge to see the full State ranking.Click here to see the full State ranking.
Avg. Length of Stay
64 days
Bed community size
128-bed community Rank #36 / 323Bed count — State benchmarkedThis home is ranked 36th out of 323 homes in Ohio. Shows this facility's certified or reported bed count compared to other Ohio facilities. Larger communities may offer more amenities, programs, and on-site services for residents and families.Rankings are based only on facilities in Ohio that report data for that category. Facilities without available data are excluded from the ranking.Click the rank badge to see the full State ranking.Click here to see the full State ranking.
A larger shared setting that may offer more common spaces and organized community services.
Walk Score
Walk Score: 37 / 100 Rank #386 / 705Walk Score — State benchmarkedThis home is ranked 386th out of 705 homes in Ohio. Shows how walkable this facility's neighborhood is compared to the average Walk Score across Ohio facilities. Higher scores benefit residents, families, and staff.Rankings are based only on facilities in Ohio that report data for that category. Facilities without available data are excluded from the ranking.Click the rank badge to see the full State ranking.Click here to see the full State ranking.
Somewhat walkable. A few nearby services may be reachable on foot, but most trips require transportation.

Contact The Grand of Dublin

Staffing Data

Reporting period: October 1 – December 31, 2025 (Q4 2025). Source: CMS Payroll-Based Journal report.

Total staff 160
Employees 140
Contractors 20
Staff to resident ratio 1.74 : 1
0% compared with State average

State average ratio: 0 : 0

Avg staff/day 63
Average shift 8.6 hours
0% compared with State average

State average: 0 hours

Total staff hours (quarter) 49,798

Nursing staff breakdown

Q4 2025 · Oct 1 – Dec 31 More info This data comes from the CMS Payroll-Based Journal report covering October 1 – December 31, 2025.
Registered Nurse

Manages medical care and health needs.

RN Staff Info All 23 RN Staff are full-time employees. No contractors work on this role. 23
Average shift length Info Average shift length. Calculated as total hours divided by days worked and average staff per day. 9.7 hours
Licensed Practical Nurse

Assists with medical care and medications.

LPN Staff Info All 21 LPN Staff are full-time employees. No contractors work on this role. 21
Average shift length Info Average shift length. Calculated as total hours divided by days worked and average staff per day. 9.2 hours
Certified Nursing Assistant

Helps with daily care and mobility.

CNA Staff Info All 71 CNA Staff are full-time employees. No contractors work on this role. 71
Average shift length Info Average shift length. Calculated as total hours divided by days worked and average staff per day. 9.4 hours

Contractor staffing

Q4 2025 · Oct 1 – Dec 31 More info This data comes from the CMS Payroll-Based Journal report covering October 1 – December 31, 2025.

Total hours from contractors

8.2%

4,091 contractor hours this quarter

Physical Therapy Aide: 6 Speech Language Pathologist: 5 Respiratory Therapy Technician: 4 Physical Therapy Assistant: 4 Qualified Social Worker: 1

Staff by category

Q4 2025 · Oct 1 – Dec 31 More info This data comes from the CMS Payroll-Based Journal report covering October 1 – December 31, 2025.
Certified Nursing Assistant7107124,12092100%9.4
Licensed Practical Nurse210217,82692100%9.2
Registered Nurse230235,98592100%9.7
RN Director of Nursing6062,3197683%8.1
Other Dietary Services Staff4041,6219199%7.8
Physical Therapy Aide0661,3388087%6
Respiratory Therapy Technician0441,0217076%5.8
Dental Services Staff5051,0177076%7.5
Speech Language Pathologist0558946975%5.1
Physical Therapy Assistant0446037379%5
Clinical Nurse Specialist2025575964%7.9
Administrator1014806065%8
Dietitian1014806065%8
Nurse Practitioner1014725964%8
Occupational Therapy Aide2024725054%9.4
Mental Health Service Worker3033584347%7
Qualified Social Worker0112356470%3.7
71 Certified Nursing Assistant
% of Days 100%
21 Licensed Practical Nurse
% of Days 100%
23 Registered Nurse
% of Days 100%
6 RN Director of Nursing
% of Days 83%
4 Other Dietary Services Staff
% of Days 99%
6 Physical Therapy Aide
% of Days 87%
4 Respiratory Therapy Technician
% of Days 76%
5 Dental Services Staff
% of Days 76%
5 Speech Language Pathologist
% of Days 75%
4 Physical Therapy Assistant
% of Days 79%
2 Clinical Nurse Specialist
% of Days 64%
1 Administrator
% of Days 65%
1 Dietitian
% of Days 65%
1 Nurse Practitioner
% of Days 64%
2 Occupational Therapy Aide
% of Days 54%
3 Mental Health Service Worker
% of Days 47%
1 Qualified Social Worker
% of Days 70%

Penalties and fines

Federal penalties imposed by CMS for regulatory violations, including civil money penalties (fines) and denials of payment for new Medicare/Medicaid admissions.

Source: CMS Penalties Database (Data as of Jan 2026)

Total fines amount $63K Rank #1 / 211Federal fines — State benchmarkedThis home is ranked 1st out of 211 homes in Ohio. Shows this facility's cumulative CMS federal fine dollars versus the Ohio average among facilities with fines, and where it ranks among 211 facilities in the pool. Lower total dollars mean a better rank.Rankings are based only on facilities in Ohio that report data for that category. Facilities without available data are excluded from the ranking.Click the rank badge to see the full State ranking.Click here to see the full State ranking.
8% lower than State average

State average: $69K

Number of fines 1
46% fewer fines than State average

State average: 1.9

Payment Denials Info Serious action where Medicare and/or Medicaid temporarily stops payments for new residents until issues are fixed. 0
100% fewer payment denials than State average

State average: 0.5

Fines amount comparison
This facility $63K
State average $69K

No penalties in the past 3 years

No civil money penalties or payment denials were reported in the last 3 years.

Quality of care over time

These measures show how residents usually do over time at this home, based on health outcomes and preventive care.

High-risk clinical events score Info A composite score based on pressure ulcers, falls with injury, weight loss, walking ability decline, and activities of daily living decline. 6.3
8% worse than State average

State average: 5.8

Functional decline score Info A composite score based on activities of daily living decline, walking ability decline, and incontinence. 14.7
16% worse than State average

State average: 12.7

Long-stay resident measures
Significantly above average State avg: 4.7 Info CMS star rating based on long-stay quality measure performance. 5 stars = significantly above average, 1 star = significantly below average.
Need for Help with Daily Activities Increased Info Percent of long-stay residents whose need for help with daily activities has increased 8.0%
17% worse than State average

State average: 6.8%

Walking Ability Worsened Info Percent of long-stay residents whose ability to move independently worsened 10.3%
16% worse than State average

State average: 8.9%

Low Risk Residents with Bowel/Bladder Incontinence Info Percent of low risk long-stay residents who lose control of their bowels or bladder 25.9%
18% worse than State average

State average: 22.0%

Falls with Major Injury Info Percent of long-stay residents experiencing one or more falls with major injury 3.3%
In line with State average

State average: 3.4%

High Risk Residents with Pressure Ulcers Info Percent of long-stay high risk residents with pressure ulcers 4.8%
23% worse than State average

State average: 3.9%

Urinary Tract Infection Info Percent of long-stay residents with a urinary tract infection 0.0%
100% better than State average

State average: 0.5%

Lost Too Much Weight Info Percent of long-stay residents who lose too much weight 5.1%
17% better than State average

State average: 6.2%

Depressive Symptoms Info Percent of long-stay residents who have depressive symptoms 19.6%
19% better than State average

State average: 24.0%

Antipsychotic Use Info Percent of long-stay residents who received an antipsychotic medication 12.3%
46% worse than State average

State average: 8.4%

Pneumococcal Vaccine Info Percent of long-stay residents assessed and appropriately given the pneumococcal vaccine 97.4%
5% better than State average

State average: 92.4%

Influenza Vaccine Info Percent of long-stay residents assessed and appropriately given the seasonal influenza vaccine 92.1%
In line with State average

State average: 94.5%

Hospitalizations per 1,000 days Info Number of hospitalizations per 1,000 long-stay resident days. 1.10
38% better than State average

State average: 1.77

ED visits per 1,000 days Info Number of outpatient emergency department visits per 1,000 long-stay resident days. 0.00
100% better than State average

State average: 1.83

Short-stay resident measures
Significantly above average State avg: 2.4 Info CMS star rating based on short-stay quality measure performance. 5 stars = much above average, 1 star = much below average.
Pneumococcal Vaccine Info Percent of short-stay residents assessed and appropriately given the pneumococcal vaccine 98.9%
27% better than State average

State average: 78.0%

Antipsychotic medication increase Info Percent of short-stay residents who newly received an antipsychotic medication 0.4%
68% better than State average

State average: 1.3%

Influenza Vaccine Info Percent of short-stay residents assessed and appropriately given the seasonal influenza vaccine 97.9%
30% better than State average

State average: 75.6%

Re-hospitalized after SNF stay Info Percentage of short-stay residents who were re-hospitalized after their nursing home admission. 36.9%
47% worse than State average

State average: 25.1%

Emergency department visits Info Percentage of short-stay residents who had an outpatient emergency department visit. 6.5%
48% better than State average

State average: 12.5%

Falls with major injury Info Percentage of SNF residents who experience falls with major injury during their stay. 0.8%
In line with State average

State average: 0.8%

Ability to care for self at discharge Info Percentage of residents at or above expected ability to care for themselves at discharge. 65.8%
23% better than State average

State average: 53.7%

Successful return to home or community Info Rate of successful return to home or community from a skilled nursing facility. 51.4%
In line with State average

State average: 50.6%

Breakdown by payment type

Medicare

24% of new residents, usually for short-term rehab.

Typical stay 1 - 2 months

Private pay

56% of new residents, often for short stays.

Typical stay 2 - 3 months

Medicaid

19% of new residents, often for long-term daily care.

Typical stay 1 - 2 months

Facility Characteristics

Source: CMS Long-Term Care Facility Characteristics (Data as of Jan 2026)

Total residents 92
Medicare
12
13% of residents
Medicaid
63
68.5% of residents
Private pay or other
17
18.5% of residents
Programs & Services
Residents Group

Residents meet regularly to discuss policies, care quality, and activities

Family Member Group

Family members meet regularly to discuss policies, care quality, and activities

Active Family Council

Organized group of family members that meets regularly to discuss facility policies, resident care, and activities.

Active Resident Council

Organized group of residents that meets regularly to discuss facility policies, quality of life, and activities.

Finances and operations

Based on CMS SNF Cost Report for fiscal year ending in 12/2023.

For-profit
Corporation
Net patient revenue Info Net patient revenue — what the home actually collects for resident care, after contractual allowances, bad debt and discounts are subtracted from its gross charges (CMS cost report, Worksheet G-3). It covers resident care only; money the home earns from other sources is shown separately as "Other income."
$10.5M
Net patient income Info Net patient income: net patient revenue minus the home's total operating expenses. A positive figure means it earns more from resident care than it spends to deliver it; a negative figure means the opposite. It excludes non-operating "other income."
-$2.8M
For-profit Corporation
Net patient revenue Info Net patient revenue — what the home actually collects for resident care, after contractual allowances, bad debt and discounts are subtracted from its gross charges (CMS cost report, Worksheet G-3). It covers resident care only; money the home earns from other sources is shown separately as "Other income."
$10.5M Rank #47 / 210Revenue — State benchmarkedThis home is ranked 47th out of 210 homes in Ohio. Shows this facility's annual revenue compared to the Ohio average. Higher revenue generally means more resources for staffing and capital — read alongside Payroll %.Rankings are based only on facilities in Ohio that report data for that category. Facilities without available data are excluded from the ranking.Click the rank badge to see the full State ranking.Click here to see the full State ranking.
Net patient income Info Net patient income: net patient revenue minus the home's total operating expenses. A positive figure means it earns more from resident care than it spends to deliver it; a negative figure means the opposite. It excludes non-operating "other income."
-$2.8M
Other income Info Money the home earns outside of resident care — such as investments, grants, rentals and other non-operating sources (CMS cost report, Worksheet G-3). It is tracked separately from net patient revenue: it is not part of that figure, and it is not included in net patient income.
$297.0K
Payroll costs Info Staff salaries plus wage-related costs — benefits such as payroll taxes, health insurance and retirement — from the home's own accounting records (CMS cost report, Worksheet A). Contract or agency labor is counted separately, under other operating costs. Rank #52 / 210Payroll — State benchmarkedThis home is ranked 52nd out of 210 homes in Ohio. Shows total annual staff payroll benchmarked to the Ohio average. Higher payroll investment relative to peers often signals better staffing and less reliance on cheaper contract labor.Rankings are based only on facilities in Ohio that report data for that category. Facilities without available data are excluded from the ranking.Click the rank badge to see the full State ranking.Click here to see the full State ranking.
$6.0M 57.7% of net patient revenue Info Payroll as a share of revenue: staff salaries and wage-related benefits divided by net patient revenue. A higher figure means more of each revenue dollar goes to staff pay. Rank #144 / 210Payroll % — State benchmarkedThis home is ranked 144th out of 210 homes in Ohio. Shows payroll as a percentage of revenue versus the Ohio average. Well-run Ohio facilities typically land around 54–64% — the top third Statewide. Below 25% may signal understaffing or heavy agency use — read with Staffing ratings.Rankings are based only on facilities in Ohio that report data for that category. Facilities without available data are excluded from the ranking.Click the rank badge to see the full State ranking.Click here to see the full State ranking.
Other operating costs Info Everything it costs to run the home apart from payroll — food, utilities, supplies, maintenance, contract labor and administration. Calculated as total operating expense minus payroll (staff salaries and wage-related benefits).
$7.3M
Total costs Info The home's total operating expense for the year — all the costs of running it, salaries included (CMS cost report, Worksheet G-3).
$13.3M

What does this home offer?

Housing options icon

Housing Options: Suite

Building type icon
Building type icon

Building Type: 2-story

Transportation services icon

Transportation Services

Fitness and recreation icon

Fitness and Recreation

Who this home usually serves

TYPE OF STAY

Mix of rehab and long-term care

This home supports both short-term rehab and long-term care, with residents staying for a wide range of durations.

Most new residents arrive under private pay (56% of admissions), and a typical private pay stay runs around 2 - 3 months.

Admissions
466 total

Coverage residents most often arrive under.

Medicare 24%
Private pay 56%
Medicaid 19%
Discharges
472 total

Coverage residents most often leave under.

Medicare 27%
Private pay 56%
Medicaid 17%

Places of interest near The Grand of Dublin

Address 1.7 miles from city center Info Estimated distance in miles from Dublin's city center to The Grand of Dublin's address, calculated via Google Maps.

Calculate Travel Distance to The Grand of Dublin

Add your location

Address

Compare Nursing Homes around the area

The information below is reported by the Ohio Department of Health, Bureau of Survey and Certification.

The Grand of Dublin
NH
AL
IL
MC
RC
Dublin (John Shields Parkway) -128 - 37 Suite
Beachwood Commons by New Perspective
NH
AL
IL
MC
Beachwood -120 A+ 15 Studio / 1 Bed
Brookdale Westlake Village
NH
AL
IL
MC
Westlake -60 A+ 25 1 Bed / 2 Bed
Elizabeth Scott Community
NH
AL
MC
Maumee -60 A+ 0 Studio / 1 Bed
Genoa Retirement Village
NH
AL
IL
MC
Genoa -68 A+ 17 Studio / 1 Bed / 2 Bed

Frequently Asked Questions about The Grand of Dublin

What neighborhood is The Grand of Dublin in?

The Grand of Dublin is in the John Shields Parkway neighborhood.

Is The Grand of Dublin in a walkable area?

The Grand of Dublin has a walk score of 37. Somewhat walkable. A few nearby services may be reachable on foot, but most trips require transportation.

What is the occupancy rate at The Grand of Dublin?

The Grand of Dublin's occupancy is 83.1%.

Does The Grand of Dublin operate as a for-profit or non-profit?

The Grand of Dublin is registered as a for-profit.

Are there photos of The Grand of Dublin?

Yes — there are 4 photos of The Grand of Dublin in the photo gallery on this page.

What is the address of The Grand of Dublin?

The Grand of Dublin is located at 4500 John Shields Pkwy, Dublin, OH 43017.

What is the phone number of The Grand of Dublin?

(614) 889-8585 will put you in contact with the team at The Grand of Dublin.

Guides for Better Senior Living

Care Cost Calculator: See Prices in Your Area

Nursing Home Data Explorer

Don’t Wait Too Long: 7 Red Flag Signs Your Parent Needs Assisted Living Now

The True Cost of Assisted Living in 2025 – And How Families Are Paying For It

Understanding Senior Living Costs: Pricing Models, Discounts & Financial Assistance