


Total health inspections
4
State average 6.7
Last Health inspection on Sep 2024
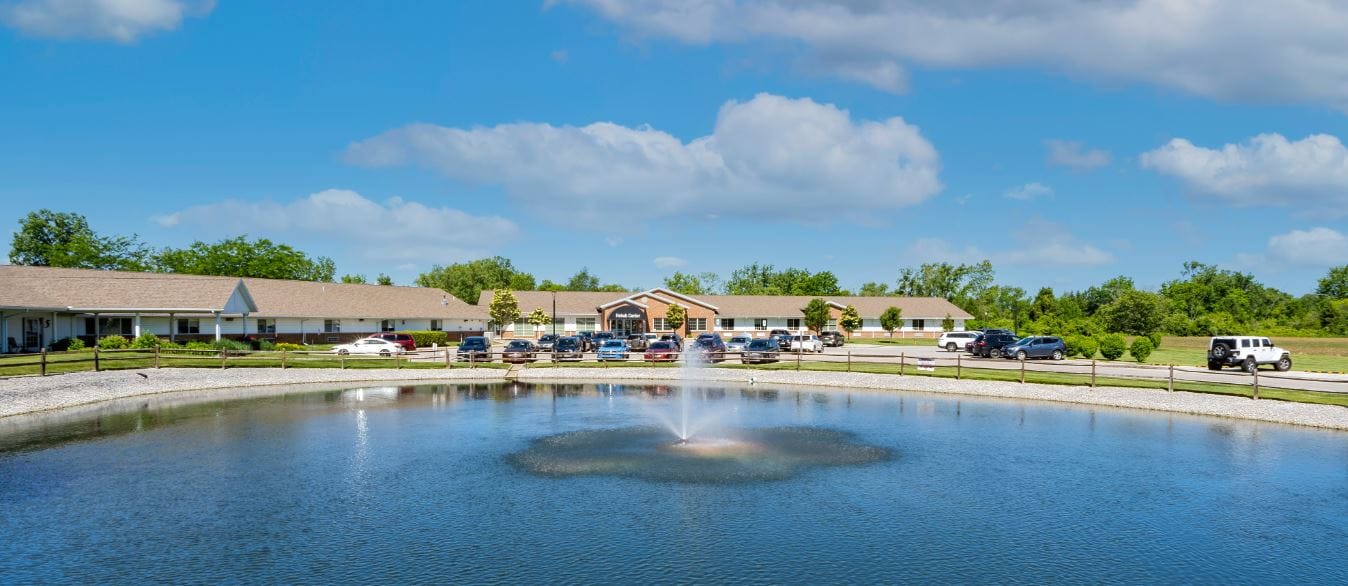


Elizabeth Scott Community is a reliable senior living community based in Lucas County, Maumee, OH, offering various levels of care to accommodate residents’ changing needs. These include independent living, assisted living, enhanced living for memory care residents, skilled nursing, rehabilitation, and temporary stays. Residents reside in comfortable, private, luxury suites while receiving 24/7 licensed care, monitoring, and supervision. The community also handles all of the heavy lifting by providing housekeeping and maintenance services.
As a family-owned community, Elizabeth Scott makes sure residents receive person-centered team care in a harmonious environment. Organized activities and exercise programs, including off-site excursions are provided to keep residents entertained, happy, and active. A registered dietitian is also on-site to make sure residents are provided with the nourishment they need to stay healthy. With 24/7 care, secured community spaces, and extensive array of services, residents here are guaranteed to live a worry free lifestyle.
| Staff type | Hours / Day / Resident | vs state avg |
|---|---|---|
|
Registered Nurse (RN)
| 37m per day | ▼ 4% State avg: 38m per day · National avg: 41m per day |
|
LPN / LVN
| 1h 9m per day | ▲ 18% State avg: 58m per day · National avg: 52m per day |
|
Nurse Aide
| 2h 22m per day | ▲ 11% State avg: 2h 8m per day · National avg: 2h 20m per day |
|
Weekend Total Nursing
| 3h 37m per day | ▲ 10% State avg: 3h 17m per day · National avg: 3h 26m per day |
|
Physical Therapist
| 3m per day | ▲ 9% State avg: 3m per day · National avg: 4m per day |
|
Weekend RN
| 24m per day | ▼ 3% State avg: 25m per day · National avg: 28m per day |
Elizabeth Scott Community is administered by Jill Schlievert.
Key information about the people who lead and staff this community.
In Ohio, the Department of Health, Bureau of Survey and Certification conducts unannounced onsite inspections to evaluate the quality of care and environment in all licensed facilities.
Citations
| This Facility | OH Average | vs. OH Avg |
|---|---|---|---|
|
Total citations
| 9 | 2 | This facility has 350% more total citations than a typical Ohio nursing home (9 vs. OH avg 2).↑ 350% worse |
|
Citations per inspection
| 2.3 | 0.3 | This facility has 667% more citations per inspection than a typical Ohio nursing home (2.3 vs. OH avg 0.3).↑ 667% worse |
Inspections
| This Facility | OH Average | vs. OH Avg |
|---|---|---|---|
|
Total inspections
| 4 | 6 | This facility has had 33% fewer total inspections than the Ohio average (4 vs. OH avg 6). More inspections can mean more regulatory scrutiny rather than worse care.↓ 33% fewer |
Every two years, the Ohio Department of Aging and the Office of the State Long-Term Care Ombudsman organizations conduct a satisfaction survey among residents in long-term care facilities to assess their quality of care and life.
Ohio average: 86 / 100
Ohio average: 89 / 100
Ohio average: 95 / 100
Ohio average: 82 / 100
Ohio average: 86 / 100
Ohio average: 89 / 100
Ohio average: 80 / 100
Ohio average: 81 / 100
Based on the RCF Resident Satisfaction Survey 2022-23, Final Results
Have you gotten or are you getting physical therapy, occupational therapy or speech therapy, while living at this care facility?
This facility50/100
Ohio average46/100
Did (Do) you know who to speak to about your therapy progress?
This facility82/100
Ohio average85/100
Did (Do) the therapists help you set goals?
This facility91/100
Ohio average89/100
Can you decide how to spend your day?
This facility96/100
Ohio average94/100
Did (Does) the therapy help you meet your goals?
This facility100/100
Ohio average88/100
Scores represent percent of positive resident responses for each item, excluding "don't know" and "not applicable" responses and instances where the question was skipped.
Based on the RCF Resident Satisfaction Survey 2022-23, Final Results
Can you enjoy the outdoors if you want to?
This facility95/100
Ohio average91/100
Do you feel safe here?
This facility100/100
Ohio average98/100
Are your personal items safe here?
This facility100/100
Ohio average92/100
Do you feel you have enough privacy?
This facility100/100
Ohio average95/100
Are you able to get around the building if you want to?
This facility100/100
Ohio average95/100
Is it easy for you to get around in your room (or apartment)?
This facility100/100
Ohio average96/100
Is it very clean here?
This facility100/100
Ohio average96/100
Can you find a place to be alone if you want to be alone?
This facility100/100
Ohio average96/100
Scores represent percent of positive resident responses for each item, excluding "don't know" and "not applicable" responses and instances where the question was skipped.
Based on the RCF Resident Satisfaction Survey 2022-23, Final Results
Did you receive a thorough orientation to ELIZABETH SCOTT COMMUNITY?
This facility83/100
Ohio average70/100
Were you given enough information to learn how things work here?
This facility100/100
Ohio average82/100
Did you feel warmly welcomed as a new resident?
This facility100/100
Ohio average93/100
Scores represent percent of positive resident responses for each item, excluding "don't know" and "not applicable" responses and instances where the question was skipped.
Based on the RCF Resident Satisfaction Survey 2022-23, Final Results
Are you friends with anyone who lives here?
This facility71/100
Ohio average81/100
Are you encouraged to speak up about things you don’t like here?
This facility95/100
Ohio average81/100
Overall, are you satisfied with the care you receive here?
This facility100/100
Ohio average94/100
Are your concerns taken care of in a timely way?
This facility100/100
Ohio average86/100
Are you as involved in decisions about your care as you want to be?
This facility100/100
Ohio average85/100
Do the people who work here seem happy to work here?
This facility100/100
Ohio average92/100
Do the people who work here go above and beyond to give you a good life?
This facility100/100
Ohio average87/100
Do the people who work here help you with technology, if needed?
This facility100/100
Ohio average89/100
Do the people who work here tell you when rules, policies, and procedures change?
This facility100/100
Ohio average78/100
Would you highly recommend ELIZABETH SCOTT COMMUNITY to someone who needs this type of care?
This facility100/100
Ohio average89/100
Scores represent percent of positive resident responses for each item, excluding "don't know" and "not applicable" responses and instances where the question was skipped.
Based on the RCF Resident Satisfaction Survey 2022-23, Final Results
Do the same people take care of you most of the time?
This facility85/100
Ohio average84/100
Are the people who work here knowledgeable about your medical conditions and treatments?
This facility92/100
Ohio average90/100
Do the people who work here check on you often enough to see if you need anything?
This facility92/100
Ohio average81/100
Do the people who work here do things the way you want them done?
This facility96/100
Ohio average88/100
Do you feel confident the people who work here would come quickly anytime you needed help?
This facility96/100
Ohio average85/100
Do the people who work here make sure you are comfortable when they provide care or services?
This facility96/100
Ohio average95/100
Do the people who work here ever get angry at you?
This facility96/100
Ohio average88/100
Do the people who care for you explain your care and services to you?
This facility100/100
Ohio average85/100
Do the people who work here support you to do as much for yourself as you are able to do?
This facility100/100
Ohio average96/100
Do the people who work here do everything they can to protect you from getting sick?
This facility100/100
Ohio average94/100
Do you have opportunities to maintain your health and wellness, if you want?
This facility100/100
Ohio average92/100
Scores represent percent of positive resident responses for each item, excluding "don't know" and "not applicable" responses and instances where the question was skipped.
Based on the RCF Resident Satisfaction Survey 2022-23, Final Results
Are there enjoyable things to do on the weekends, if you want?
This facility83/100
Ohio average63/100
Do you have enough opportunities to go on outings and special events?
This facility83/100
Ohio average73/100
Do you like the activities here?
This facility87/100
Ohio average83/100
Are you as connected to the community as you want to be?
This facility87/100
Ohio average71/100
Do you have something to look forward to most days?
This facility91/100
Ohio average77/100
Do you usually enjoy how you spend your time?
This facility92/100
Ohio average87/100
Do you have plenty of opportunities to do things that are meaningful to you?
This facility96/100
Ohio average83/100
Are you able to do the activities offered here, if you want?
This facility96/100
Ohio average93/100
Do you feel included in life here?
This facility100/100
Ohio average89/100
Scores represent percent of positive resident responses for each item, excluding "don't know" and "not applicable" responses and instances where the question was skipped.
Based on the RCF Resident Satisfaction Survey 2022-23, Final Results
Do you have input on the food that is served?
This facility71/100
Ohio average68/100
Do you get enough fresh food options here?
This facility92/100
Ohio average81/100
Does the menu change often enough?
This facility95/100
Ohio average77/100
Do you like the food here?
This facility96/100
Ohio average81/100
Do you get enough to eat here?
This facility100/100
Ohio average95/100
Do you look forward to mealtimes?
This facility100/100
Ohio average80/100
Scores represent percent of positive resident responses for each item, excluding "don't know" and "not applicable" responses and instances where the question was skipped.
The Scripps Gerontology Center at Miami University conducts a satisfaction survey among residents' family members, friends and guardians to assess quality of care and life.
Ohio average: 77 / 100
Ohio average: 80 / 100
Ohio average: 78 / 100
Ohio average: 85 / 100
Ohio average: 78 / 100
Ohio average: 78 / 100
Ohio average: 68 / 100
Ohio average: 67 / 100
Profile of respondents of this survey
100=Definitely Yes, 67=Probably Yes, 33=Probably No, 0=Definitely No
Does this living arrangement help the resident maintain their independence?:
This facility95/100
Ohio average84/100
Do you have enough opportunities for input into decisions about your resident’s care?:
This facility94/100
Ohio average78/100
Do you get enough information to make decisions with or about your resident?:
This facility94/100
Ohio average77/100
Scores represent percent of positive responses for each item based on the latest Family Satisfaction Survey results
100=Definitely Yes, 67=Probably Yes, 33=Probably No, 0=Definitely No
Is the residential care facility thoroughly clean?:
This facility93/100
Ohio average83/100
Can the resident get outside often enough?:
This facility78/100
Ohio average74/100
Are the resident’s belongings safe?:
This facility91/100
Ohio average79/100
Scores represent percent of positive responses for each item based on the latest Family Satisfaction Survey results
100=Definitely Yes, 67=Probably Yes, 33=Probably No, 0=Definitely No
When the resident moved in, were you given thorough information to help you know
This facility—/100
Ohio average—/100
what to expect?:
This facility94/100
Ohio average85/100
Was the resident given a thorough orientation to residential care?:
This facility94/100
Ohio average80/100
Did you feel warmly welcomed as a new family member?:
This facility93/100
Ohio average90/100
Scores represent percent of positive responses for each item based on the latest Family Satisfaction Survey results
100=Definitely Yes, 67=Probably Yes, 33=Probably No, 0=Definitely No
Are you encouraged to speak up when you have a problem?:
This facility93/100
Ohio average83/100
Are your concerns addressed in a timely way?:
This facility96/100
Ohio average78/100
Are you kept well informed about how things are going with your resident?:
This facility93/100
Ohio average76/100
Do the staff seem happy to work at the residential care facility?:
This facility88/100
Ohio average77/100
Do the staff go above and beyond to give your resident a good life?:
This facility91/100
Ohio average76/100
Do you feel confident that staff would help your resident beyond their personal care
This facility—/100
Ohio average—/100
needs if you could not (eg, paperwork, purchasing clothing)?:
This facility84/100
Ohio average69/100
Do you have peace of mind about the care your resident is getting when you aren’t at
This facility—/100
Ohio average—/100
the residential care facility?:
This facility94/100
Ohio average82/100
Would you highly recommend this residential care facility to a family member or friend?:
This facility94/100
Ohio average79/100
Scores represent percent of positive responses for each item based on the latest Family Satisfaction Survey results
100=Definitely Yes, 67=Probably Yes, 33=Probably No, 0=Definitely No
Do you feel confident the staff is knowledgeable about the resident’s medical
This facility—/100
Ohio average—/100
condition(s) and treatment(s)?:
This facility90/100
Ohio average79/100
Do the staff know what the resident likes and doesn’t like?:
This facility93/100
Ohio average79/100
Do the staff regularly check to see if the resident needs anything?:
This facility91/100
Ohio average77/100
Have you gotten to know the staff who care for your resident?:
This facility94/100
Ohio average78/100
Do the staff encourage your resident to be as independent as they are able to be?:
This facility92/100
Ohio average82/100
Do you feel confident staff would come quickly anytime your resident needed help?:
This facility89/100
Ohio average77/100
Scores represent percent of positive responses for each item based on the latest Family Satisfaction Survey results
100=Definitely Yes, 67=Probably Yes, 33=Probably No, 0=Definitely No
Does the resident have something enjoyable to look forward to most days?:
This facility73/100
Ohio average71/100
Do the staff do a good job keeping the resident connected to the community?:
This facility86/100
Ohio average72/100
Does the resident have plenty of opportunities to do things that are meaningful to them?:
This facility81/100
Ohio average71/100
Does the residential care facility have enough opportunities for your resident to go on
This facility—/100
Ohio average—/100
special outings and events?:
This facility82/100
Ohio average63/100
Does the resident like the provided activities?:
This facility81/100
Ohio average69/100
Does the residential care facility provide things the resident enjoys doing on the
This facility—/100
Ohio average—/100
weekend?:
This facility70/100
Ohio average56/100
Do you have plenty of opportunities to be involved in the residential care facility?:
This facility86/100
Ohio average72/100
Scores represent percent of positive responses for each item based on the latest Family Satisfaction Survey results
100=Definitely Yes, 67=Probably Yes, 33=Probably No, 0=Definitely No
Is there a lot of variety in the meals?:
This facility80/100
Ohio average70/100
Are you included in mealtimes if you want to be?:
This facility88/100
Ohio average65/100
Is the food good?:
This facility75/100
Ohio average68/100
Scores represent percent of positive responses for each item based on the latest Family Satisfaction Survey results
State average 6.7
Last Health inspection on Sep 2024
State average 30.9
State average 4.59
Health citations are formal notices following inspections when they fail to comply with safety and care standards.
8 of 9 citations resulted from standard inspections; and 1 of 9 resulted from complaint investigations.
State average: 0.3
State average: 0.9
Reporting period: October 1 – December 31, 2025 (Q4 2025). Source: CMS Payroll-Based Journal report.
Manages medical care and health needs.
Assists with medical care and medications.
Helps with daily care and mobility.
Total hours from contractors
5,631 contractor hours this quarter
| Certified Nursing Assistant | 32 | 68 | 100 | 11,907 | 92 | 100% | 8 |
| Licensed Practical Nurse | 13 | 31 | 44 | 4,836 | 92 | 100% | 11.4 |
| Registered Nurse | 6 | 0 | 6 | 1,992 | 91 | 99% | 11.2 |
| Other Dietary Services Staff | 5 | 0 | 5 | 1,137 | 92 | 100% | 6.5 |
| Administrator | 2 | 0 | 2 | 1,016 | 66 | 72% | 8 |
| RN Director of Nursing | 2 | 0 | 2 | 912 | 64 | 70% | 8 |
| Clinical Nurse Specialist | 3 | 0 | 3 | 653 | 68 | 74% | 5.3 |
| Physical Therapy Aide | 0 | 3 | 3 | 505 | 70 | 76% | 4.3 |
| Dietitian | 1 | 0 | 1 | 488 | 61 | 66% | 8 |
| Mental Health Service Worker | 1 | 0 | 1 | 464 | 58 | 63% | 8 |
| Speech Language Pathologist | 0 | 5 | 5 | 437 | 69 | 75% | 3.9 |
| Nurse Practitioner | 1 | 1 | 2 | 429 | 54 | 59% | 7.6 |
| Physical Therapy Assistant | 0 | 2 | 2 | 299 | 72 | 78% | 4.2 |
| Respiratory Therapy Technician | 0 | 3 | 3 | 275 | 67 | 73% | 4.1 |
| Qualified Social Worker | 0 | 1 | 1 | 195 | 67 | 73% | 2.9 |
| Occupational Therapy Aide | 0 | 1 | 1 | 163 | 27 | 29% | 6 |
| Occupational Therapy Assistant | 0 | 1 | 1 | 37 | 23 | 25% | 1.6 |
| Medical Director | 0 | 2 | 2 | 33 | 10 | 11% | 3.3 |
Federal penalties imposed by CMS for regulatory violations, including civil money penalties (fines) and denials of payment for new Medicare/Medicaid admissions.
Source: CMS Penalties Database
No penalties in the past 3 years
No civil money penalties or payment denials were reported in the last 3 years.
These measures show how residents usually do over time at this home, based on health outcomes and preventive care.
Ohio average: 5.8
Ohio average: 12.7
Ohio average: 6.8%
Ohio average: 8.9%
Ohio average: 22.0%
Ohio average: 3.4%
Ohio average: 3.9%
Ohio average: 0.5%
Ohio average: 6.2%
Ohio average: 24.0%
Ohio average: 8.4%
Ohio average: 92.4%
Ohio average: 94.5%
Ohio average: 78.0%
Ohio average: 1.3%
Ohio average: 75.6%
Ohio average: 25.1%
Ohio average: 12.5%
Ohio average: 0.8%
Ohio average: 53.7%
Ohio average: 50.6%
Quality measures are calculated from Minimum Data Set (MDS) assessments. For most measures, lower percentages indicate better care quality.
44% of new residents, usually for short-term rehab.
56% of new residents, often for short stays.
Source: CMS Long-Term Care Facility Characteristics (Data as of Jan 2026)
Residents meet regularly to discuss policies, care quality, and activities
Part of a Continuing Care Retirement Community offering multiple care levels
Organized group of residents that meets regularly to discuss facility policies, quality of life, and activities.
Data sourced from CMS Long-Term Care Facility Characteristics quarterly report. Payer mix reflects the current resident census by primary payment source.
Historical financial and operational data for Elizabeth Scott Community from 2011–2023, based on CMS SNF Cost Reports.
Key figures below are for fiscal year ending in 12/2023.
Based on CMS SNF Cost Report for fiscal year ending in 12/2023.
No pets allowed
Housing Options: Studio / 1 Bed
Building Type: 2-story
Transportation Services
Fitness and Recreation
This home supports both short-term rehab and long-term care, with residents staying for a wide range of durations.
Most new residents arrive under private pay (56% of admissions), and a typical private pay stay runs around 4 - 5 months.
Coverage residents most often arrive under.
Coverage residents most often leave under.
![]() 4.9 miles from city center
4.9 miles from city center
![]() Estimated distance in miles from Maumee's city center to Elizabeth Scott Community's address, calculated via Google Maps.
Estimated distance in miles from Maumee's city center to Elizabeth Scott Community's address, calculated via Google Maps.
Add your location
Info below is compiled from CMS reports & the OH Dept. of Health, senior community websites & trusted data sources such as Walk Score & BBB.
Communities are listed from highest to lowest based on our ranking methodology.
| Brookdale Westlake Village | NH AL IL MC SNF | Westlake | 60
Facility
60
OH AVG
75
Rank
#177 / 309 |
96.7%
Facility
96.7%
OH AVG
81.7
Rank
#4 / 138 | +18% | 4.38
Facility
4.38
OH AVG
3.54
Rank
#21 / 182 | +18% | +24% | $0
Facility
$0
OH AVG
$74.0k
Rank
#1 / 183 | 5
Facility
5
OH AVG
30.9
Rank
#9 / 183 | 1.3
Facility
1.3
OH AVG
4.6
Rank
#2 / 183 | - | 58 | A+ |
25
Facility
25
OH AVG
40
Rank
#500 / 704 | Labeed Diab | $20.1MFiscal year ending 12/2023
Facility
$20.1MFiscal year ending 12/2023
OH AVG
$10.1M
Rank
#66 / 183 | $10.2MFiscal year ending 12/2023
Facility
$10.2MFiscal year ending 12/2023
OH AVG
$3.9M
Rank
#11 / 183 | 50.8%Fiscal year ending 12/2023
Facility
50.8%Fiscal year ending 12/2023
OH AVG
40.2%
Rank
#5 / 183 | 366373 | ||||
| The Knolls of Oxford | NH AL IL MC SNF | Oxford | 50
Facility
50
OH AVG
75
Rank
#214 / 309 |
92.8%
Facility
92.8%
OH AVG
81.7
Rank
#25 / 138 | +14% | 4.09
Facility
4.09
OH AVG
3.54
Rank
#36 / 182 | -31% | +15% | $0
Facility
$0
OH AVG
$74.0k
Rank
#1 / 183 | 4
Facility
4
OH AVG
30.9
Rank
#4 / 183 | 2.0
Facility
2.0
OH AVG
4.6
Rank
#10 / 183 | - | 46 | - |
0
Facility
0
OH AVG
40
Rank
#686 / 704 | Ronald Beymer | $6.2MFiscal year ending 12/2023
Facility
$6.2MFiscal year ending 12/2023
OH AVG
$10.1M
Rank
#146 / 183 | $4.3MFiscal year ending 12/2023
Facility
$4.3MFiscal year ending 12/2023
OH AVG
$3.9M
Rank
#119 / 183 | 69.5%Fiscal year ending 12/2023
Facility
69.5%Fiscal year ending 12/2023
OH AVG
40.2%
Rank
#17 / 183 | 366282 | ||||
| Elizabeth Scott Community | NH AL MC SNF | Maumee | 60
Facility
60
OH AVG
75
Rank
#177 / 309 |
86.7%
Facility
86.7%
OH AVG
81.7
Rank
#68 / 138 | +6% | 3.52
Facility
3.52
OH AVG
3.54
Rank
#86 / 182 | -64% | -1% | $0
Facility
$0
OH AVG
$74.0k
Rank
#1 / 183 | 9
Facility
9
OH AVG
30.9
Rank
#21 / 183 | 2.3
Facility
2.3
OH AVG
4.6
Rank
#16 / 183 | - | 52 | A+ |
0
Facility
0
OH AVG
40
Rank
#686 / 704 | Elizabeth Scott, Inc | $6.7MFiscal year ending 12/2023
Facility
$6.7MFiscal year ending 12/2023
OH AVG
$10.1M
Rank
#129 / 183 | $3.2MFiscal year ending 12/2023
Facility
$3.2MFiscal year ending 12/2023
OH AVG
$3.9M
Rank
#118 / 183 | 48%Fiscal year ending 12/2023
Facility
48%Fiscal year ending 12/2023
OH AVG
40.2%
Rank
#50 / 183 | 366184 | ||||
| Locust Ridge | NH MC RC SNF | Williamsburg | 61
Facility
61
OH AVG
75
Rank
#174 / 309 |
90.2%
Facility
90.2%
OH AVG
81.7
Rank
#42 / 138 | +10% | 4.46
Facility
4.46
OH AVG
3.54
Rank
#17 / 182 | +35% | +26% | $0
Facility
$0
OH AVG
$74.0k
Rank
#1 / 183 | 18
Facility
18
OH AVG
30.9
Rank
#48 / 183 | 4.5
Facility
4.5
OH AVG
4.6
Rank
#108 / 183 | - | 55 | A+ |
0
Facility
0
OH AVG
40
Rank
#686 / 704 | Gary Vannostrand | $5.9MFiscal year ending 12/2023
Facility
$5.9MFiscal year ending 12/2023
OH AVG
$10.1M
Rank
#157 / 183 | $2.7MFiscal year ending 12/2023
Facility
$2.7MFiscal year ending 12/2023
OH AVG
$3.9M
Rank
#149 / 183 | 45.2%Fiscal year ending 12/2023
Facility
45.2%Fiscal year ending 12/2023
OH AVG
40.2%
Rank
#34 / 183 | 365336 | ||||
| Otterbein SeniorLife | NH AL HC HOS IL MC SNF | Lebanon | 154
Facility
154
OH AVG
75
Rank
#10 / 309 |
90.5%
Facility
90.5%
OH AVG
81.7
Rank
#40 / 138 | +11% | 3.84
Facility
3.84
OH AVG
3.54
Rank
#51 / 182 | -1% | +8% | $0
Facility
$0
OH AVG
$74.0k
Rank
#1 / 183 | 25
Facility
25
OH AVG
30.9
Rank
#84 / 183 | 5.0
Facility
5.0
OH AVG
4.6
Rank
#128 / 183 | 1 | 139 | - |
0
Facility
0
OH AVG
40
Rank
#686 / 704 | Otterbein Homes | $19.8MFiscal year ending 12/2023
Facility
$19.8MFiscal year ending 12/2023
OH AVG
$10.1M
Rank
#6 / 183 | $10.3MFiscal year ending 12/2023
Facility
$10.3MFiscal year ending 12/2023
OH AVG
$3.9M
Rank
#8 / 183 | 52%Fiscal year ending 12/2023
Facility
52%Fiscal year ending 12/2023
OH AVG
40.2%
Rank
#177 / 183 | 365346 |
Elizabeth Scott Community's occupancy is 90.4%.
Elizabeth Scott Community has been operating for approximately 38 years, based on available licensing and registration records.
Yes — see the floorplan options available at Elizabeth Scott Community on this page.
No, Elizabeth Scott Community has a no-pet policy.
The team at Elizabeth Scott Community can be reached at INFO@ELIZABETHSCOTT.ORG.
Elizabeth Scott Community is registered as a for-profit in OH.
Jill Schlievert is the administrator of Elizabeth Scott Community.
Care Cost Calculator: See Prices in Your Area
Nursing Home Data Explorer
Don’t Wait Too Long: 7 Red Flag Signs Your Parent Needs Assisted Living Now
The True Cost of Assisted Living in 2025 – And How Families Are Paying For It
Understanding Senior Living Costs: Pricing Models, Discounts & Financial Assistance


