Paradise Valley Estates
Nursing Home, Assisted Living, Memory Care & Nursing Care · Fairfield, CA
CMS overall rating Info CMS (the Centers for Medicare & Medicaid Services) is the federal agency that rates nursing home quality. Its Overall Rating runs from 1 to 5 stars, combining health inspections, staffing, and quality measures, with inspections weighted most heavily.

Paradise Valley Estates

Nursing Home, Assisted Living, Memory Care & Nursing Care · Fairfield, CA
CMS overall rating Info CMS (the Centers for Medicare & Medicaid Services) is the federal agency that rates nursing home quality. Its Overall Rating runs from 1 to 5 stars, combining health inspections, staffing, and quality measures, with inspections weighted most heavily.
Calculator: See prices in your area
Paradise Valley Estates accepts Medicare and private pay.

Overview of Paradise Valley Estates

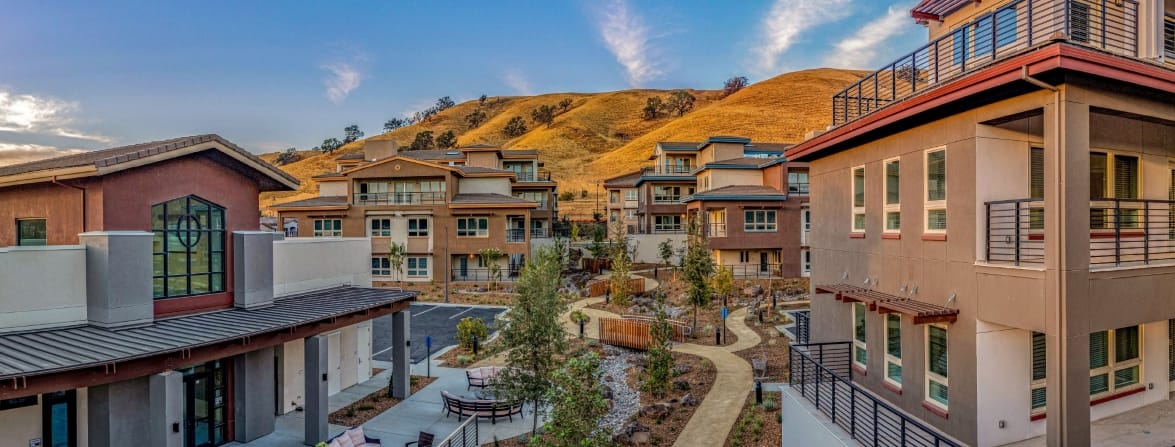
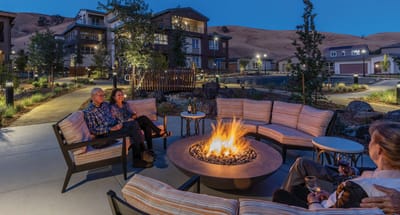
Settling on 76 acres of tranquil lands in Estates Drive, Fairfield, CA, Paradise Valley Estates is an idyllic senior living community that provides assisted living, memory care, and skilled nursing. Keep peace of mind with a competent and highly trained team assisting seniors with their daily needs around the clock. Moreover, Paradise Valley Estates handles the maintenance and other household chores to provide residents with more time to make the most out of their best years.

Immerse in a wide array of cultural activities and recreational programs to stay active and well–engaged. Personalized meal plans are available to meet dietary needs and preferences. Paradise Valley Estates is ideal for seniors aiming to maximize their freedom while receiving the utmost attention for their ever-changing needs.

Quality ratings

Measured by Centers for Medicare & Medicaid Services (CMS)

Overall rating Info The Overall CMS Rating combines results from health inspections, staffing levels and quality measures. Health inspections carry the most weight. Staffing and quality scores can increase or decrease the final rating based on performance compared to state and national standards.
Health Inspection Info Based on the results of the facility's three most recent standard inspections and any complaint investigations. CMS reviews the number, scope, and severity of deficiencies, with more recent findings weighted more heavily.
Staffing Info Measures average nursing staff hours per resident per day, including Registered Nurses (RNs) and total nursing staff. Ratings are adjusted based on the level of care residents require and are compared to state and national benchmarks.
Quality Measures Info Based on clinical and physical health indicators reported to CMS, such as hospital readmissions, falls, pressure ulcers, and improvements in mobility. These measures reflect how well residents' health needs are being managed.

Staffing hours breakdown

Info Daily nursing hours per resident by staff type, reported to CMS. Higher is generally better — compare this facility to state and national averages to see where staffing stands.

Hours per resident per day — compared to state averages

Total nursing care / resident Info Total adjusted nursing hours per resident per day, combining RN, LPN, and aide time. CMS adjusts this for case-mix so facilities can be fairly compared.
5h 49m per day
Rank #16 / 354Nurse hours — State benchmarkedThis home is ranked 16th out of 354 homes in California. Shows adjusted nurse hours per resident per day benchmarked to the California average, with a ranking across 354 California facilities. More hours mean more direct care. The national average is about 3.5 hrs; below 3.0 is a red flag.Rankings are based only on facilities in California that report data for that category. Facilities without available data are excluded from the ranking.Click the rank badge to see the full State ranking.Click here to see the full State ranking.
vs avg
Staff typeHours / Day / Residentvs state avg
Registered Nurse (RN) Info RNs hold the highest nursing license and can assess residents, interpret test results, and direct care plans. More RN hours per day often signals stronger clinical oversight and faster response to health changes. 1h 24m per day
LPN / LVN Info Licensed Practical Nurses (LPNs) or Licensed Vocational Nurses (LVNs) deliver routine hands-on care — medication administration, wound dressing, and monitoring vital signs. They work under RN supervision and make up a large share of daily bedside care. 49m per day
Nurse Aide Info Certified Nurse Aides (CNAs) provide the most direct day-to-day assistance: bathing, dressing, feeding, and mobility. Nurse aide hours are typically the largest staffing category and directly affect residents' quality of life. 3h 4m per day
Weekend Total Nursing Info Combined nursing hours (RN + LPN + Nurse Aide) per resident per day on weekends. Staffing often drops on weekends — this figure reveals whether the facility maintains adequate coverage outside of weekday hours. 4h 40m per day
Physical Therapist Info Hours per resident per day provided by licensed Physical Therapists (PTs) or PT Assistants. PT services help residents recover mobility after injury or illness and are especially important for post-acute (short-stay) rehabilitation. 6m per day
Weekend RN Info Registered nurse hours specifically on weekends. Facilities sometimes reduce RN presence on Saturdays and Sundays — a low weekend RN figure compared to weekday hours can indicate reduced clinical oversight when most administrative staff are absent. 1h 0m per day

Capacity and availability

Avg. Length of Stay
66 days
Bed community size
743-bed community Rank #6 / 1657Bed count — State benchmarkedThis home is ranked 6th out of 1657 homes in California. Shows this facility's certified or reported bed count compared to other California facilities. Larger communities may offer more amenities, programs, and on-site services for residents and families.Rankings are based only on facilities in California that report data for that category. Facilities without available data are excluded from the ranking.Click the rank badge to see the full State ranking.Click here to see the full State ranking.
A large-scale community that may provide a wide range of amenities, services, and structured programs.
Years in operation
28 years in operation Rank #158 / 1487Years in operation — State benchmarkedThis home is ranked 158th out of 1487 homes in California. Shows how long this facility has been in operation compared to other California facilities. Longer operating histories may benefit residents, families, and staff.Rankings are based only on facilities in California that report data for that category. Facilities without available data are excluded from the ranking.Click the rank badge to see the full State ranking.Click here to see the full State ranking.
A longer operating history, which may indicate experience navigating regulations and delivering ongoing care.
Walk Score
Walk Score: 0 / 100 Rank #2070 / 2092Walk Score — State benchmarkedThis home is ranked 2070th out of 2092 homes in California. Shows how walkable this facility's neighborhood is compared to the average Walk Score across California facilities. Higher scores benefit residents, families, and staff.Rankings are based only on facilities in California that report data for that category. Facilities without available data are excluded from the ranking.Click the rank badge to see the full State ranking.Click here to see the full State ranking.
Car-dependent. Most errands require a car, with limited nearby walkable options.

About this community

License Details

Facility TypeRcfe-continuing Care Retirement Community
StatusLicensed
IssuanceDecember 3, 1997
CountySolano
License Number1338
RCFE Number486800368

Ownership & Operating Entity

Paradise Valley Estates is legally operated by Northern California Retired Officers Community, and administered by Shannon Stack.

Therapy & Rehabilitation

2 services
Rehabilitation Services
Short-Term Rehab

Staffing & Medical

1 service
24-Hour Staffing

Amenities & Lifestyle

Specific ProgramsHealth & Wellness, Enhanced Assisted Living, Short-Term Rehabilitation
Operating HoursAvailable 24/7

Contact Paradise Valley Estates

Inspection History

In California, the Department of Social Services (for assisted living facilities) and the Department of Public Health (for nursing homes) conduct inspections to ensure resident safety and regulatory compliance.

Inspection Score Info A composite 0–100 score combining this facility's inspections, citations, complaints, and enforcement actions relative to the California state average. The score below shows how many points this facility sits above or below the typical California assisted living residence score (the benchmark); higher is better.

5 points above the California average for assisted living residences (81/100)

Rank #630 / 1401 in California Inspection Score — State benchmarked This home is ranked 630th out of 1401 homes in California. Shows this facility's inspection score compared to the California average among 1401 comparable communities in the ranking pool. Rankings are based only on facilities in California that report data for that category. Facilities without available data are excluded from the ranking. Inspection score: 86 out of 100. Letter grade B. 5 points above the California average for assisted living residences (81/100)

Inspection Scorecard Info This scorecard compares key inspection, citation, and complaint metrics at this facility against the California state average. Metrics rated ≥15% worse than average are highlighted in red; those ≥15% better are highlighted in green.

Since 2021 vs. California state average
Overall vs. CA average 3 Worse Metrics worse than California average:
• Total visits (6% above)
• Other visits (29% above)
• Official inspections (25% above)
1 At Avg Metrics at California average:
• Moderate citations (Type B) (at CA avg)
6 Better Metrics better than California average:
• Total citations (40% below)
• Serious citations (Type A) (33% below)
• Citations per year (40% below)
• Citations per inspection (88% below)
• Complaint visits (77% below)
• Complaint investigations (80% below)
Latest Inspection April 16, 2026

Citations Info Citations are formal regulatory issues recorded during state inspections.

This FacilityCA Averagevs. CA Avg
Total citations Info Formal regulatory issues recorded by inspectors across all inspection types. 610 This facility has 40% fewer total citations than a typical California assisted living residence (6 vs. CA avg 10).↓ 40% better
Serious citations (Type A) Info Citations that pose an immediate risk to resident health or safety. Type A citations are the most serious and typically require prompt corrective action. 23 This facility has 33% fewer serious citations (type a) than a typical California assisted living residence (2 vs. CA avg 3).↓ 33% better Rank #600 / 1164 Serious citations (Type A) — State benchmarked This home is ranked 600th out of 1164 homes in California. Shows this facility's # of serious citations compared to the California average among 1164 comparable communities in the ranking pool. Rankings are based only on facilities in California that report data for that category. Facilities without available data are excluded from the ranking.
Moderate citations (Type B) Info Citations that do not pose an immediate risk but still represent a departure from required care or operational standards. 44 This facility has moderate citations (type b) in line with the California average (4 vs. CA avg 4).— At avg
Citations per year Info Average citations per year since 2021. 1.22 This facility has 40% fewer citations per year than a typical California assisted living residence (1.2 vs. CA avg 2).↓ 40% better
Citations per inspection Info Average citations per inspection. 0.43.3 This facility has 88% fewer citations per inspection than a typical California assisted living residence (0.4 vs. CA avg 3.3).↓ 88% better

Inspections & Visits Info State inspections evaluate whether the facility meets health and safety standards.

This FacilityCA Averagevs. CA Avg
Total visits Info Combined count of complaint visits, other regulatory visits, and official scheduled inspections. 1716 This facility has 6% more total visits than a typical California assisted living residence (17 vs. CA avg 16).↑ 6% worse
Complaint visits Info On-site visits triggered by formal complaints filed by residents, families, or staff. 313 This facility has 77% fewer complaint visits than a typical California assisted living residence (3 vs. CA avg 13).↓ 77% better Rank #441 / 1397 Complaint visits — State benchmarked This home is ranked 441st out of 1397 homes in California. Shows this facility's # of complaint visits compared to the California average among 1397 comparable communities in the ranking pool. Rankings are based only on facilities in California that report data for that category. Facilities without available data are excluded from the ranking.
Other visits Info Regulatory visits that are neither routine inspections nor complaint investigations — administrative check-ins, follow-up reviews, licensing-related visits. 97 This facility has 29% more other visits than a typical California assisted living residence (9 vs. CA avg 7).↑ 29% worse
Official inspections Info Routine, scheduled inspections conducted by state regulators to evaluate whether the facility meets federal and state standards. 54 This facility has 25% more official inspections than a typical California assisted living residence (5 vs. CA avg 4).↑ 25% worse
Complaint investigations Info On-site investigations triggered by complaints filed with California regulators. 210 This facility has 80% fewer complaint investigations than a typical California assisted living residence (2 vs. CA avg 10).↓ 80% better

Inspection Reports Summary Info An editor-reviewed summary of the themes and findings across this facility's recent inspection reports.

  • The most recent inspection on November 14, 2025, cited one deficiency for missing staff training documentation but found resident files compliant.
  • The facility received a repeat Type B citation and a $250 civil penalty for four of ten staff files lacking required annual dementia and hospice care training.
  • Complaint investigations in 2024 and 2025 substantiated medication mismanagement and confirmed financial abuse allegations, though no deficiencies or citations were issued during those visits.

Health Inspection History

Inspections since 2019
Total health inspections 4

State average N/A


Last Health inspection on Feb 2025

Total health citations
25 Rank #78 / 361Health citations — State benchmarkedThis home is ranked 78th out of 361 homes in California. Shows this facility's total health deficiency citations benchmarked to the California State average, with a ranking across all 361 CA facilities. Lower citation counts earn a better rank.Rankings are based only on facilities in California that report data for that category. Facilities without available data are excluded from the ranking.Click the rank badge to see the full State ranking.Click here to see the full State ranking.

State average N/A

Citations per inspection
6.25 Rank #310 / 361Citations per inspection — State benchmarkedThis home is ranked 310th out of 361 homes in California. Shows average deficiency citations per CMS inspection for this facility versus the California mean across 361 facilities with citation data. Lower is better.Rankings are based only on facilities in California that report data for that category. Facilities without available data are excluded from the ranking.Click the rank badge to see the full State ranking.Click here to see the full State ranking.

State average N/A


Health citations are formal notices following inspections when they fail to comply with safety and care standards.

22 of 25 citations resulted from standard inspections; and 3 of 25 resulted from complaint investigations.

Breakdown of citation severity (last 7 years)
Critical health citations
0
In line with State average

State average: N/A


Serious health citations
2
In line with State average

State average: N/A

0 critical citations State average: N/A

2 serious citations State average: N/A

23 moderate citations State average: N/A

0 minor citations State average: N/A
Citations history (last 7 years)
Infection Control moderate citation Feb 14, 2025
Corrected

Nutrition moderate citation Feb 14, 2025
Corrected

Nutrition moderate citation Feb 14, 2025
Corrected

Nutrition moderate citation Feb 14, 2025
Corrected

Staffing Data

Reporting period: October 1 – December 31, 2025 (Q4 2025). Source: CMS Payroll-Based Journal report.

Total staff 64
Employees 51
Contractors 13
Staff to resident ratio 1.94 : 1
0% compared with State average

State average ratio: 0 : 0

Avg staff/day 29
Average shift 7.2 hours
0% compared with State average

State average: 0 hours

Total staff hours (quarter) 19,174

Nursing staff breakdown

Q4 2025 · Oct 1 – Dec 31 More info This data comes from the CMS Payroll-Based Journal report covering October 1 – December 31, 2025.
Registered Nurse

Manages medical care and health needs.

RN Staff Info All 10 RN Staff are full-time employees. No contractors work on this role. 10
Average shift length Info Average shift length. Calculated as total hours divided by days worked and average staff per day. 7.5 hours
Licensed Practical Nurse

Assists with medical care and medications.

LPN Staff Info 7 total: 6 full-time employees and 1 contractor. 7
Average shift length Info Average shift length. Calculated as total hours divided by days worked and average staff per day. 7.1 hours
Certified Nursing Assistant

Helps with daily care and mobility.

CNA Staff Info 27 total: 26 full-time employees and 1 contractor. 27
Average shift length Info Average shift length. Calculated as total hours divided by days worked and average staff per day. 7.4 hours

Contractor staffing

Q4 2025 · Oct 1 – Dec 31 More info This data comes from the CMS Payroll-Based Journal report covering October 1 – December 31, 2025.

Total hours from contractors

12.4%

2,377 contractor hours this quarter

Speech Language Pathologist: 2 Physical Therapy Assistant: 2 Certified Nursing Assistant: 1 Licensed Practical Nurse: 1 Occupational Therapy Aide: 1 Respiratory Therapy Technician: 1 RN Director of Nursing: 1 Qualified Social Worker: 1 Occupational Therapy Assistant: 1 Physical Therapy Aide: 1 Medical Director: 1

Staff by category

Q4 2025 · Oct 1 – Dec 31 More info This data comes from the CMS Payroll-Based Journal report covering October 1 – December 31, 2025.
Certified Nursing Assistant261279,10392100%7.4
Registered Nurse100102,70892100%7.5
Licensed Practical Nurse6171,66892100%7.1
Clinical Nurse Specialist2029527379%8
Dietitian3038239098%7.8
RN Director of Nursing1127517784%8.2
Mental Health Service Worker1014926267%7.9
Nurse Practitioner1014806065%8
Administrator1014485661%8
Speech Language Pathologist0223826571%5.9
Qualified Social Worker0113505863%6
Physical Therapy Assistant0223205661%5.7
Respiratory Therapy Technician0112864448%6.5
Physical Therapy Aide0112634852%5.5
Occupational Therapy Aide011741415%5.3
Medical Director011401415%2.9
Occupational Therapy Assistant011341011%3.4
27 Certified Nursing Assistant
% of Days 100%
10 Registered Nurse
% of Days 100%
7 Licensed Practical Nurse
% of Days 100%
2 Clinical Nurse Specialist
% of Days 79%
3 Dietitian
% of Days 98%
2 RN Director of Nursing
% of Days 84%
1 Mental Health Service Worker
% of Days 67%
1 Nurse Practitioner
% of Days 65%
1 Administrator
% of Days 61%
2 Speech Language Pathologist
% of Days 71%
1 Qualified Social Worker
% of Days 63%
2 Physical Therapy Assistant
% of Days 61%
1 Respiratory Therapy Technician
% of Days 48%
1 Physical Therapy Aide
% of Days 52%
1 Occupational Therapy Aide
% of Days 15%
1 Medical Director
% of Days 15%
1 Occupational Therapy Assistant
% of Days 11%

Penalties and fines

Includes penalties issued in 2024

Federal penalties imposed by CMS for regulatory violations, including civil money penalties (fines) and denials of payment for new Medicare/Medicaid admissions.

Source: CMS Penalties Database (Data as of Jan 2026)

Total fines amount $60K Rank #293 / 362Federal fines — State benchmarkedThis home is ranked 293rd out of 362 homes in California. Shows this facility's cumulative CMS federal fine dollars versus the California average among facilities with fines, and where it ranks among 362 facilities in the pool. Lower total dollars mean a better rank.Rankings are based only on facilities in California that report data for that category. Facilities without available data are excluded from the ranking.Click the rank badge to see the full State ranking.Click here to see the full State ranking.
10% higher than State average

State average: $55K

Number of fines 2
15% fewer fines than State average

State average: 2.4

Payment Denials Info Serious action where Medicare and/or Medicaid temporarily stops payments for new residents until issues are fixed. 0
100% fewer payment denials than State average

State average: 0.5

Fines amount comparison
This facility $60K
State average $55K
Penalty History

Penalties are imposed by CMS for violations of federal nursing home regulations.

1 penalty in the past 3 years

Apr 3, 2024 · $35K

Civil Money Penalty Info Fines imposed for noncompliance, which can be assessed per day or per instance of violation. Apr 3, 2024
$35K

Last updated: Jan 2026

Quality of care over time

These measures show how residents usually do over time at this home, based on health outcomes and preventive care.

High-risk clinical events score Info A composite score based on pressure ulcers, falls with injury, weight loss, walking ability decline, and activities of daily living decline. 11.3
70% worse than State average

State average: 6.6

Functional decline score Info A composite score based on activities of daily living decline, walking ability decline, and incontinence. 19.4
71% worse than State average

State average: 11.3

Long-stay resident measures
Need for Help with Daily Activities Increased Info Percent of long-stay residents whose need for help with daily activities has increased 27.3%
147% worse than State average

State average: 11.1%

Low Risk Residents with Bowel/Bladder Incontinence Info Percent of low risk long-stay residents who lose control of their bowels or bladder 11.5%
In line with State average

State average: 11.3%

Falls with Major Injury Info Percent of long-stay residents experiencing one or more falls with major injury 0.0%
100% better than State average

State average: 1.7%

High Risk Residents with Pressure Ulcers Info Percent of long-stay high risk residents with pressure ulcers 13.8%
178% worse than State average

State average: 5.0%

Urinary Tract Infection Info Percent of long-stay residents with a urinary tract infection 2.6%
112% worse than State average

State average: 1.2%

Lost Too Much Weight Info Percent of long-stay residents who lose too much weight 4.2%
In line with State average

State average: 4.2%

Depressive Symptoms Info Percent of long-stay residents who have depressive symptoms 0.0%
100% better than State average

State average: 6.7%

Antipsychotic Use Info Percent of long-stay residents who received an antipsychotic medication 1.3%
87% better than State average

State average: 10.1%

Pneumococcal Vaccine Info Percent of long-stay residents assessed and appropriately given the pneumococcal vaccine 100.0%
In line with State average

State average: 98.5%

Influenza Vaccine Info Percent of long-stay residents assessed and appropriately given the seasonal influenza vaccine 100.0%
In line with State average

State average: 98.2%

Short-stay resident measures
Pneumococcal Vaccine Info Percent of short-stay residents assessed and appropriately given the pneumococcal vaccine 98.4%
5% better than State average

State average: 94.0%

Antipsychotic medication increase Info Percent of short-stay residents who newly received an antipsychotic medication 1.2%
17% better than State average

State average: 1.5%

Influenza Vaccine Info Percent of short-stay residents assessed and appropriately given the seasonal influenza vaccine 96.6%
In line with State average

State average: 93.2%

Breakdown by payment type

Medicare

77% of new residents, usually for short-term rehab.

Typical stay 26 days

Private pay

23% of new residents, often for short stays.

Typical stay 6 - 7 months

Facility Characteristics

Source: CMS Long-Term Care Facility Characteristics (Data as of Jan 2026)

Total residents 33
Medicare
33
100% of residents
Programs & Services
Residents Group

Residents meet regularly to discuss policies, care quality, and activities

Nurse Aide Training

State-approved Nurse Aide Training and Competency Evaluation Program on-site

CCRC

Part of a Continuing Care Retirement Community offering multiple care levels

Active Resident Council

Organized group of residents that meets regularly to discuss facility policies, quality of life, and activities.

Finances and operations

Based on CMS SNF Cost Report for fiscal year ending in 12/2023.

Nonprofit
Other Nonprofit
Net patient revenue Info Net patient revenue — what the home actually collects for resident care, after contractual allowances, bad debt and discounts are subtracted from its gross charges (CMS cost report, Worksheet G-3). It covers resident care only; money the home earns from other sources is shown separately as "Other income."
$34.0M
Net patient income Info Net patient income: net patient revenue minus the home's total operating expenses. A positive figure means it earns more from resident care than it spends to deliver it; a negative figure means the opposite. It excludes non-operating "other income."
-$16.1M
Nonprofit Other Nonprofit
Net patient revenue Info Net patient revenue — what the home actually collects for resident care, after contractual allowances, bad debt and discounts are subtracted from its gross charges (CMS cost report, Worksheet G-3). It covers resident care only; money the home earns from other sources is shown separately as "Other income."
$34.0M Rank #8 / 355Revenue — State benchmarkedThis home is ranked 8th out of 355 homes in California. Shows this facility's annual revenue compared to the California average. Higher revenue generally means more resources for staffing and capital — read alongside Payroll %.Rankings are based only on facilities in California that report data for that category. Facilities without available data are excluded from the ranking.Click the rank badge to see the full State ranking.Click here to see the full State ranking.
Net patient income Info Net patient income: net patient revenue minus the home's total operating expenses. A positive figure means it earns more from resident care than it spends to deliver it; a negative figure means the opposite. It excludes non-operating "other income."
-$16.1M
Other income Info Money the home earns outside of resident care — such as investments, grants, rentals and other non-operating sources (CMS cost report, Worksheet G-3). It is tracked separately from net patient revenue: it is not part of that figure, and it is not included in net patient income.
$13.7M
Payroll costs Info Staff salaries plus wage-related costs — benefits such as payroll taxes, health insurance and retirement — from the home's own accounting records (CMS cost report, Worksheet A). Contract or agency labor is counted separately, under other operating costs. Rank #5 / 355Payroll — State benchmarkedThis home is ranked 5th out of 355 homes in California. Shows total annual staff payroll benchmarked to the California average. Higher payroll investment relative to peers often signals better staffing and less reliance on cheaper contract labor.Rankings are based only on facilities in California that report data for that category. Facilities without available data are excluded from the ranking.Click the rank badge to see the full State ranking.Click here to see the full State ranking.
$21.2M 62.4% of net patient revenue Info Payroll as a share of revenue: staff salaries and wage-related benefits divided by net patient revenue. A higher figure means more of each revenue dollar goes to staff pay. Rank #254 / 355Payroll % — State benchmarkedThis home is ranked 254th out of 355 homes in California. Shows payroll as a percentage of revenue versus the California average. Well-run California facilities typically land around 56–67% — the top third Statewide. Below 25% may signal understaffing or heavy agency use — read with Staffing ratings.Rankings are based only on facilities in California that report data for that category. Facilities without available data are excluded from the ranking.Click the rank badge to see the full State ranking.Click here to see the full State ranking.
Other operating costs Info Everything it costs to run the home apart from payroll — food, utilities, supplies, maintenance, contract labor and administration. Calculated as total operating expense minus payroll (staff salaries and wage-related benefits).
$28.9M
Total costs Info The home's total operating expense for the year — all the costs of running it, salaries included (CMS cost report, Worksheet G-3).
$50.1M

What does this home offer?

Pets allowed icon
Pets allowed icon

Pets Allowed

Room sizes icon
Room sizes icon

Room Sizes: 803 - 2,090 sq. ft.

Housing options icon

Housing Options: 1 Bed / 2 Bed

Building type icon
Building type icon

Building Type: 3-story

Transportation services icon

Transportation Services

Fitness and recreation icon

Fitness and Recreation

Who this home usually serves

TYPE OF STAY

Mostly short-term rehab stays

Most residents typically stay for a few weeks or months before returning home or moving on.

Most new residents arrive under Medicare (77% of admissions), and a typical Medicare stay runs around 26 days.

Admissions
198 total

Coverage residents most often arrive under.

Medicare 77%
Private pay 23%
Discharges
195 total

Coverage residents most often leave under.

Medicare 61%
Private pay 39%

Places of interest near Paradise Valley Estates

Address 10.0 miles from city center Info Estimated distance in miles from Fairfield's city center to Paradise Valley Estates's address, calculated via Google Maps.

Calculate Travel Distance to Paradise Valley Estates

Add your location

Address

Compare Nursing Homes around the area

The information below is reported by the California Department of Social Services and Department of Public Health.

Paradise Valley Estates
NH
AL
MC
NC
Fairfield -743 - 0 1 Bed / 2 Bed
Cogir of North Bay
NH
AL
IL
Vallejo (Harry Floyd Terrace) -83 A+ 47 Studio / 1 Bed / 2 Bed
Vacaville Memory Care
NH
MC
RC
Vacaville -75 A+ 60 1 Bed / 2 Bed
Canterbury Woods
NH
AL
IL
Pacific Grove -190 A+ 81 1 Bed / 2 Bed
Ivy Park at Simi Valley
NH
AL
MC
Simi Valley (Tradewinds Club) -175 C 59 Studio / Suite / 1 Bed / 2 Bed

Frequently Asked Questions about Paradise Valley Estates

Who is the owner of Paradise Valley Estates?

The legal owner and operator of Paradise Valley Estates is Northern California Retired Officers Community.

What is the occupancy rate at Paradise Valley Estates?

Paradise Valley Estates's occupancy is 9.7%.

Does Paradise Valley Estates operate as a for-profit or non-profit?

Paradise Valley Estates is registered as a non-profit in CA.

Who is the administrator of Paradise Valley Estates?

Shannon Stack is the administrator of Paradise Valley Estates.

How many beds does Paradise Valley Estates have?

Paradise Valley Estates has 743 beds.

Has Paradise Valley Estates had any recent citations?

Paradise Valley Estates has had 6 recently reported citations.

Are there photos of Paradise Valley Estates?

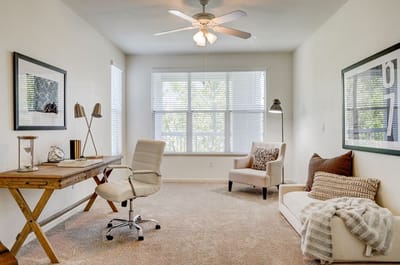
Yes — there are 6 photos of Paradise Valley Estates in the photo gallery on this page.

Guides for Better Senior Living

Care Cost Calculator: See Prices in Your Area

Nursing Home Data Explorer

Don’t Wait Too Long: 7 Red Flag Signs Your Parent Needs Assisted Living Now

The True Cost of Assisted Living in 2025 – And How Families Are Paying For It

Understanding Senior Living Costs: Pricing Models, Discounts & Financial Assistance