Ascension Living Resurrection Place
Nursing Home · Park Ridge, IL
CMS overall rating Info The Overall CMS Rating is scored from 1 to 5 stars and combines results from health inspections, staffing levels, and quality measures. Health inspections carry the most weight. Staffing and quality scores can increase or decrease the final rating based on performance compared to state and national standards.

Ascension Living Resurrection Place

Nursing Home · Park Ridge, IL
CMS overall rating Info The Overall CMS Rating is scored from 1 to 5 stars and combines results from health inspections, staffing levels, and quality measures. Health inspections carry the most weight. Staffing and quality scores can increase or decrease the final rating based on performance compared to state and national standards.
Calculator: See prices in your area
Ascension Living Resurrection Place accepts Medicare and private pay.

Overview of Ascension Living Resurrection Place

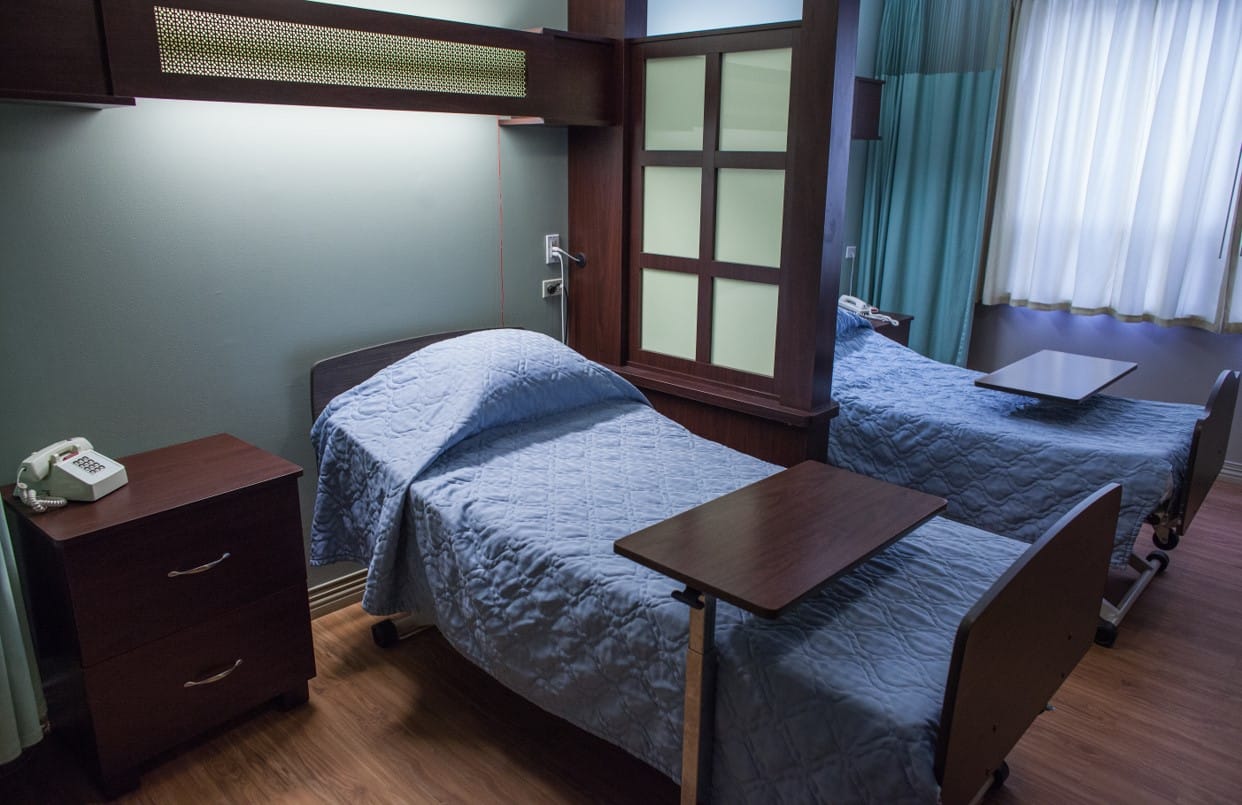
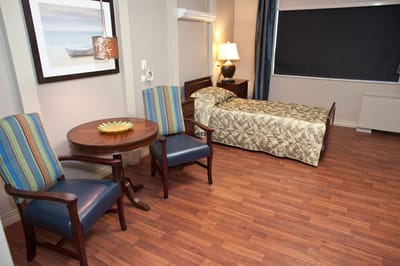
Nestled in the neighborhood of Park Ridge, IL, Ascension Living Resurrection Place is a trusted senior care provider, offering excellent skilled nursing care and rehabilitation services. Designed to help its residents regain strength, flexibility and mobility, and their independence, the community offers access to physical, occupational and speech-language therapies. Residents are offered their semi-private or private room with plenty of space for visiting families and friends while fostering a home-like atmosphere.

The community’s care team helps residents to reach their recovery and care goals by collaborating closely with them and their healthcare team in creating personalized care plans tailored to their needs. Delicious meals and vibrant activities, events, and clubs are also available for a complete living experience. Here, residents have the opportunities and tools they need to enjoy their recovery journey and live their lives fully.

(847) 692-5600

Quality ratings

Measured by Centers for Medicare & Medicaid Services (CMS)

Overall rating Info The Overall CMS Rating combines results from health inspections, staffing levels and quality measures. Health inspections carry the most weight. Staffing and quality scores can increase or decrease the final rating based on performance compared to state and national standards.
▼ 60.3% Below IL avg. ▼ 60.3% Below IL avg.Click the badge to see the full State ranking.Click here to see the full State ranking.
Health Inspection Info Based on the results of the facility's three most recent standard inspections and any complaint investigations. CMS reviews the number, scope, and severity of deficiencies, with more recent findings weighted more heavily.
▼ 28.0% Below IL avg. ▼ 28.0% Below IL avg.Click the badge to see the full State ranking.Click here to see the full State ranking.
Staffing Info Measures average nursing staff hours per resident per day, including Registered Nurses (RNs) and total nursing staff. Ratings are adjusted based on the level of care residents require and are compared to state and national benchmarks.
▼ 6.4% Below IL avg. ▼ 6.4% Below IL avg.Click the badge to see the full State ranking.Click here to see the full State ranking.
Quality Measures Info Based on clinical and physical health indicators reported to CMS, such as hospital readmissions, falls, pressure ulcers, and improvements in mobility. These measures reflect how well residents' health needs are being managed.
▼ 64.5% Below IL avg. ▼ 64.5% Below IL avg.Click the badge to see the full State ranking.Click here to see the full State ranking.

Staffing hours breakdown

Info Daily nursing hours per resident by staff type, reported to CMS. Higher is generally better — compare this facility to state and national averages to see where staffing stands.

Hours per resident per day — compared to Illinois state averages

Total nursing care / resident Info This home is ranked 58th out of 167 homes in Illinois. Total adjusted nursing hours per resident per day, combining RN, LPN, and aide time. CMS adjusts this for case-mix so facilities can be fairly compared.
3h 26m per day
Rank #58 / 167Nurse hours — State benchmarkedThis home is ranked 58th out of 167 homes in Illinois. Shows adjusted nurse hours per resident per day benchmarked to the Illinois average, with a ranking across 167 Illinois SNFs. More hours mean more direct care. The national average is about 3.5 hrs; below 3.0 is a red flag.Click the rank badge to see the full State ranking.Click here to see the full State ranking.
This facility Illinois avg (3h 6m per day)
vs Illinois avg
+11%

2 of 6 metrics below state avg

Standout metric Registered Nurse (RN) is +70% above state avg
Staff typeHours / Day / Residentvs state avg
Registered Nurse (RN) Info RNs hold the highest nursing license and can assess residents, interpret test results, and direct care plans. More RN hours per day often signals stronger clinical oversight and faster response to health changes. 1h 15m per day ▲ 70% State avg: 44m per day · National avg: 41m per day
LPN / LVN Info Licensed Practical Nurses (LPNs) or Licensed Vocational Nurses (LVNs) deliver routine hands-on care — medication administration, wound dressing, and monitoring vital signs. They work under RN supervision and make up a large share of daily bedside care. 19m per day ▼ 50% State avg: 38m per day · National avg: 52m per day
Nurse Aide Info Certified Nurse Aides (CNAs) provide the most direct day-to-day assistance: bathing, dressing, feeding, and mobility. Nurse aide hours are typically the largest staffing category and directly affect residents' quality of life. 1h 38m per day ▼ 23% State avg: 2h 8m per day · National avg: 2h 21m per day
Weekend Total Nursing Info Combined nursing hours (RN + LPN + Nurse Aide) per resident per day on weekends. Staffing often drops on weekends — this figure reveals whether the facility maintains adequate coverage outside of weekday hours. 3h 15m per day ▲ 5% State avg: 3h 5m per day · National avg: 3h 26m per day
Physical Therapist Info Hours per resident per day provided by licensed Physical Therapists (PTs) or PT Assistants. PT services help residents recover mobility after injury or illness and are especially important for post-acute (short-stay) rehabilitation. 5m per day ▲ 67% State avg: 3m per day · National avg: 4m per day
Weekend RN Info Registered nurse hours specifically on weekends. Facilities sometimes reduce RN presence on Saturdays and Sundays — a low weekend RN figure compared to weekday hours can indicate reduced clinical oversight when most administrative staff are absent. 57m per day ▲ 68% State avg: 34m per day · National avg: 29m per day

Types of Care at Ascension Living Resurrection Place

Nursing Home

Capacity and availability

This home usually has availability

Occupancy lower than 85% suggests more openings may be available.

Lower occupancy than the Illinois average: 69.3%
Occupancy rate 34.3% Rank #187 / 199Occupancy rate — State benchmarkedThis home is ranked 187th out of 199 homes in Illinois. Shows this facility's occupancy rate versus the Illinois average, with its Statewide rank out of 199. Higher occupancy signals strong local demand and financial stability.Click the rank badge to see the full State ranking.Click here to see the full State ranking.
Avg. Length of Stay 64 days
Occupancy rate
34.3% Rank #187 / 199Occupancy rate — State benchmarkedThis home is ranked 187th out of 199 homes in Illinois. Shows this facility's occupancy rate versus the Illinois average, with its Statewide rank out of 199. Higher occupancy signals strong local demand and financial stability.Click the rank badge to see the full State ranking.Click here to see the full State ranking.
Avg. Length of Stay
64 days
Walk Score
Walk Score: 38 / 100 Rank #433 / 647Walk Score — State benchmarkedThis home is ranked 433rd out of 647 homes in Illinois. Shows how walkable this facility's neighborhood is compared to the average Walk Score across Illinois SNFs. Higher scores benefit residents, families, and staff.Click the rank badge to see the full State ranking.Click here to see the full State ranking.
Somewhat walkable. A few nearby services may be reachable on foot, but most trips require transportation.

Contact Ascension Living Resurrection Place

Staffing Data

Reporting period: October 1 – December 31, 2025 (Q4 2025). Source: CMS Payroll-Based Journal report.

Total staff 395
Employees 88
Contractors 307
Staff to resident ratio 3.46:1
93% better than Illinois average
Illinois average ratio: 1.80:1 Illinois average ratio: 1.80:1See full Illinois ranking
Avg staff/day 65
Average shift 7.4 hours
0% compared with Illinois average
Illinois average: 7.6 hours Illinois average shift: 7.6 hoursSee full Illinois ranking
Total staff hours (quarter) 44,105

Nursing staff breakdown

Q4 2025 · Oct 1 – Dec 31 More info This data comes from the CMS Payroll-Based Journal report covering October 1 – December 31, 2025.
Registered Nurse

Manages medical care and health needs.

RN Staff 68
Average shift length Info Average shift length. Calculated as total hours divided by days worked and average staff per day. 7.7 hours

This role is partially covered by contractors.

Licensed Practical Nurse

Assists with medical care and medications.

LPN Staff 73
Average shift length Info Average shift length. Calculated as total hours divided by days worked and average staff per day. 6.9 hours

This role is partially covered by contractors.

Certified Nursing Assistant

Helps with daily care and mobility.

CNA Staff 216
Average shift length Info Average shift length. Calculated as total hours divided by days worked and average staff per day. 7.8 hours

This role is partially covered by contractors.

Contractor staffing

Q4 2025 · Oct 1 – Dec 31 More info This data comes from the CMS Payroll-Based Journal report covering October 1 – December 31, 2025.

Total hours from contractors

32.3%

14,250 contractor hours this quarter

Certified Nursing Assistant: 175 Licensed Practical Nurse: 63 Registered Nurse: 46 Qualified Social Worker: 6 Respiratory Therapy Technician: 5 Speech Language Pathologist: 4 Physical Therapy Aide: 4 Physical Therapy Assistant: 4

Staff by category

Q4 2025 · Oct 1 – Dec 31 More info This data comes from the CMS Payroll-Based Journal report covering October 1 – December 31, 2025.
Certified Nursing Assistant4117521618,47492100%7.8
Registered Nurse22466810,06292100%7.7
Licensed Practical Nurse1063734,62792100%6.9
Clinical Nurse Specialist6062,5109199%5.8
Other Dietary Services Staff3031,3838997%8
Physical Therapy Aide0441,1877177%6.9
Speech Language Pathologist0449818896%6.2
Respiratory Therapy Technician0559677582%7.7
Physical Therapy Assistant0445627177%7.7
Qualified Social Worker0665436773%7.2
Administrator1015129098%5.7
Nurse Practitioner1015129098%5.7
Dietitian1014958592%5.8
Mental Health Service Worker1014948896%5.6
Dental Services Staff1014575762%8
RN Director of Nursing1013396065%5.7
216 Certified Nursing Assistant
% of Days 100%
68 Registered Nurse
% of Days 100%
73 Licensed Practical Nurse
% of Days 100%
6 Clinical Nurse Specialist
% of Days 99%
3 Other Dietary Services Staff
% of Days 97%
4 Physical Therapy Aide
% of Days 77%
4 Speech Language Pathologist
% of Days 96%
5 Respiratory Therapy Technician
% of Days 82%
4 Physical Therapy Assistant
% of Days 77%
6 Qualified Social Worker
% of Days 73%
1 Administrator
% of Days 98%
1 Nurse Practitioner
% of Days 98%
1 Dietitian
% of Days 92%
1 Mental Health Service Worker
% of Days 96%
1 Dental Services Staff
% of Days 62%
1 RN Director of Nursing
% of Days 65%

Penalties and fines

Includes penalties issued in 2024-2025

Federal penalties imposed by CMS for regulatory violations, including civil money penalties (fines) and denials of payment for new Medicare/Medicaid admissions.

Source: CMS Penalties Database (Data as of Jan 2026)

Total fines amount $244K Rank #155 / 168Federal fines — State benchmarkedThis home is ranked 155th out of 168 homes in Illinois. Shows this facility's cumulative CMS federal fine dollars versus the Illinois average among facilities with fines, and where it ranks among 168 skilled nursing facilities in the pool. Lower total dollars mean a better rank.Click the rank badge to see the full State ranking.Click here to see the full State ranking.
71% higher than Illinois average

Illinois average: $143K

Number of fines 4
35% more fines than Illinois average

Illinois average: 3.0

Payment Denials Info Serious action where Medicare and/or Medicaid temporarily stops payments for new residents until issues are fixed. 3
183% more payment denials than Illinois average

Illinois average: 1.1

Fines amount comparison
This facility $244K
Illinois average $143K
Penalty History

Penalties are imposed by CMS for violations of federal nursing home regulations.

7 penalties in the past 3 years

Multiple penalties were reported in the last 3 years.

Civil Money Penalty Info Fines imposed for noncompliance, which can be assessed per day or per instance of violation. Mar 14, 2025
$82K
Payment Denial Info Serious action where Medicare and/or Medicaid temporarily stops payments for new residents until issues are fixed. Mar 14, 2025
1 days
Civil Money Penalty Info Fines imposed for noncompliance, which can be assessed per day or per instance of violation. Dec 26, 2024
$22K
Civil Money Penalty Info Fines imposed for noncompliance, which can be assessed per day or per instance of violation. May 2, 2024
$88K

Last updated: Jan 2026

Quality of care over time

These measures show how residents usually do over time at this home, based on health outcomes and preventive care.

High-risk clinical events score Info A composite score based on pressure ulcers, falls with injury, weight loss, walking ability decline, and activities of daily living decline. 12.8
32% worse than Illinois average

Illinois average: 9.7

Functional decline score Info A composite score based on activities of daily living decline, walking ability decline, and incontinence. 19.0
In line with Illinois average

Illinois average: 18.6

Long-stay resident measures
Average Illinois avg: 3.6 Info CMS star rating based on long-stay quality measure performance. 5 stars = significantly above average, 1 star = significantly below average.
Need for Help with Daily Activities Increased Info Percent of long-stay residents whose need for help with daily activities has increased 20.4%
32% worse than Illinois average

Illinois average: 15.5%

Walking Ability Worsened Info Percent of long-stay residents whose ability to move independently worsened 22.8%
24% worse than Illinois average

Illinois average: 18.4%

Low Risk Residents with Bowel/Bladder Incontinence Info Percent of low risk long-stay residents who lose control of their bowels or bladder 13.7%
36% better than Illinois average

Illinois average: 21.6%

Falls with Major Injury Info Percent of long-stay residents experiencing one or more falls with major injury 4.4%
32% worse than Illinois average

Illinois average: 3.4%

High Risk Residents with Pressure Ulcers Info Percent of long-stay high risk residents with pressure ulcers 4.6%
13% better than Illinois average

Illinois average: 5.3%

Urinary Tract Infection Info Percent of long-stay residents with a urinary tract infection 2.3%
28% worse than Illinois average

Illinois average: 1.8%

Lost Too Much Weight Info Percent of long-stay residents who lose too much weight 11.8%
80% worse than Illinois average

Illinois average: 6.5%

Depressive Symptoms Info Percent of long-stay residents who have depressive symptoms 15.7%
67% better than Illinois average

Illinois average: 48.1%

Antipsychotic Use Info Percent of long-stay residents who received an antipsychotic medication 17.0%
16% better than Illinois average

Illinois average: 20.2%

Pneumococcal Vaccine Info Percent of long-stay residents assessed and appropriately given the pneumococcal vaccine 96.4%
8% better than Illinois average

Illinois average: 89.2%

Influenza Vaccine Info Percent of long-stay residents assessed and appropriately given the seasonal influenza vaccine 100.0%
9% better than Illinois average

Illinois average: 91.6%

Hospitalizations per 1,000 days Info Number of hospitalizations per 1,000 long-stay resident days. 3.92
91% worse than Illinois average

Illinois average: 2.05

ED visits per 1,000 days Info Number of outpatient emergency department visits per 1,000 long-stay resident days. 0.94
58% better than Illinois average

Illinois average: 2.25

Short-stay resident measures
Significantly below average Illinois avg: 2.3 Info CMS star rating based on short-stay quality measure performance. 5 stars = much above average, 1 star = much below average.
Pneumococcal Vaccine Info Percent of short-stay residents assessed and appropriately given the pneumococcal vaccine 81.3%
19% better than Illinois average

Illinois average: 68.3%

Antipsychotic medication increase Info Percent of short-stay residents who newly received an antipsychotic medication 3.5%
51% worse than Illinois average

Illinois average: 2.3%

Influenza Vaccine Info Percent of short-stay residents assessed and appropriately given the seasonal influenza vaccine 73.6%
17% better than Illinois average

Illinois average: 63.0%

Re-hospitalized after SNF stay Info Percentage of short-stay residents who were re-hospitalized after their nursing home admission. 34.7%
32% worse than Illinois average

Illinois average: 26.2%

Emergency department visits Info Percentage of short-stay residents who had an outpatient emergency department visit. 13.3%
5% better than Illinois average

Illinois average: 14.0%

Falls with major injury Info Percentage of SNF residents who experience falls with major injury during their stay. 0.0%
100% better than Illinois average

Illinois average: 0.8%

Ability to care for self at discharge Info Percentage of residents at or above expected ability to care for themselves at discharge. 31.5%
41% worse than Illinois average

Illinois average: 53.7%

Successful return to home or community Info Rate of successful return to home or community from a skilled nursing facility. 51.1%
In line with Illinois average

Illinois average: 50.6%

Breakdown by payment type

Medicare

40% of new residents, usually for short-term rehab.

Typical stay 20 days

Private pay

60% of new residents, often for short stays.

Typical stay 3 - 4 months

Facility Characteristics

Source: CMS Long-Term Care Facility Characteristics (Data as of Jan 2026)

Total residents 114
Medicare
18
15.8% of residents
Medicaid
70
61.4% of residents
Private pay or other
26
22.8% of residents
Programs & Services
Residents Group

Residents meet regularly to discuss policies, care quality, and activities

Active Resident Council

Organized group of residents that meets regularly to discuss facility policies, quality of life, and activities.

Finances and operations

Voluntary non-profit community
Operated by a church.
Home revenue
$14.8M
Operating deficit
-$4.8M
Voluntary non-profit community Operated by a church.
Home revenue
$14.8M Rank #87 / 166Revenue — State benchmarkedThis home is ranked 87th out of 166 homes in Illinois. Shows this facility's annual revenue compared to the Illinois SNF average. Higher revenue generally means more resources for staffing and capital — read alongside Payroll %.Click the rank badge to see the full State ranking.Click here to see the full State ranking.
Operating deficit
-$4.8M
Payroll costs Info The portion of the home's budget spent on staff, including nurses, caregivers, and other employees who support care and operations. Rank #44 / 166Payroll — State benchmarkedThis home is ranked 44th out of 166 homes in Illinois. Shows total annual staff payroll benchmarked to the Illinois average. Higher payroll investment relative to peers often signals better staffing and less reliance on cheaper contract labor.Click the rank badge to see the full State ranking.Click here to see the full State ranking.
$10.3M
69.7% of revenue Rank #11 / 166Payroll % — State benchmarkedThis home is ranked 11th out of 166 homes in Illinois. Shows payroll as a percentage of revenue versus the Illinois average. Well-run Illinois SNFs typically land around 54–67% — the top third Statewide. Below 25% may signal understaffing or heavy agency use — read with Staffing ratings.Click the rank badge to see the full State ranking.Click here to see the full State ranking.
Other operating costs Info All remaining costs needed to run the home, such as food, utilities, building maintenance, supplies and administrative expenses.
$9.3M
Total costs $19.6M

What does this home offer?

Total residents icon

Total Residents: 296 Residents

Room sizes icon
Room sizes icon

Room Sizes: Private / Semi-Private Rooms

Building type icon
Building type icon

Building Type: 3-story

Beauty services icon

Beauty Services

Parking Available icon

Parking Available

Exercise program icon

Exercise Programs

Who this home usually serves

TYPE OF STAY

Primarily short stays

Residents typically stay for brief periods, with frequent admissions and discharges throughout the year.

Places of interest near Ascension Living Resurrection Place

Address 1.0 miles from city center Info Estimated distance in miles from Park Ridge's city center to Ascension Living Resurrection Place's address, calculated via Google Maps.

Calculate Travel Distance to Ascension Living Resurrection Place

Add your location

Address

Financial Assistance for
Nursing Home in Illinois

Ascension Living Resurrection Place is located in Park Ridge, Illinois.
Here are the financial assistance programs available to residents in Illinois.

Get Financial aid guidance

Community Care Program

Illinois CCP

Age 60+
General Illinois resident, at risk of nursing home placement.
Income Limits (2025) ~$1,215/month individual
Asset Limits $17,500 individual, excludes home, car
IL

High demand in urban areas; waitlists possible.

Benefits
In-home care (3-5 hours/day) Adult day services ($65/day) Emergency home response systems ($30/month)

Illinois Respite Program

IL Respite (via NFCSP)

Age Caregiver of someone 60+ (or with dementia)
General Illinois resident.
Income Limits No strict limit; prioritizes low-income.
Asset Limits Not applicable.
IL

Limited slots; urban/rural balance.

Benefits
In-home respite (4-6 hours/day) Adult day care (~$65/day) Short-term facility care (up to 5 days)

Supportive Living Program (SLP)

Illinois Medicaid Supportive Living Program

Age 65+ or 22-64 with disability
General Illinois resident, Medicaid-eligible, needs moderate assistance (not nursing home-level).
Income Limits (2025) ~$2,829/month (300% FBR, individual); QIT allowed.
Asset Limits $2,000 (individual), $3,000 (couple) (excludes home, car).
IL

~200 SLP sites statewide; room/board not covered.

Benefits
Personal care (5-7 hours/day, e.g., bathing, mobility) Meals Housekeeping Medication management Respite (~240 hours/year)

Persons Who Are Elderly Waiver

Illinois Medicaid Elderly Waiver

Age 65+
General Illinois resident, Medicaid-eligible, nursing home-level care need.
Income Limits (2025) ~$2,829/month 300% FBR, individual
Asset Limits $2,000 (individual), $3,000 (couple).
IL

Part of HealthChoice Illinois; consumer-directed options available.

Benefits
Personal care (5-7 hours/day, e.g., dressing, eating) Homemaker Adult day care (~$60/day) Respite (240 hours/year) Home mods ($1,000 avg.)

Medicare Savings Program (MSP)

Illinois Medicare Savings Program

Age 65+ or disabled
General Illinois resident, Medicare Part A/B.
Income Limits (2025) ~$2,510/month (QMB), ~$3,380/month (SLMB), ~$3,598/month (QI)—individual.
Asset Limits $9,430 (individual), $14,130 (couple).
IL

Three tiers; no waitlist.

Benefits
Covers Part B premiums ($174.70/month) Deductibles ($240/year) Copays (~20%)

Optional State Supplementation (OSS)

Illinois Optional State Supplementation

Age 65+ or disabled
General Illinois resident, in approved facility, SSI recipient or low-income.
Income Limits (2025) ~$1,004/month including SSI
Asset Limits $2,000 (individual), $3,000 (couple).
IL

~$50-$500/month based on facility type.

Benefits
Cash (~$50-$500/month) for room/board in personal care homes or SLFs

VA Aid and Attendance (A&A) and Housebound Benefits

Illinois VA Aid and Attendance/Housebound

Age 65+ or disabled veteran/spouse
General Illinois resident, wartime service, need for ADL help (A&A) or homebound.
Income Limits (2025) Net income < ~$1,984/month (veteran with dependent, A&A); pension offsets income.
Asset Limits ~$155,356 net worth limit
IL

High veteran demand in urban/rural areas.

Benefits
Cash (~$1,433-$2,642/month veteran, ~$951-$1,318 spouse) for care costs (e.g., in-home, assisted living)

Compare Nursing Home around Park Ridge

The information below is reported by the Illinois Department of Public Health, Office of Health Care Regulation.

3 facilities compared · CMS & IL Dept. of Health data

Filter by care type
Park Ridge Healthcare Center
NH

Nursing Home Licensed facility providing 24/7 skilled nursing care for residents with complex, ongoing medical needs. Staffed by RNs, LPNs, and CNAs. Inspected and star-rated annually by CMS. Accepts Medicare (short-term rehab) and Medicaid (long-term care).

MC

Memory Care Secured, specialized care for people living with Alzheimer's or dementia. Staff trained in cognitive impairment, with higher staff-to-resident ratios and an environment designed to reduce confusion and wandering risk.

Park Ridge46 86.9% +25%2.90 -28%-6%$0102.0-43 67 Robert Weisz$5.1M$2.7M53%145839
Avantara Park Ridge
NH

Nursing Home Licensed facility providing 24/7 skilled nursing care for residents with complex, ongoing medical needs. Staffed by RNs, LPNs, and CNAs. Inspected and star-rated annually by CMS. Accepts Medicare (short-term rehab) and Medicaid (long-term care).

AL

Assisted Living A licensed, long-term care setting for seniors or individuals with disabilities who need help with daily activities — like bathing, dressing, and medication management — but not 24-hour skilled nursing. Offers housing, meals, and around-the-clock support while aiming to maximize resident independence.

Park Ridge154 82.9% +20%3.06 -9%-1%$86.9k171.96137 70 Erin Levy$26.5M$9.9M37.4%145667
Ascension Living Resurrection Place
NH

Nursing Home Licensed facility providing 24/7 skilled nursing care for residents with complex, ongoing medical needs. Staffed by RNs, LPNs, and CNAs. Inspected and star-rated annually by CMS. Accepts Medicare (short-term rehab) and Medicaid (long-term care).

AL

Assisted Living A licensed, long-term care setting for seniors or individuals with disabilities who need help with daily activities — like bathing, dressing, and medication management — but not 24-hour skilled nursing. Offers housing, meals, and around-the-clock support while aiming to maximize resident independence.

IL

Independent Living Lifestyle-focused communities for older adults offering dining, activities, and transportation with minimal personal care. Best for active, independent seniors who want community without medical support.

MC

Memory Care Secured, specialized care for people living with Alzheimer's or dementia. Staff trained in cognitive impairment, with higher staff-to-resident ratios and an environment designed to reduce confusion and wandering risk.

Park Ridge (North Greenwood Avenue)298 34.3% -50%3.43 +21%+11%$244.1k523.310117 38 Daniel Stricker$14.8M$10.3M69.7%145324

Frequently Asked Questions about Ascension Living Resurrection Place

What neighborhood is Ascension Living Resurrection Place in?

Ascension Living Resurrection Place is in the North Greenwood Avenue neighborhood.

Is Ascension Living Resurrection Place in a walkable area?

Ascension Living Resurrection Place has a walk score of 38. Somewhat walkable. A few nearby services may be reachable on foot, but most trips require transportation.

What is the address of Ascension Living Resurrection Place?

Ascension Living Resurrection Place is located at 1001 N Greenwood Ave, Park Ridge, IL 60068, United States.

What is the phone number of Ascension Living Resurrection Place?

(847) 692-5600 will put you in contact with the team at Ascension Living Resurrection Place.

Is Ascension Living Resurrection Place Medicare or Medicaid certified?

Yes — Ascension Living Resurrection Place is a CMS-certified provider of Medicare and Medicaid.

Guides for Better Senior Living

Care Cost Calculator: See Prices in Your Area

Nursing Home Data Explorer

Don’t Wait Too Long: 7 Red Flag Signs Your Parent Needs Assisted Living Now

The True Cost of Assisted Living in 2025 – And How Families Are Paying For It

Understanding Senior Living Costs: Pricing Models, Discounts & Financial Assistance

Explore Open Rooms
1 Contact details
2 What type of senior care service are you looking for?
3 What budget do you have in mind for senior care?
4 How soon do you need to find care?
5 Additional details

Thank you for your interest!

Our team will be in touch shortly to help with next steps.