


Total health inspections
13
Michigan average 6.5
Last Health inspection on Aug 2025
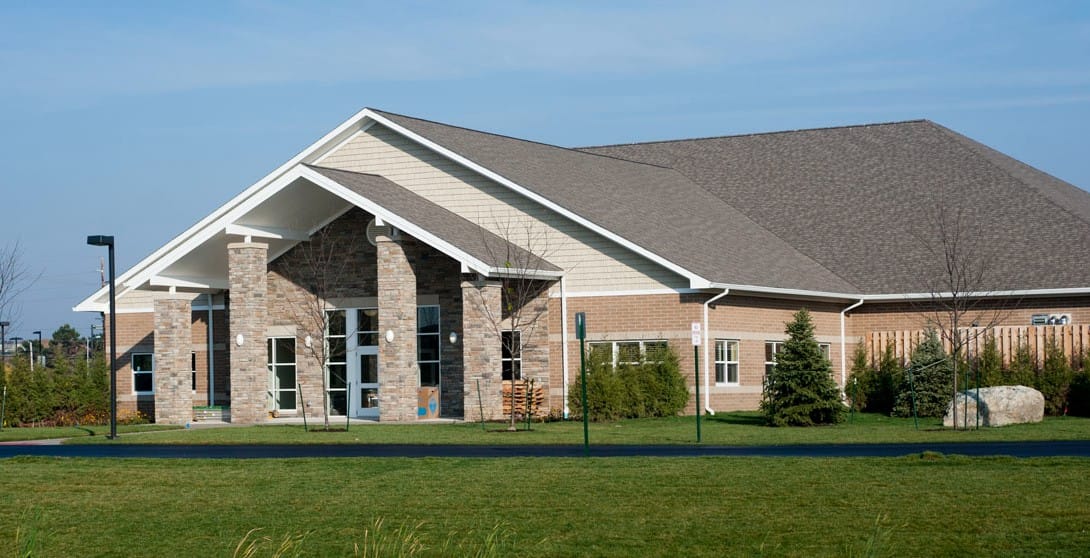
Burrowed in the neighborhood of West Bloomfield, MI, Notting Hill of West Bloomfield is a dependable senior living community that offers a full spectrum of skilled nursing care and rehabilitation services. Dedicated to helping its residents get back to their old routines after an illness, injury, or hospitalization, the community offers access to excellent therapy services, including physical, speech, and occupational therapy. The community makes sure residents are well-cared for by offering a team of highly competent and compassionate care professionals, including physicians, registered nurses, and therapists.
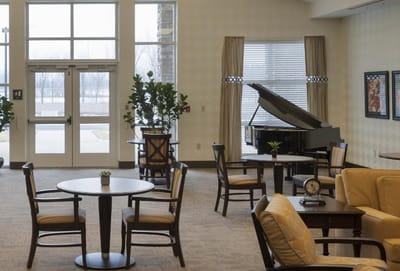
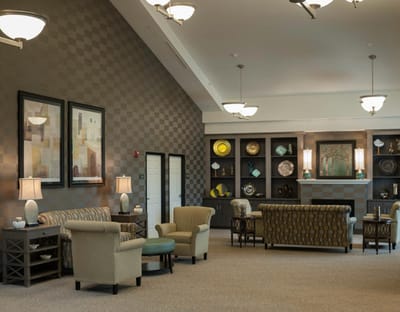
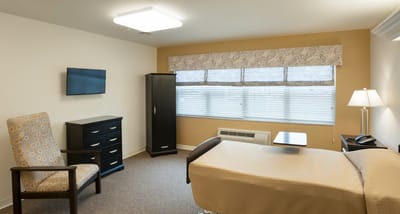
Dedicated to helping its residents remain as comfortable as possible, the community offers cozy accommodations and a wide range of convenient amenities like a medical spa, 24-hour room service, massage therapy, and more. Vibrant on-site activities keep residents entertained and happy while delicious, healthy meals keep them nourished and healthy. Here, residents are empowered to preserve their optimal wellbeing.
| Staff type | Hours / Day / Resident | vs state avg |
|---|---|---|
|
Registered Nurse (RN)
| 22m per day | ▼ 52% State avg: 46m per day · National avg: 41m per day |
|
LPN / LVN
| 1h 10m per day | ▲ 32% State avg: 53m per day · National avg: 52m per day |
|
Nurse Aide
| 1h 58m per day | ▼ 18% State avg: 2h 23m per day · National avg: 2h 21m per day |
|
Weekend Total Nursing
| 3h 2m per day | ▼ 14% State avg: 3h 31m per day · National avg: 3h 26m per day |
|
Physical Therapist
| 7m per day | ▲ 80% State avg: 4m per day · National avg: 4m per day |
|
Weekend RN
| 10m per day | ▼ 64% State avg: 29m per day · National avg: 29m per day |
In Michigan, the Department of Licensing and Regulatory Affairs (LARA) conducts unannounced inspections and investigations to ensure long-term care facilities comply with state health codes.
Deficiencies
| This Facility | MI Average | vs. MI Avg |
|---|---|---|---|
|
Total deficiencies
| 85 | 8 | This facility has 963% more total deficiencies than a typical Michigan nursing home (85 vs. MI avg 8).↑ 963% worse |
Michigan average 6.5
Last Health inspection on Aug 2025
Michigan average 33.5
Michigan average 5.18
Health citations are formal notices following inspections when they fail to comply with safety and care standards.
29 of 67 citations resulted from standard inspections; 21 of 67 resulted from complaint investigations; and 17 of 67 came from combined inspections (standard and complaint).
Michigan average: 0.3
Michigan average: 1.9
Reporting period: October 1 – December 31, 2025 (Q4 2025). Source: CMS Payroll-Based Journal report.
Manages medical care and health needs.
Assists with medical care and medications.
Helps with daily care and mobility.
Total hours from contractors
2,942 contractor hours this quarter
| Certified Nursing Assistant | 59 | 0 | 59 | 16,971 | 92 | 100% | 7.5 |
| Licensed Practical Nurse | 49 | 0 | 49 | 8,859 | 92 | 100% | 9.4 |
| Other Dietary Services Staff | 5 | 0 | 5 | 1,661 | 91 | 99% | 8 |
| Registered Nurse | 11 | 0 | 11 | 1,593 | 91 | 99% | 8.7 |
| Physical Therapy Assistant | 0 | 4 | 4 | 1,475 | 66 | 72% | 7.7 |
| RN Director of Nursing | 4 | 0 | 4 | 1,193 | 75 | 82% | 8.2 |
| Clinical Nurse Specialist | 2 | 4 | 6 | 1,118 | 68 | 74% | 8.1 |
| Respiratory Therapy Technician | 0 | 3 | 3 | 1,038 | 71 | 77% | 8 |
| Dietitian | 1 | 0 | 1 | 512 | 64 | 70% | 8 |
| Mental Health Service Worker | 1 | 0 | 1 | 496 | 62 | 67% | 8 |
| Nurse Practitioner | 1 | 0 | 1 | 480 | 60 | 65% | 8 |
| Administrator | 1 | 0 | 1 | 464 | 58 | 63% | 8 |
| Occupational Therapy Aide | 1 | 2 | 3 | 282 | 39 | 42% | 6.9 |
| Dental Services Staff | 2 | 0 | 2 | 171 | 32 | 35% | 5 |
| Speech Language Pathologist | 0 | 1 | 1 | 58 | 32 | 35% | 1.8 |
| Occupational Therapy Assistant | 0 | 4 | 4 | 50 | 45 | 49% | 1.1 |
| Medical Director | 0 | 2 | 2 | 31 | 15 | 16% | 2.1 |
| Qualified Social Worker | 0 | 1 | 1 | 11 | 6 | 7% | 1.8 |
Includes penalties issued in 2024-2025
Federal penalties imposed by CMS for regulatory violations, including civil money penalties (fines) and denials of payment for new Medicare/Medicaid admissions.
Source: CMS Penalties Database (Data as of Jan 2026)
Michigan average: $76K
Michigan average: 2.0
Michigan average: 0.8
Penalties are imposed by CMS for violations of federal nursing home regulations.
6 penalties in the past 3 years
Multiple penalties were reported in the last 3 years.
Last updated: Jan 2026
These measures show how residents usually do over time at this home, based on health outcomes and preventive care.
Michigan average: 8.4
Michigan average: 16.3
Michigan average: 12.5%
Michigan average: 15.3%
Michigan average: 21.0%
Michigan average: 3.2%
Michigan average: 5.7%
Michigan average: 1.7%
Michigan average: 5.7%
Michigan average: 3.9%
Michigan average: 15.0%
Michigan average: 94.9%
Michigan average: 95.0%
Michigan average: 1.74
Michigan average: 1.54
Michigan average: 82.5%
Michigan average: 1.4%
Michigan average: 79.5%
Michigan average: 24.2%
Michigan average: 11.5%
Michigan average: 0.8%
Michigan average: 53.7%
Michigan average: 50.6%
Quality measures are calculated from Minimum Data Set (MDS) assessments. For most measures, lower percentages indicate better care quality.
28% of new residents, usually for short-term rehab.
72% of new residents, often for short stays.
Source: CMS Long-Term Care Facility Characteristics (Data as of Jan 2026)
Residents meet regularly to discuss policies, care quality, and activities
Organized group of residents that meets regularly to discuss facility policies, quality of life, and activities.
Data sourced from CMS Long-Term Care Facility Characteristics quarterly report. Payer mix reflects the current resident census by primary payment source.
Historical financial and operational data for Notting Hill of West Bloomfield from 2014–2023, based on CMS SNF Cost Reports.
Key figures below are for fiscal year ending in 12/2023.
Based on CMS SNF Cost Report for fiscal year ending in 12/2023.
Housing Options: Private / Semi-Private Rooms
Building Type: Two-story
Transportation Services
Fitness and Recreation
Three Meals Per Day
Residents typically stay for brief periods, with frequent admissions and discharges throughout the year.
Most new residents arrive under private pay (72% of admissions), and a typical private pay stay runs around 3 months.
Coverage residents most often arrive under.
Coverage residents most often leave under.
![]() 3.0 miles from city center
3.0 miles from city center
![]() Estimated distance in miles from West Bloomfield Township's city center to Notting Hill of West Bloomfield's address, calculated via Google Maps.
Estimated distance in miles from West Bloomfield Township's city center to Notting Hill of West Bloomfield's address, calculated via Google Maps.
Add your location
Info below is compiled from CMS reports & the MI Licensing & Regulatory Affairs (LARA), senior community websites & trusted data sources such as Walk Score & BBB.
Communities are listed from highest to lowest based on our ranking methodology.
| Marvin & Betty Danto Health Care Center | NH HOS RC SNF | West Bloomfield Township | 155
Facility
155
MI AVG
74
Rank
#24 / 430 |
73.6%
Facility
73.6%
MI AVG
74
Rank
#71 / 119 | -1% | 3.82 | -31% | -11% | $49.2k | 49 | 6.1 | 5 | 114 | - |
19
Facility
19
MI AVG
39
Rank
#536 / 703 | Wb Opco LLC | $12.4M*Fiscal year ending 12/2022These figures are from this home's most recent complete cost report — an older period than most facilities report. Compare with that in mind. | $8.2M*Fiscal year ending 12/2022These figures are from this home's most recent complete cost report — an older period than most facilities report. Compare with that in mind. | 66.4%*Fiscal year ending 12/2022These figures are from this home's most recent complete cost report — an older period than most facilities report. Compare with that in mind. | 235288 | ||||
| Medilodge of West Bloomfield | NH RC SNF | West Bloomfield Township | 140
Facility
140
MI AVG
74
Rank
#40 / 430 |
82.4%
Facility
82.4%
MI AVG
74
Rank
#59 / 119 | +11% | 3.78 | -64% | -12% | $62.8k | 65 | 5.9 | 6 | 115 | - |
21
Facility
21
MI AVG
39
Rank
#515 / 703 | - | $12.7MFiscal year ending 12/2023 | $8.0MFiscal year ending 12/2023 | 62.8%Fiscal year ending 12/2023 | 235487 | ||||
| Notting Hill of West Bloomfield | NH HOS RC SNF | West Bloomfield Township | 118
Facility
118
MI AVG
74
Rank
#79 / 430 |
83.9%
Facility
83.9%
MI AVG
74
Rank
#54 / 119 | +13% | 4.13 | -31% | -4% | $167.2k | 67 | 5.2 | 5 | 99 | - |
13
Facility
13
MI AVG
39
Rank
#582 / 703 | Vaira Aljajawi | $14.9MFiscal year ending 12/2023 | $7.1MFiscal year ending 12/2023 | 47.6%Fiscal year ending 12/2023 | 235663 |
Notting Hill of West Bloomfield is located in West Bloomfield Township, Michigan.
Here are the financial assistance programs available to residents in Michigan.
Notting Hill of West Bloomfield has a walk score of 13. Car-dependent. Most errands require a car, with limited nearby walkable options.
Notting Hill of West Bloomfield's occupancy is 80.1%.
No, Notting Hill of West Bloomfield has a no-pet policy.
Notting Hill of West Bloomfield is registered as a for-profit in MI.
Yes — there are 4 photos of Notting Hill of West Bloomfield in the photo gallery on this page.
Notting Hill of West Bloomfield is located at 6535 Drake Rd, West Bloomfield Township, MI 48322.
(248) 592-2000 will put you in contact with the team at Notting Hill of West Bloomfield.
Care Cost Calculator: See Prices in Your Area
Nursing Home Data Explorer
Don’t Wait Too Long: 7 Red Flag Signs Your Parent Needs Assisted Living Now
The True Cost of Assisted Living in 2025 – And How Families Are Paying For It
Understanding Senior Living Costs: Pricing Models, Discounts & Financial Assistance


