Explore Open Rooms
1 Contact details
2 What type of senior care service are you looking for?
3 What budget do you have in mind for senior care?
4 How soon do you need to find care?
5 Additional details

Thank you for your interest!

Our team will be in touch shortly to help with next steps.

Nursing Home in Salem

CMS overall rating Info The Overall CMS Rating combines results from health inspections, staffing levels and quality measures. Health inspections carry the most weight. Staffing and quality scores can increase or decrease the final rating based on performance compared to state and national standards.

Bear Hill Rehabilitation and Nursing Center

Overview of Bear Hill Rehabilitation and Nursing Center

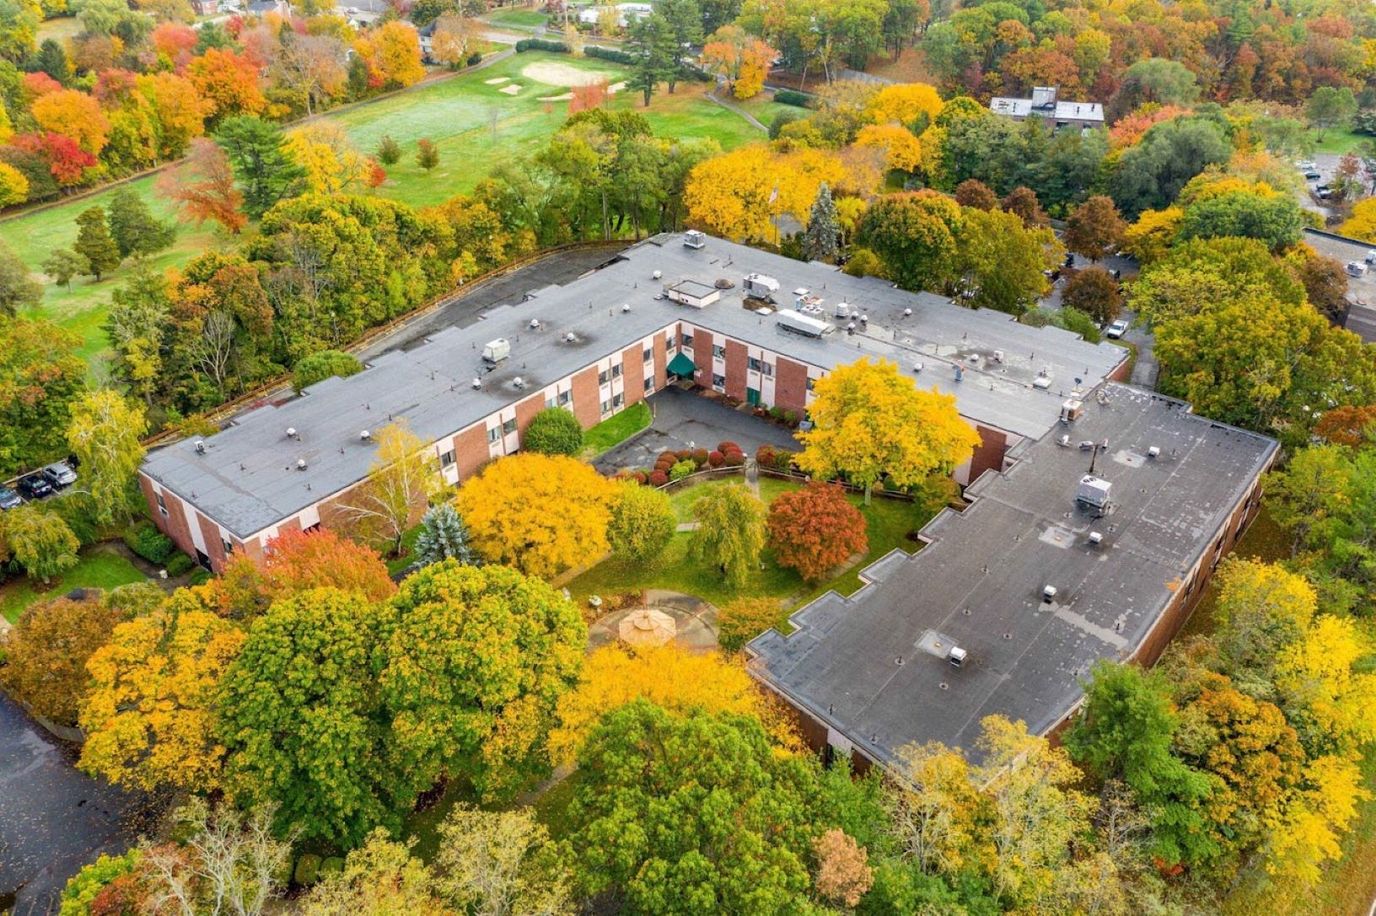
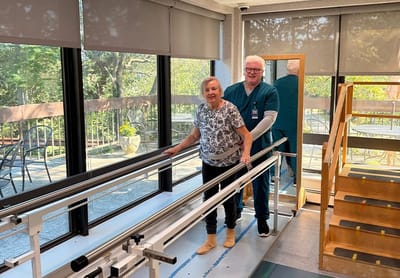
Boasting a reputation for excellent rehabilitation and skilled nursing services, Bear Hill Rehabilitation and Nursing Center is a renowned senior care provider in Stoneham, MA. Residents here are provided with an excellent care team that offers a wide array of services, including round the clock supervision, physical, occupational and speech therapies. Comfortable accommodations and state-of-the-art technology is available to ensure residents have access to the tools they need to recover or maintain their overall well-being.

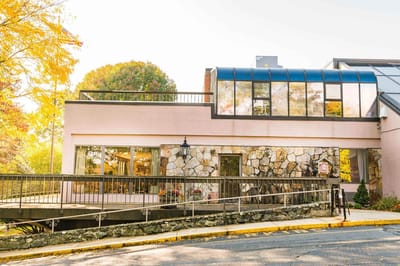
Residents feel right at home and comfortable as they recover with various amenities, such as a cozy lounge, pub, gazebo, and salon offered. An array of stimulating activities are available as well to help residents stay active, engaged, and stimulated. Here, residents are guaranteed to maintain the lifestyle they want with all the conveniences they need to live with comfort and ease.

Quality ratings

Measured by Centers for Medicare & Medicaid Services (CMS)

Overall rating Info The Overall CMS Rating combines results from health inspections, staffing levels and quality measures. Health inspections carry the most weight. Staffing and quality scores can increase or decrease the final rating based on performance compared to state and national standards.
3/5
Massachusetts average: 3.2/5
Health Inspection Info Based on the results of the facility's three most recent standard inspections and any complaint investigations. CMS reviews the number, scope, and severity of deficiencies, with more recent findings weighted more heavily.
3/5
Massachusetts average: 3.0/5
Staffing Info Measures average nursing staff hours per resident per day, including Registered Nurses (RNs) and total nursing staff. Ratings are adjusted based on the level of care residents require and are compared to state and national benchmarks.
2/5
Massachusetts average: 3.4/5
Quality Measures Info Based on clinical and physical health indicators reported to CMS, such as hospital readmissions, falls, pressure ulcers, and improvements in mobility. These measures reflect how well residents' health needs are being managed.
4/5
Massachusetts average: 3.3/5

Nursing care per resident

Info This shows how many total hours of nursing staff time are available per resident each day. Higher numbers usually mean more staff support.
3h 38m per day

This home provides 15% less nursing time per resident than the Massachusetts average.

Massachusetts average: 4h 18m per day

Staffing hours breakdown

Info Hours of care per resident per day, broken down by staff type. Data from CMS Medicare.
Staff type Facility State avg National avg
Registered Nurse (RN) Info Registered nurse hours per resident per day. 30m per day 39m per day 41m per day
Nurse Aide Info Nurse aide hours per resident per day. 2h 21m per day 2h 16m per day 2h 21m per day
Total Nursing (Weekend) Info Total number of nurse staff hours per resident per day on weekends. 3h 29m per day 3h 27m per day 3h 26m per day
Physical Therapist Info Physical therapist staff hours per resident per day. 7m per day 4m per day 4m per day
RN (Weekend) Info Registered nurse hours per resident per day on weekends. 22m per day 28m per day 29m per day

Capacity and availability

This home usually has limited availability

Occupancy is moderate, suggesting balanced demand.

Similar demand to the Massachusetts average
Occupancy rate 89.4%
Residents per day 36
Occupancy rate
89.4%
Residents per day
36

Who this home usually serves

TYPE OF STAY

Mostly short-term rehab stays

Most residents typically stay for a few weeks or months before returning home or moving on.

Might be optimal for
Short stays Recovery Medicare-covered care

Breakdown by payment type

Medicare

62% of new residents, usually for short-term rehab.

Typical stay 24 days

Private pay

27% of new residents, often for short stays.

Typical stay 2 - 3 months

Medicaid

12% of new residents, often for long-term daily care.

Typical stay 1 years

Finances and operations

Privately-owned community
Operated by a business corporation.
Home revenue
$25.2M
Operating loss
-$250.7K
Privately-owned community Operated by a business corporation.
Home revenue
$25.2M
Operating loss
-$250.7K
Payroll costs Info The portion of the home's budget spent on staff, including nurses, caregivers, and other employees who support care and operations.
$9.5M
37.8% of revenue
Other operating costs Info All remaining costs needed to run the home, such as food, utilities, building maintenance, supplies and administrative expenses.
$15.9M
Total costs $25.5M
Years in operation
43 years in operation
A longer operating history, which may indicate experience navigating regulations and delivering ongoing care.
Walk Score
Walk Score: 40 / 100
Somewhat walkable. A few nearby services may be reachable on foot, but most trips require transportation.
BBB Rating
BBB Rating: A+ (Not Accredited)
An independent rating from the Better Business Bureau based on factors such as complaint history, transparency, and business practices.
How BBB ratings work

About this community

Additional Licensing Details

AccreditationsCARF-accredited
AwardsBest Nursing Homes in America by U.S. News and World Report for each of the last five years.

Staffing

Key information about the people who lead and staff this community.

Leadership

ContactMr. Stephen Buckley, Administrator

Therapy & Rehabilitation

3 services
Rehabilitation Services
Respite Care
Short-Term Rehab

Staffing & Medical

1 service
Skilled Nursing

Additional Services

3 services
Subacute Care
Short-Term Rehabilitation
Hospice Care

Additional Policies & Features

Pets Allowed

Amenities & Lifestyle

9 amenities
Spacious Private And Semi-Private Suites
Fine Dining
Scenic Courtyards
Computer/Internet Access
Cozy Pub And Lounge
On-Site Chapel
On-Site Beauty And Barber Shop
Pet-Friendly Environment
Stimulating Recreation Activities
Specific ProgramsSubacute Rehab, Long-Term Care, Orthopedic Rehab, Cardiac Recovery, Pulmonary Care, Stroke Recovery, Wound Care, Respite Care
Religious ServicesYes

Dining & Nutrition

Food DescriptionQuality dining is a hallmark of Bear Hill, focusing on providing well-prepared meals in an attractive atmosphere.

What does this home offer?

Accepts Medicaid icon

Accept Medicaid: Yes, Accept

Total residents icon

Total Residents: 169 Residents

Building type icon
Building type icon

Building Type: 2-story

Types of Care at Bear Hill Rehabilitation and Nursing Center

Nursing Home

Contact Bear Hill Rehabilitation and Nursing Center

Inspection History

In Massachusetts, the Executive Office of Elder Affairs (for assisted living facilities) and the Department of Public Health (for nursing homes) are the agencies authorized to inspect and report on facility safety.

3 visits/inspections

3 routine inspections

Results

3 with issues

0 without issues

Massachusetts average: 21 visits/inspections

Massachusetts average: 22 complaint visits

Massachusetts average: 4 inspections

Latest inspection

Date December 19, 2024
Routine

32 deficiencies

Deficiencies indicate regulatory issues. A higher number implies the facility had several areas requiring improvement.

Massachusetts average: 28 deficiencies

Health Inspection History

Inspections
Total health inspections 3

Massachusetts average 4.5


Last Health inspection on Dec 2024

Total health citations 34

Massachusetts average 32.7

Citations per inspection
11.33

Massachusetts average 7.24


Health citations are formal notices following inspections when they fail to comply with safety and care standards.

All 34 citations resulted from standard inspections.

Breakdown of citation severity (last 3 years)
Critical Health citations More info 0
100% better than Massachusetts average

Massachusetts average: 0.3


Serious Health citations More info 2
33% worse than Massachusetts average

Massachusetts average: 1.5

0 critical citations More info Massachusetts average: 0.3

2 serious citations More info Massachusetts average: 1.5

30 moderate citations More info Massachusetts average: 29.7

2 minor citations More info Massachusetts average: 1.3
Citations history (last 3 years)
Quality of Care moderate citation Info Issues related to how well residents receive appropriate treatment and support for their medical and daily care needs. Dec 19, 2024
Corrected

Quality of Care moderate citation Info Issues related to how well residents receive appropriate treatment and support for their medical and daily care needs. Dec 19, 2024
Corrected

Care Planning moderate citation Info Issues related to creating and updating personalized care plans for residents based on their needs and conditions. Dec 19, 2024
Corrected

Care Planning moderate citation Info Issues related to creating and updating personalized care plans for residents based on their needs and conditions. Dec 19, 2024
Corrected

Compare Nursing Homes around Salem The information below is reported by the Massachusetts Executive Office of Elder Affairs and Department of Public Health.

3 facilities compared · CMS & MA Dept. of Health data · Updated Apr 2026

Filter by care type
Bear Hill Rehabilitation and Nursing Center
AL

Assisted Living A licensed, long-term care setting for seniors or individuals with disabilities who need help with daily activities — like bathing, dressing, and medication management — but not 24-hour skilled nursing. Offers housing, meals, and around-the-clock support while aiming to maximize resident independence.

IL

Independent Living Lifestyle-focused communities for older adults offering dining, activities, and transportation with minimal personal care. Best for active, independent seniors who want community without medical support.

MC

Memory Care Secured, specialized care for people living with Alzheimer's or dementia. Staff trained in cognitive impairment, with higher staff-to-resident ratios and an environment designed to reduce confusion and wandering risk.

NH

Nursing Home Licensed facility providing 24/7 skilled nursing care for residents with complex, ongoing medical needs. Staffed by RNs, LPNs, and CNAs. Inspected and star-rated annually by CMS. Accepts Medicare (short-term rehab) and Medicaid (long-term care).

Stoneham
169
89.4%
+9%
3.64
-34%
-7%
1
34
11.3
2
141
A+
40
Gestetner, Colev
$23.4M
$9.5M
40.8%
225272
Adviniacare Salem
-
AL

Assisted Living A licensed, long-term care setting for seniors or individuals with disabilities who need help with daily activities — like bathing, dressing, and medication management — but not 24-hour skilled nursing. Offers housing, meals, and around-the-clock support while aiming to maximize resident independence.

HC

Home Care Professional care delivered in the person's own home — from companionship and errands to skilled nursing and therapy. Allows seniors to age in place. Medicare covers skilled home health when medically necessary.

MC

Memory Care Secured, specialized care for people living with Alzheimer's or dementia. Staff trained in cognitive impairment, with higher staff-to-resident ratios and an environment designed to reduce confusion and wandering risk.

NH

Nursing Home Licensed facility providing 24/7 skilled nursing care for residents with complex, ongoing medical needs. Staffed by RNs, LPNs, and CNAs. Inspected and star-rated annually by CMS. Accepts Medicare (short-term rehab) and Medicaid (long-term care).

Salem
-
-
-
-
-
-
-
-
-
0
0
0.0
0
-
-
-
-
-
-
-
-
Pilgrim Rehabilitation and Skilled Nursing Center
-
HC

Home Care Professional care delivered in the person's own home — from companionship and errands to skilled nursing and therapy. Allows seniors to age in place. Medicare covers skilled home health when medically necessary.

NH

Nursing Home Licensed facility providing 24/7 skilled nursing care for residents with complex, ongoing medical needs. Staffed by RNs, LPNs, and CNAs. Inspected and star-rated annually by CMS. Accepts Medicare (short-term rehab) and Medicaid (long-term care).

RC

Respite Care Short-term temporary care — days to weeks — to give family caregivers a break. Full care provided during the stay. Often used after hospitalization or to trial a facility before a permanent placement decision.

Peabody
-
-
-
-
-
-
-
-
-
0
0
0.0
0
-
-
-
-
-
-
-
-

Places of interest near Bear Hill Rehabilitation and Nursing Center

Address 1.5 miles from city center

Calculate Travel Distance to Bear Hill Rehabilitation and Nursing Center

Add your location

Address

Staffing Data (Q2 2025)

This data corresponds to Q2 2025 and is based on CMS Payroll-Based Journal.

Total staff 200
Employees 178
Contractors 22
Staff to resident ratio 1.32:1
22% worse than Massachusetts average

Massachusetts average ratio: 1.70:1

Avg staff/day 79
Average shift 8.6 hours
9% better than Massachusetts average

Massachusetts average: 7.9 hours

Total staff hours (quarter) 61,739
Nursing staff breakdown
Registered Nurse

Manages medical care and health needs.

Total count 17
Average shift length Info Average shift length. Calculated as total hours divided by days worked and average staff per day. 8.1 hours

This role is partially covered by contractors.

Licensed Practical Nurse

Assists with medical care and medications.

Total count 40
Average shift length Info Average shift length. Calculated as total hours divided by days worked and average staff per day. 9.8 hours

This role is partially covered by contractors.

Certified Nursing Assistant

Helps with daily care and mobility.

Total count 99
Average shift length Info Average shift length. Calculated as total hours divided by days worked and average staff per day. 8.8 hours

This role is partially covered by contractors.

Contractor staffing

Total hours from contractors

3.6%

2,231 contractor hours this quarter

Licensed Practical Nurse: 11 Certified Nursing Assistant: 8 Registered Nurse: 3
Staff by category
Certified Nursing Assistant9189931,66891100%8.8
Licensed Practical Nurse29114015,10491100%9.8
Registered Nurse143174,15491100%8.1
Other Dietary Services Staff9092,37991100%7.6
Respiratory Therapy Technician7071,64491100%7.5
Clinical Nurse Specialist3031,3256673%7.5
Physical Therapy Assistant6069278796%6.1
Mental Health Service Worker3038696470%7.7
Physical Therapy Aide3036916976%7.1
Speech Language Pathologist6066286875%6.2
Administrator1015206571%8
Nurse Practitioner1015206571%8
RN Director of Nursing1014495560%8.2
Dietitian1014315965%7.3
Qualified Social Worker3034295763%6.5
99 Certified Nursing Assistant
% of Days 100%
40 Licensed Practical Nurse
% of Days 100%
17 Registered Nurse
% of Days 100%
9 Other Dietary Services Staff
% of Days 100%
7 Respiratory Therapy Technician
% of Days 100%
3 Clinical Nurse Specialist
% of Days 73%
6 Physical Therapy Assistant
% of Days 96%
3 Mental Health Service Worker
% of Days 70%
3 Physical Therapy Aide
% of Days 76%
6 Speech Language Pathologist
% of Days 75%
1 Administrator
% of Days 71%
1 Nurse Practitioner
% of Days 71%
1 RN Director of Nursing
% of Days 60%
1 Dietitian
% of Days 65%
3 Qualified Social Worker
% of Days 63%

Facility Characteristics

Source: CMS Long-Term Care Facility Characteristics (Data as of Jan 2026)

Total census
151 residents
Residents by payment source
Medicare
24 residents (15.9%)
Medicaid
65 residents (43%)
Private pay or other
62 residents (41.1%)
Programs & Services
Residents' Group

Residents meet regularly to discuss policies, care quality, and activities

Active Resident Council

Organized group of residents that meets regularly to discuss facility policies, quality of life, and activities.

Quality of care over time

These measures show how residents usually do over time at this home, based on health outcomes and preventive care.

High-risk clinical events score Info A composite score based on pressure ulcers, falls with injury, weight loss, walking ability decline, and activities of daily living decline. 6.1
41% better than Massachusetts average

Massachusetts average: 10.2

Functional decline score Info A composite score based on activities of daily living decline, walking ability decline, and incontinence. 14.1
29% better than Massachusetts average

Massachusetts average: 20.0

Long-stay resident measures
Significantly above average Massachusetts avg: 3.5 Info CMS star rating based on long-stay quality measure performance. 5 stars = significantly above average, 1 star = significantly below average.
Need for Help with Daily Activities Increased Info Percent of long-stay residents whose need for help with daily activities has increased 8.1%
57% better than Massachusetts average

Massachusetts average: 18.7%

Walking Ability Worsened Info Percent of long-stay residents whose ability to move independently worsened 11.5%
40% better than Massachusetts average

Massachusetts average: 19.3%

Low Risk Residents with Bowel/Bladder Incontinence Info Percent of low risk long-stay residents who lose control of their bowels or bladder 22.8%
In line with Massachusetts average

Massachusetts average: 22.1%

Falls with Major Injury Info Percent of long-stay residents experiencing one or more falls with major injury 0.6%
83% better than Massachusetts average

Massachusetts average: 3.6%

High Risk Residents with Pressure Ulcers Info Percent of long-stay high risk residents with pressure ulcers 5.9%
28% worse than Massachusetts average

Massachusetts average: 4.7%

Urinary Tract Infection Info Percent of long-stay residents with a urinary tract infection 0.9%
58% better than Massachusetts average

Massachusetts average: 2.1%

Lost Too Much Weight Info Percent of long-stay residents who lose too much weight 4.1%
21% better than Massachusetts average

Massachusetts average: 5.2%

Depressive Symptoms Info Percent of long-stay residents who have depressive symptoms 27.7%
159% worse than Massachusetts average

Massachusetts average: 10.7%

Antipsychotic Use Info Percent of long-stay residents who received an antipsychotic medication 16.9%
16% better than Massachusetts average

Massachusetts average: 20.3%

Pneumococcal Vaccine Info Percent of long-stay residents assessed and appropriately given the pneumococcal vaccine 99.4%
8% better than Massachusetts average

Massachusetts average: 91.9%

Influenza Vaccine Info Percent of long-stay residents assessed and appropriately given the seasonal influenza vaccine 99.3%
5% better than Massachusetts average

Massachusetts average: 94.8%

Hospitalizations per 1,000 days Info Number of hospitalizations per 1,000 long-stay resident days. 2.03
9% worse than Massachusetts average

Massachusetts average: 1.86

ED visits per 1,000 days Info Number of outpatient emergency department visits per 1,000 long-stay resident days. 1.00
35% better than Massachusetts average

Massachusetts average: 1.54

Short-stay resident measures
Above average Massachusetts avg: 3.4 Info CMS star rating based on short-stay quality measure performance. 5 stars = much above average, 1 star = much below average.
Pneumococcal Vaccine Info Percent of short-stay residents assessed and appropriately given the pneumococcal vaccine 92.0%
20% better than Massachusetts average

Massachusetts average: 76.7%

Antipsychotic medication increase Info Percent of short-stay residents who newly received an antipsychotic medication 1.8%
34% worse than Massachusetts average

Massachusetts average: 1.3%

Influenza Vaccine Info Percent of short-stay residents assessed and appropriately given the seasonal influenza vaccine 92.1%
18% better than Massachusetts average

Massachusetts average: 77.7%

Re-hospitalized after SNF stay Info Percentage of short-stay residents who were re-hospitalized after their nursing home admission. 29.8%
16% worse than Massachusetts average

Massachusetts average: 25.8%

Emergency department visits Info Percentage of short-stay residents who had an outpatient emergency department visit. 6.9%
42% better than Massachusetts average

Massachusetts average: 11.8%

Falls with major injury Info Percentage of SNF residents who experience falls with major injury during their stay. 0.0%
100% better than Massachusetts average

Massachusetts average: 0.8%

Ability to care for self at discharge Info Percentage of residents at or above expected ability to care for themselves at discharge. 68.7%
28% better than Massachusetts average

Massachusetts average: 53.7%

Successful return to home or community Info Rate of successful return to home or community from a skilled nursing facility. 57.9%
14% better than Massachusetts average

Massachusetts average: 50.6%

Penalties and fines

Federal penalties imposed by CMS for regulatory violations, including civil money penalties (fines) and denials of payment for new Medicare/Medicaid admissions.

Source: CMS Penalties Database (Data as of Jan 2026)

Total fines amount $16K
78% lower than Massachusetts average

Massachusetts average: $72K

Number of fines 1
42% fewer fines than Massachusetts average

Massachusetts average: 1.7

Payment Denials Info Serious action where Medicare and/or Medicaid temporarily stops payments for new residents until issues are fixed. 0
100% fewer payment denials than Massachusetts average

Massachusetts average: 0.1

Fines amount comparison
This facility $16K
Massachusetts average $72K
Penalty History

Penalties are imposed by CMS for violations of federal nursing home regulations.

Civil Money Penalty Info Fines imposed for noncompliance, which can be assessed per day or per instance of violation. Dec 14, 2023
$16K

Last updated: Jan 2026

Guides for Better Senior Living

Care Cost Calculator: See Prices in Your Area

Nursing Home Data Explorer

Don’t Wait Too Long: 7 Red Flag Signs Your Parent Needs Assisted Living Now

The True Cost of Assisted Living in 2025 – And How Families Are Paying For It

Understanding Senior Living Costs: Pricing Models, Discounts & Financial Assistance

Financial Aid for Massachusetts Seniors

Get financial aid guidance

Home Care Program

MassHealth Home Care

Age 60+, Massachusetts resident, at risk of nursing home placement.

~$1,500/month (individual, varies by region).

$2,000 (individual, excludes home, car).

Coordinated through Aging Services Access Points (ASAPs); high demand in urban areas.

Frail Elder Waiver

Massachusetts Medicaid FE Waiver

Age 65+, Massachusetts resident, Medicaid-eligible, nursing home-level care need.

~$2,829/month (300% FBR, individual).

$2,000 (individual), $3,000 (couple).

Requires clinical eligibility determination.

Senior Care Options (SCO)

Massachusetts Senior Care Options

Age 65+, Massachusetts resident, eligible for MassHealth (Medicare optional), nursing home-level care need.

~$2,829/month (300% FBR, individual); QIT allowed.

$2,000 (individual), $3,000 (couple) (excludes home up to $713,000, car).

Not available in Dukes/Nantucket Counties; multiple SCO providers (e.g., CCA, Tufts).

Medicare Savings Program (MSP)

Massachusetts Medicare Savings Program (MassHealth Buy-In)

Age 65+ or disabled, Massachusetts resident, Medicare Part A/B.

~$2,510/month (QMB), ~$3,380/month (SLMB), ~$3,598/month (QI)—individual.

$9,430 (individual), $14,130 (couple).

Three tiers; no waitlist; includes Extra Help for Part D.

National Family Caregiver Support Program (NFCSP) Respite

Massachusetts NFCSP Respite Care

Caregivers of 60+ needing care or 55+ caregivers of others; Massachusetts resident; functional needs (2+ ADLs).

Prioritizes ~$24,980/year (individual); no strict cap.

Not assessed; need-based.

27 ASAPs; prioritizes low-income, rural caregivers.

Prescription Advantage

Massachusetts Prescription Advantage

Age 65+ or disabled, Massachusetts resident, enrolled in Medicare Part D (or ineligible for Medicare).

No strict limit; copays vary by income (~$24,980-$75,000/year individual).

Not assessed.

Supplements Medicare Part D; no enrollment fee for low-income.

Senior Community Service Employment Program (SCSEP)

Massachusetts SCSEP

Age 55+, unemployed, low-income, Massachusetts resident.

~$1,983/month (125% FPL).

Not specified; income-focused.

Priority for veterans, rural residents; AARP partnership.

VA Aid and Attendance (A&A) and Housebound Benefits

Massachusetts VA Aid and Attendance/Housebound

Age 65+ or disabled veteran/spouse, Massachusetts resident, wartime service, need for ADL help (A&A) or homebound.

Net income < ~$1,984/month (veteran with dependent, A&A); pension offsets income.

~$155,356 (net worth limit).

High veteran demand statewide.