Renton Health and Rehabilitation
Nursing Home, Assisted Living, Independent Living, Memory Care & Hospice Care · King County, WA
CMS overall rating Info The Overall CMS Rating is scored from 1 to 5 stars and combines results from health inspections, staffing levels, and quality measures. Health inspections carry the most weight. Staffing and quality scores can increase or decrease the final rating based on performance compared to state and national standards.

Renton Health and Rehabilitation

Nursing Home, Assisted Living, Independent Living, Memory Care & Hospice Care · King County, WA
CMS overall rating Info The Overall CMS Rating is scored from 1 to 5 stars and combines results from health inspections, staffing levels, and quality measures. Health inspections carry the most weight. Staffing and quality scores can increase or decrease the final rating based on performance compared to state and national standards.
Calculator: See prices in your area
Renton Health and Rehabilitation accepts Medicare, Medicaid, and private pay.

Overview of Renton Health and Rehabilitation

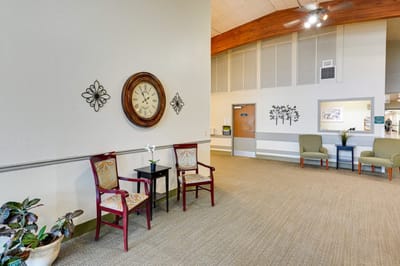
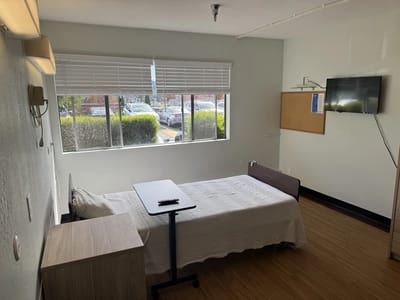
Based in a peaceful area in Renton, WA, Renton Health and Rehabilitation is a dependable community built for those needing rehabilitation and long-term care services. Residents here maintain a high quality of life with the support of an excellent care team trained to provide an array of healthcare services. With access to physical and occupational therapy, the community ensures its residents maintain their highest level of function.

Through personalized care plans, everyone here is guaranteed to receive proper care and support. Their team of physicians is available 24/7 to offer care whenever needed, providing residents with comfort and peace of mind. Here, everyone is empowered to maximize their potential and continue living the lifestyle they deserve.

Quality ratings

Measured by Centers for Medicare & Medicaid Services (CMS)

Overall rating Info The Overall CMS Rating combines results from health inspections, staffing levels and quality measures. Health inspections carry the most weight. Staffing and quality scores can increase or decrease the final rating based on performance compared to state and national standards.
▼ 42.2% Below WA avg. ▼ 42.2% Below WA avg.Click the badge to see the full State ranking.Click here to see the full State ranking.
Health Inspection Info Based on the results of the facility's three most recent standard inspections and any complaint investigations. CMS reviews the number, scope, and severity of deficiencies, with more recent findings weighted more heavily.
▼ 30.6% Below WA avg. ▼ 30.6% Below WA avg.Click the badge to see the full State ranking.Click here to see the full State ranking.
Staffing Info Measures average nursing staff hours per resident per day, including Registered Nurses (RNs) and total nursing staff. Ratings are adjusted based on the level of care residents require and are compared to state and national benchmarks.
▲ 3.9% Above WA avg. ▲ 3.9% Above WA avg.Click the badge to see the full State ranking.Click here to see the full State ranking.
Quality Measures Info Based on clinical and physical health indicators reported to CMS, such as hospital readmissions, falls, pressure ulcers, and improvements in mobility. These measures reflect how well residents' health needs are being managed.
▼ 51.0% Below WA avg. ▼ 51.0% Below WA avg.Click the badge to see the full State ranking.Click here to see the full State ranking.

Staffing hours breakdown

Info Daily nursing hours per resident by staff type, reported to CMS. Higher is generally better — compare this facility to state and national averages to see where staffing stands.

Hours per resident per day — compared to Washington state averages

Total nursing care / resident Info This home is ranked 32nd out of 61 homes in Washington.

Total adjusted nursing hours per resident per day, combining RN, LPN, and aide time. CMS adjusts this for case-mix so facilities can be fairly compared.
4h 14m per day
Rank #32 / 61Nurse hours — State benchmarkedThis home is ranked 32nd out of 61 homes in Washington.Shows adjusted nurse hours per resident per day benchmarked to the Washington average, with a ranking across 61 Washington SNFs. More hours mean more direct care. The national average is about 3.5 hrs; below 3.0 is a red flag.Click the rank badge to see the full State ranking.Click here to see the full State ranking.
This facility Washington avg (4h 22m per day)
vs Washington avg
-3%

3 of 6 metrics below state avg

Standout metric Registered Nurse (RN) is +19% above state avg
Staff typeHours / Day / Residentvs state avg
Registered Nurse (RN) Info RNs hold the highest nursing license and can assess residents, interpret test results, and direct care plans. More RN hours per day often signals stronger clinical oversight and faster response to health changes. 1h 3m per day ▲ 19% State avg: 53m per day · National avg: 41m per day
LPN / LVN Info Licensed Practical Nurses (LPNs) or Licensed Vocational Nurses (LVNs) deliver routine hands-on care — medication administration, wound dressing, and monitoring vital signs. They work under RN supervision and make up a large share of daily bedside care. 43m per day ▼ 12% State avg: 49m per day · National avg: 52m per day
Nurse Aide Info Certified Nurse Aides (CNAs) provide the most direct day-to-day assistance: bathing, dressing, feeding, and mobility. Nurse aide hours are typically the largest staffing category and directly affect residents' quality of life. 2h 43m per day ■ Avg State avg: 2h 41m per day · National avg: 2h 21m per day
Total Nursing (Weekend) Info Combined nursing hours (RN + LPN + Nurse Aide) per resident per day on weekends. Staffing often drops on weekends — this figure reveals whether the facility maintains adequate coverage outside of weekday hours. 3h 35m per day ▼ 5% State avg: 3h 47m per day · National avg: 3h 26m per day
Physical Therapist Info Hours per resident per day provided by licensed Physical Therapists (PTs) or PT Assistants. PT services help residents recover mobility after injury or illness and are especially important for post-acute (short-stay) rehabilitation. 4m per day ▼ 20% State avg: 5m per day · National avg: 4m per day
RN (Weekend) Info Registered nurse hours specifically on weekends. Facilities sometimes reduce RN presence on Saturdays and Sundays — a low weekend RN figure compared to weekday hours can indicate reduced clinical oversight when most administrative staff are absent. 39m per day ▲ 3% State avg: 38m per day · National avg: 29m per day

Capacity and availability

This home usually has availability

Occupancy lower than 85% suggests more openings may be available.

Higher occupancy than the Washington average: 72.5%
Occupancy rate 81.2% Rank #15 / 64Occupancy rate — State benchmarkedThis home is ranked 15th out of 64 homes in Washington.Shows this facility's occupancy rate versus the Washington average, with its Statewide rank out of 64. Higher occupancy signals strong local demand and financial stability.Click the rank badge to see the full State ranking.Click here to see the full State ranking.
Avg. Length of Stay 121 days
Occupancy rate
81.2% Rank #15 / 64Occupancy rate — State benchmarkedThis home is ranked 15th out of 64 homes in Washington.Shows this facility's occupancy rate versus the Washington average, with its Statewide rank out of 64. Higher occupancy signals strong local demand and financial stability.Click the rank badge to see the full State ranking.Click here to see the full State ranking.
Avg. Length of Stay
121 days

Who this home usually serves

TYPE OF STAY

Mostly short-term rehab stays

Most residents typically stay for a few weeks or months before returning home or moving on.

Breakdown by payment type

Medicare

37% of new residents, usually for short-term rehab.

Typical stay 1 - 2 months

Private pay

36% of new residents, often for short stays.

Typical stay 1 - 2 months

Medicaid

27% of new residents, often for long-term daily care.

Typical stay 11 - 12 months

Finances and operations

Privately-owned community
Home revenue
$4.5M
Profit
$89.1K
Privately-owned community
Home revenue
$4.5M Rank #61 / 64Revenue — State benchmarkedThis home is ranked 61st out of 64 homes in Washington.Shows this facility's annual revenue compared to the Washington SNF average. Higher revenue generally means more resources for staffing and capital — read alongside Payroll %.Click the rank badge to see the full State ranking.Click here to see the full State ranking.
Profit
$89.1K
Payroll costs Info The portion of the home's budget spent on staff, including nurses, caregivers, and other employees who support care and operations. Rank #61 / 64Payroll — State benchmarkedThis home is ranked 61st out of 64 homes in Washington.Shows total annual staff payroll benchmarked to the Washington average. Higher payroll investment relative to peers often signals better staffing and less reliance on cheaper contract labor.Click the rank badge to see the full State ranking.Click here to see the full State ranking.
$2.6M
57.7% of revenue Rank #14 / 64Payroll % — State benchmarkedThis home is ranked 14th out of 64 homes in Washington.Shows payroll as a percentage of revenue versus the Washington average. Well-run Washington SNFs typically land around 52–60% — the top third Statewide. Below 25% may signal understaffing or heavy agency use — read with Staffing ratings.Click the rank badge to see the full State ranking.Click here to see the full State ranking.
Other operating costs Info All remaining costs needed to run the home, such as food, utilities, building maintenance, supplies and administrative expenses.
$1.8M
Total costs $4.4M
Years in operation
22 years in operation Rank #11 / 16Years in operation — State benchmarkedThis home is ranked 11th out of 16 homes in Washington.Shows how long this facility has been in operation compared to other Washington SNFs. Longer operating histories may benefit residents, families, and staff.Click the rank badge to see the full State ranking.Click here to see the full State ranking.
A longer operating history, which may indicate experience navigating regulations and delivering ongoing care.
Walk Score
Walk Score: 83 / 100 Rank #7 / 64Walk Score — State benchmarkedThis home is ranked 7th out of 64 homes in Washington.Shows how walkable this facility's neighborhood is compared to the average Walk Score across Washington SNFs. Higher scores benefit residents, families, and staff.Click the rank badge to see the full State ranking.Click here to see the full State ranking.
Very walkable. Most errands can be accomplished on foot, and many essentials are within a short walk.

About this community

Staffing

Key information about the people who lead and staff this community.

Leadership

ContactMr. Jamison Bird, Administrator

Therapy & Rehabilitation

1 service
Rehabilitation Services

Staffing & Medical

1 service
24-Hour Staffing

Amenities & Lifestyle

Specific ProgramsClinical Capabilities, Therapy Services, Community Partnerships
Operating HoursOpen 24 Hours/7 Days A Week

What does this home offer?

Building type icon
Building type icon

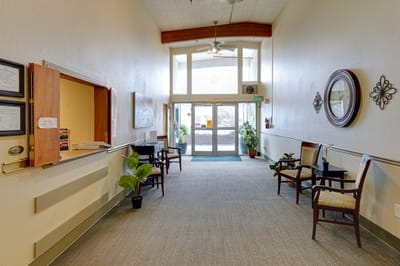
Building Type: Single-story
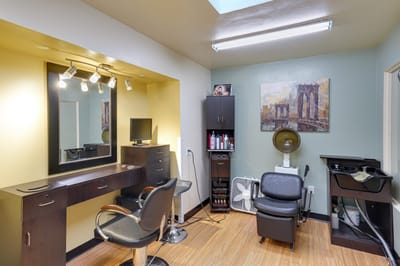
Dining services icon

Dining Services

Beauty services icon

Beauty Services

Recreational activities icon

Recreational Activities
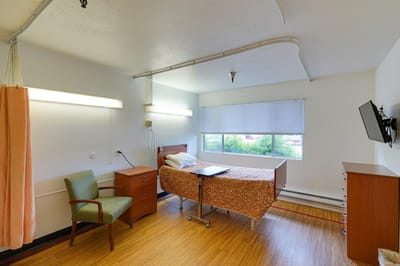
Types of Care at Renton Health and Rehabilitation

Nursing Home Assisted Living Independent Living Memory Care Hospice Care

Contact Renton Health and Rehabilitation

Inspection History

In Washington, the Department of Social and Health Services, Residential Care Services conducts unannounced inspections and issues reports on the quality of care in all licensed settings.

Read the full inspection reports for this facility, including detailed findings and corrective actions.

Show Inspection Reports

Health Inspection History

Inspections Since 2023
Total health inspections 6

Washington average 7.8


Last Health inspection on Sep 2024

Total health citations
90 Rank #52 / 61Health citations — State benchmarkedThis home is ranked 52nd out of 61 homes in Washington.Shows this facility's total health deficiency citations benchmarked to the Washington State average, with a ranking across all 61 WA SNFs. Lower citation counts earn a better rank.Click the rank badge to see the full State ranking.Click here to see the full State ranking.

Washington average 48.9

Citations per inspection
15 Rank #58 / 61Citations per inspection — State benchmarkedThis home is ranked 58th out of 61 homes in Washington.Shows average deficiency citations per CMS inspection for this facility versus the Washington mean across 61 SNFs with citation data. Lower is better.Click the rank badge to see the full State ranking.Click here to see the full State ranking.

Washington average 6.92


Health citations are formal notices following inspections when they fail to comply with safety and care standards.

80 of 90 citations resulted from standard inspections; 8 of 90 resulted from complaint investigations; and 2 of 90 came from combined inspections (standard and complaint).

Breakdown of citation severity (last 3 years)
Critical Health citations
1
233% worse than Washington average

Washington average: 0.3


Serious Health citations
0
100% better than Washington average

Washington average: 1.7

1 critical citation Washington average: 0.3

0 serious citations Washington average: 1.7

89 moderate citations Washington average: 46.3

0 minor citations Washington average: 0.5
Citations history (last 3 years)
Infection Control moderate citation Sep 16, 2024
Corrected

Infection Control moderate citation Sep 16, 2024
Corrected

Nutrition moderate citation Sep 16, 2024
Corrected

Pharmacy moderate citation Sep 16, 2024
Corrected

Financial Assistance for
Nursing Home in Washington

Renton Health and Rehabilitation is located in Renton, Washington.
Here are the financial assistance programs available to residents in Washington.

Get Financial aid guidance

Community Options Program Entry System (COPES)

WA Medicaid COPES

Age 65+ or disabled
General Washington resident, Medicaid-eligible, nursing home-level care need.
Income Limits (2025) ~$2,829/month 300% FBR, individual
Asset Limits $2,000 (individual), $3,000 (couple).
WA

High demand in urban areas (e.g., Seattle).

Benefits
Personal care (5-7 hours/day) Respite (240 hours/year) Adult day care ($70/day) Home modifications ($1,500 avg.)

Washington Family Caregiver Support Program

WA NFCSP

Age Caregiver of someone 60+ (or with dementia)
General Washington resident.
Income Limits No strict limit; prioritizes low-income.
Asset Limits Not applicable.
WA

High urban demand; rural outreach.

Benefits
In-home respite (4-6 hours/day) Adult day care (~$70/day) Short-term facility care (up to 5 days)

Community First Choice (CFC)

Washington Community First Choice

Age 65+ (or disabled 18+)
General WA resident, Medicaid-eligible, need help with 2+ ADLs/IADLs.
Income Limits (2025) ~$2,829/month; QIT optional.
Asset Limits $2,000 (individual), $3,000 (couple).
WA

Broader than COPES; serves ~20,000; self-directed option.

Benefits
Personal care (4-6 hours/day) Respite (~240 hours/year) Assistive devices Training Transportation

Older Americans Act (OAA) Services

Washington OAA Services

Age 60+
General WA resident; no income/asset limits.
Income Limits (2025) None; donations encouraged.
Asset Limits Not assessed.
WA

13 AAAs; includes Meals on Wheels; rural focus.

Benefits
Meals (~$5-$7/meal) Transportation Homemaker services (~4 hours/week) Respite (~5 days/year) Legal aid

Medicare Savings Program (MSP)

Washington Medicare Savings Program

Age 65+ or disabled
General WA resident, Medicare Part A/B.
Income Limits (2025) ~$2,510/month (QMB), ~$3,380/month (SLMB), ~$3,598/month (QI)—individual.
Asset Limits $9,430 (individual), $14,130 (couple).
WA

Includes Extra Help for Part D; no waitlist.

Benefits
Covers Part B premiums ($174.70/month) Deductibles ($240/year) Copays (~20%)

VA Aid and Attendance (A&A) and Housebound Benefits

Washington VA Aid and Attendance/Housebound

Age 65+ or disabled veteran/spouse
General WA resident, wartime service, ADL help (A&A) or homebound.
Income Limits (2025) Net income < ~$1,984/month (veteran with dependent, A&A); pension offsets income.
Asset Limits ~$155,356 net worth
WA

High veteran use; supports rural/urban needs.

Benefits
Cash (~$1,433-$2,642/month veteran, ~$951-$1,318 spouse) for care costs

Senior Citizens Property Tax Exemption

Washington Senior Property Tax Exemption

Age 61+ or disabled retiree
General WA resident, homeowner, income-based.
Income Limits (2025) ~$45,000-$70,000/year varies by county, e.g., King: $70,000
Asset Limits Not assessed; home value cap varies ~$250,000-$400,000
WA

Saves ~$500-$1,500/year; offered statewide.

Benefits
Tax exemption (~$500-$1,500/year depending on county)

Senior Farmers’ Market Nutrition Program (SFMNP)

Washington SFMNP

Age 60+
General WA resident, low-income.
Income Limits (2025) ~$2,322/month 185% FPL
Asset Limits Not assessed.
WA

Vouchers (~$80/season); serves ~20,000 via AAAs.

Benefits
Vouchers (~$80/season) for produce at farmers’ markets

Places of interest near Renton Health and Rehabilitation

Address 0.8 miles from city center Info Estimated distance in miles from Renton's city center to Renton Health and Rehabilitation's address, calculated via Google Maps.

Calculate Travel Distance to Renton Health and Rehabilitation

Add your location

Address

Staffing Data

Reporting period: April 1 – June 30, 2025 (Q2 2025). Source: CMS Payroll-Based Journal report.

Total staff 114
Employees 104
Contractors 10
Staff to resident ratio 1.70:1
8% worse than Washington average
Washington average ratio: 1.85:1 Washington average ratio: 1.85:1See full Washington ranking
Avg staff/day 53
Average shift 7.7 hours
5% worse than Washington average
Washington average: 8.1 hours Washington average shift: 8.1 hoursSee full Washington ranking
Total staff hours (quarter) 37,180

Nursing staff breakdown

Q2 2025 · Apr 1 – Jun 30 More info This data comes from the CMS Payroll-Based Journal report covering April 1 – June 30, 2025.
Registered Nurse

Manages medical care and health needs.

Total count 14
Average shift length Info Average shift length. Calculated as total hours divided by days worked and average staff per day. 9.2 hours

No contractors work on this role.

Licensed Practical Nurse

Assists with medical care and medications.

Total count 13
Average shift length Info Average shift length. Calculated as total hours divided by days worked and average staff per day. 7.9 hours

No contractors work on this role.

Certified Nursing Assistant

Helps with daily care and mobility.

Total count 47
Average shift length Info Average shift length. Calculated as total hours divided by days worked and average staff per day. 7.7 hours

No contractors work on this role.

Contractor staffing

Q2 2025 · Apr 1 – Jun 30 More info This data comes from the CMS Payroll-Based Journal report covering April 1 – June 30, 2025.

Total hours from contractors

2.9%

1,065 contractor hours this quarter

Feeding Assistant: 3 Other Physician: 2 Medical Director: 2 Therapeutic Recreation Specialist: 1 Qualified Social Worker: 1 Occupational Therapy Assistant: 1

Staff by category

Q2 2025 · Apr 1 – Jun 30 More info This data comes from the CMS Payroll-Based Journal report covering April 1 – June 30, 2025.
Certified Nursing Assistant4704716,52991100%7.7
Registered Nurse140145,89191100%9.2
Licensed Practical Nurse130134,52591100%7.9
Nurse Aide in Training5052,1769099%8.1
Physical Therapy Aide3038676369%7.6
Clinical Nurse Specialist2028428088%6.5
Physical Therapy Assistant3037106673%6
Feeding Assistant0335784954%7.4
Respiratory Therapy Technician3035447785%5.7
Administrator1015206571%8
Nurse Practitioner1015206571%8
RN Director of Nursing1015206571%8
Mental Health Service Worker1015206571%8
Other Dietary Services Staff1014436268%7.1
Dietitian1014305864%7.4
Dental Services Staff1014235763%7.4
Therapeutic Recreation Specialist3142733134%8.8
Occupational Therapy Aide1012684044%6.7
Medical Director0222071415%7.6
Qualified Social Worker2131542325%5.9
Other Physician0221251921%4.5
Qualified Activities Professional101591415%4.2
Occupational Therapy Assistant01158910%6.4
47 Certified Nursing Assistant
% of Days 100%
14 Registered Nurse
% of Days 100%
13 Licensed Practical Nurse
% of Days 100%
5 Nurse Aide in Training
% of Days 99%
3 Physical Therapy Aide
% of Days 69%
2 Clinical Nurse Specialist
% of Days 88%
3 Physical Therapy Assistant
% of Days 73%
3 Feeding Assistant
% of Days 54%
3 Respiratory Therapy Technician
% of Days 85%
1 Administrator
% of Days 71%
1 Nurse Practitioner
% of Days 71%
1 RN Director of Nursing
% of Days 71%
1 Mental Health Service Worker
% of Days 71%
1 Other Dietary Services Staff
% of Days 68%
1 Dietitian
% of Days 64%
1 Dental Services Staff
% of Days 63%
4 Therapeutic Recreation Specialist
% of Days 34%
1 Occupational Therapy Aide
% of Days 44%
2 Medical Director
% of Days 15%
3 Qualified Social Worker
% of Days 25%
2 Other Physician
% of Days 21%
1 Qualified Activities Professional
% of Days 15%
1 Occupational Therapy Assistant
% of Days 10%

Facility Characteristics

Source: CMS Long-Term Care Facility Characteristics (Data as of Jan 2026)

Total residents 67
Medicare
2
3% of residents
Medicaid
50
74.6% of residents
Private pay or other
15
22.4% of residents
Programs & Services
Residents Group

Residents meet regularly to discuss policies, care quality, and activities

Active Resident Council

Organized group of residents that meets regularly to discuss facility policies, quality of life, and activities.

Quality of care over time

These measures show how residents usually do over time at this home, based on health outcomes and preventive care.

High-risk clinical events score Info A composite score based on pressure ulcers, falls with injury, weight loss, walking ability decline, and activities of daily living decline. 14.8
47% worse than Washington average

Washington average: 10.0

Functional decline score Info A composite score based on activities of daily living decline, walking ability decline, and incontinence. 26.1
25% worse than Washington average

Washington average: 20.9

Long-stay resident measures
Above average Info CMS star rating based on long-stay quality measure performance. 5 stars = significantly above average, 1 star = significantly below average.
Need for Help with Daily Activities Increased Info Percent of long-stay residents whose need for help with daily activities has increased 17.1%
In line with Washington average

Washington average: 16.4%

Walking Ability Worsened Info Percent of long-stay residents whose ability to move independently worsened 38.6%
77% worse than Washington average

Washington average: 21.8%

Low Risk Residents with Bowel/Bladder Incontinence Info Percent of low risk long-stay residents who lose control of their bowels or bladder 22.5%
8% better than Washington average

Washington average: 24.3%

Falls with Major Injury Info Percent of long-stay residents experiencing one or more falls with major injury 3.5%
34% worse than Washington average

Washington average: 2.6%

High Risk Residents with Pressure Ulcers Info Percent of long-stay high risk residents with pressure ulcers 6.1%
25% worse than Washington average

Washington average: 4.9%

Urinary Tract Infection Info Percent of long-stay residents with a urinary tract infection 2.7%
53% worse than Washington average

Washington average: 1.7%

Lost Too Much Weight Info Percent of long-stay residents who lose too much weight 8.5%
46% worse than Washington average

Washington average: 5.8%

Depressive Symptoms Info Percent of long-stay residents who have depressive symptoms 0.5%
97% better than Washington average

Washington average: 16.2%

Antipsychotic Use Info Percent of long-stay residents who received an antipsychotic medication 13.3%
8% better than Washington average

Washington average: 14.5%

Pneumococcal Vaccine Info Percent of long-stay residents assessed and appropriately given the pneumococcal vaccine 99.6%
In line with Washington average

Washington average: 96.2%

Influenza Vaccine Info Percent of long-stay residents assessed and appropriately given the seasonal influenza vaccine 100.0%
7% better than Washington average

Washington average: 93.8%

Hospitalizations per 1,000 days Info Number of hospitalizations per 1,000 long-stay resident days. 1.25
9% better than Washington average

Washington average: 1.38

ED visits per 1,000 days Info Number of outpatient emergency department visits per 1,000 long-stay resident days. 0.46
70% better than Washington average

Washington average: 1.51

Short-stay resident measures
Below average Info CMS star rating based on short-stay quality measure performance. 5 stars = much above average, 1 star = much below average.
Pneumococcal Vaccine Info Percent of short-stay residents assessed and appropriately given the pneumococcal vaccine 86.7%
In line with Washington average

Washington average: 88.1%

Antipsychotic medication increase Info Percent of short-stay residents who newly received an antipsychotic medication 0.0%
100% better than Washington average

Washington average: 1.4%

Influenza Vaccine Info Percent of short-stay residents assessed and appropriately given the seasonal influenza vaccine 88.7%
8% better than Washington average

Washington average: 82.0%

Re-hospitalized after SNF stay Info Percentage of short-stay residents who were re-hospitalized after their nursing home admission. 17.5%
12% better than Washington average

Washington average: 19.9%

Emergency department visits Info Percentage of short-stay residents who had an outpatient emergency department visit. 18.7%
42% worse than Washington average

Washington average: 13.2%

Falls with major injury Info Percentage of SNF residents who experience falls with major injury during their stay. 0.0%
100% better than Washington average

Washington average: 0.8%

Ability to care for self at discharge Info Percentage of residents at or above expected ability to care for themselves at discharge. 40.6%
24% worse than Washington average

Washington average: 53.7%

Successful return to home or community Info Rate of successful return to home or community from a skilled nursing facility. 46.6%
8% worse than Washington average

Washington average: 50.6%

Penalties and fines

Federal penalties imposed by CMS for regulatory violations, including civil money penalties (fines) and denials of payment for new Medicare/Medicaid admissions.

Source: CMS Penalties Database (Data as of Jan 2026)

Total fines amount $270K Rank #60 / 61Federal fines — State benchmarkedThis home is ranked 60th out of 61 homes in Washington.Shows this facility's cumulative CMS federal fine dollars versus the Washington average among facilities with fines, and where it ranks among 61 skilled nursing facilities in the pool. Lower total dollars mean a better rank.Click the rank badge to see the full State ranking.Click here to see the full State ranking.
231% higher than Washington average

Washington average: $82K

Number of fines 3
62% more fines than Washington average

Washington average: 1.8

Payment Denials Info Serious action where Medicare and/or Medicaid temporarily stops payments for new residents until issues are fixed. 0
100% fewer payment denials than Washington average

Washington average: 0.3

Fines amount comparison
This facility $270K
Washington average $82K
Penalty History

Penalties are imposed by CMS for violations of federal nursing home regulations.

2 penalties in the past 3 years

Multiple penalties were reported in the last 3 years.

Civil Money Penalty Info Fines imposed for noncompliance, which can be assessed per day or per instance of violation. Jun 25, 2024
$77K
Civil Money Penalty Info Fines imposed for noncompliance, which can be assessed per day or per instance of violation. Sep 6, 2023
$180K

Last updated: Jan 2026

Compare Nursing Home around King County

The information below is reported by the Washington Department of Social and Health Services, Residential Care Services.

3 facilities compared · CMS & WA Dept. of Health data

Filter by care type
Kline Galland Home
NH

Nursing Home Licensed facility providing 24/7 skilled nursing care for residents with complex, ongoing medical needs. Staffed by RNs, LPNs, and CNAs. Inspected and star-rated annually by CMS. Accepts Medicare (short-term rehab) and Medicaid (long-term care).

AL

Assisted Living A licensed, long-term care setting for seniors or individuals with disabilities who need help with daily activities — like bathing, dressing, and medication management — but not 24-hour skilled nursing. Offers housing, meals, and around-the-clock support while aiming to maximize resident independence.

IL

Independent Living Lifestyle-focused communities for older adults offering dining, activities, and transportation with minimal personal care. Best for active, independent seniors who want community without medical support.

MC

Memory Care Secured, specialized care for people living with Alzheimer's or dementia. Staff trained in cognitive impairment, with higher staff-to-resident ratios and an environment designed to reduce confusion and wandering risk.

Seattle (Seward Park)205 93.5% +29%4.63 +8%+10%$0227.3-197- 44 Jeanie Alhadeff$57.8M$36.6M63.4%505442
Washington Care Center
NH

Nursing Home Licensed facility providing 24/7 skilled nursing care for residents with complex, ongoing medical needs. Staffed by RNs, LPNs, and CNAs. Inspected and star-rated annually by CMS. Accepts Medicare (short-term rehab) and Medicaid (long-term care).

HC

Home Care Professional care delivered in the person's own home — from companionship and errands to skilled nursing and therapy. Allows seniors to age in place. Medicare covers skilled home health when medically necessary.

MC

Memory Care Secured, specialized care for people living with Alzheimer's or dementia. Staff trained in cognitive impairment, with higher staff-to-resident ratios and an environment designed to reduce confusion and wandering risk.

RC

Respite Care Short-term temporary care — days to weeks — to give family caregivers a break. Full care provided during the stay. Often used after hospitalization or to trial a facility before a permanent placement decision.

Seattle (Rainier Valley)165 90.9% +25%4.21 +30%0%$105.1k687.65129A+ 77 Rayona Deanes$21.2M$14.7M69.3%505017
Renton Health and Rehabilitation
NH

Nursing Home Licensed facility providing 24/7 skilled nursing care for residents with complex, ongoing medical needs. Staffed by RNs, LPNs, and CNAs. Inspected and star-rated annually by CMS. Accepts Medicare (short-term rehab) and Medicaid (long-term care).

AL

Assisted Living A licensed, long-term care setting for seniors or individuals with disabilities who need help with daily activities — like bathing, dressing, and medication management — but not 24-hour skilled nursing. Offers housing, meals, and around-the-clock support while aiming to maximize resident independence.

IL

Independent Living Lifestyle-focused communities for older adults offering dining, activities, and transportation with minimal personal care. Best for active, independent seniors who want community without medical support.

MC

Memory Care Secured, specialized care for people living with Alzheimer's or dementia. Staff trained in cognitive impairment, with higher staff-to-resident ratios and an environment designed to reduce confusion and wandering risk.

Renton99 81.2% +12%4.23 -10%0%$270.1k9015.0178- 83 -$4.5M$2.6M57.7%505280

Guides for Better Senior Living

Care Cost Calculator: See Prices in Your Area

Nursing Home Data Explorer

Don’t Wait Too Long: 7 Red Flag Signs Your Parent Needs Assisted Living Now

The True Cost of Assisted Living in 2025 – And How Families Are Paying For It

Understanding Senior Living Costs: Pricing Models, Discounts & Financial Assistance

Frequently Asked Questions about Renton Health and Rehabilitation

Is Renton Health and Rehabilitation in a walkable area?

Renton Health and Rehabilitation has a walk score of 83. Very walkable. Most errands can be accomplished on foot, and many essentials are within a short walk.

Are there photos of Renton Health and Rehabilitation?

Yes — there are 10 photos of Renton Health and Rehabilitation in the photo gallery on this page.

What is the address of Renton Health and Rehabilitation?

Renton Health and Rehabilitation is located at 80 SW 2nd St, Renton, WA 98057, United States.

What is the phone number of Renton Health and Rehabilitation?

(425) 226-4610 will put you in contact with the team at Renton Health and Rehabilitation.

Is Renton Health and Rehabilitation Medicare or Medicaid certified?

Yes — Renton Health and Rehabilitation is a CMS-certified provider of Medicare and Medicaid.

Explore Open Rooms
1 Contact details
2 What type of senior care service are you looking for?
3 What budget do you have in mind for senior care?
4 How soon do you need to find care?
5 Additional details

Thank you for your interest!

Our team will be in touch shortly to help with next steps.