


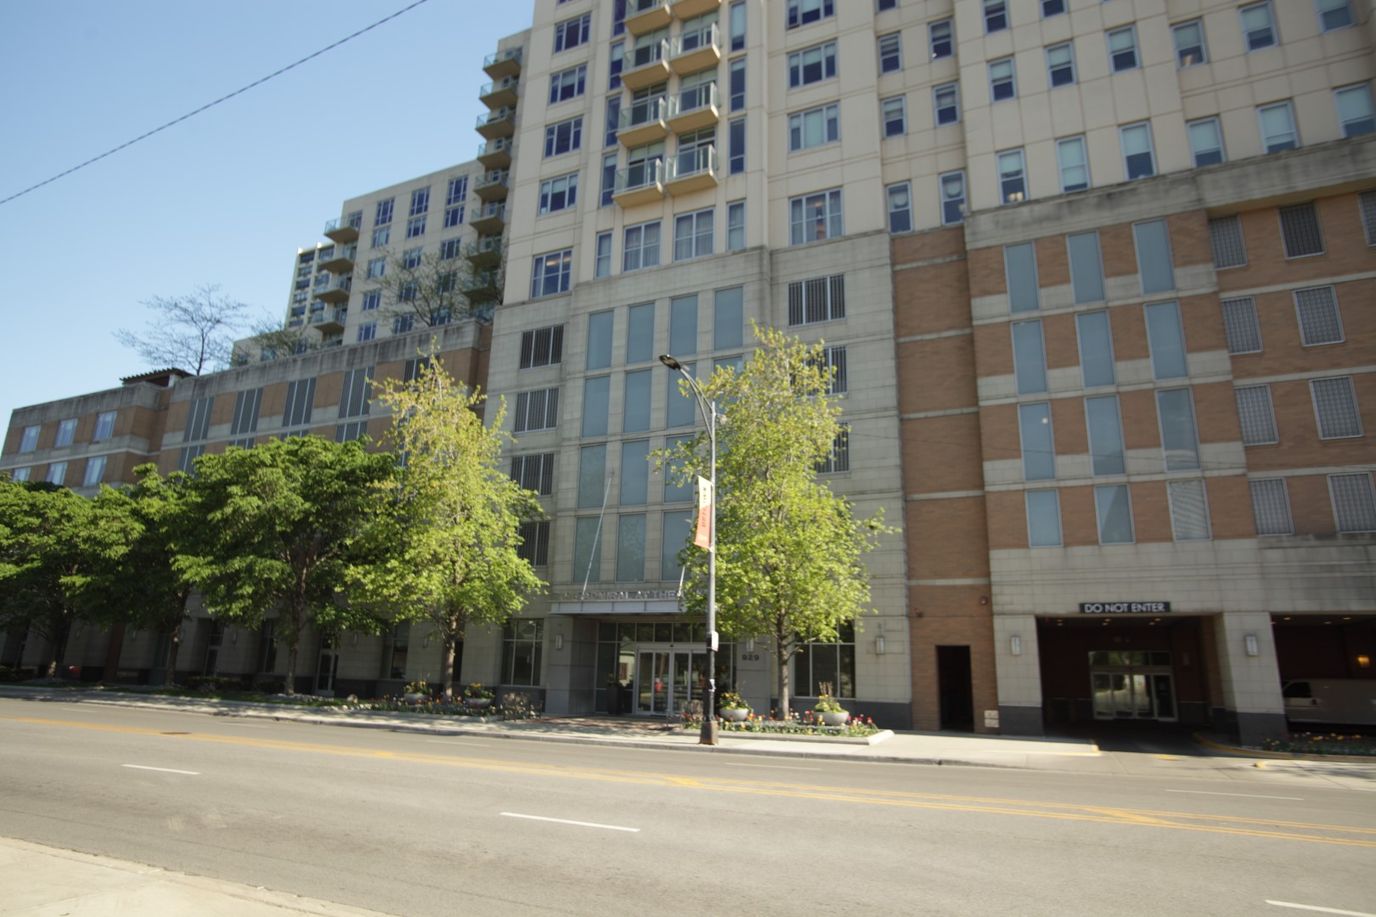
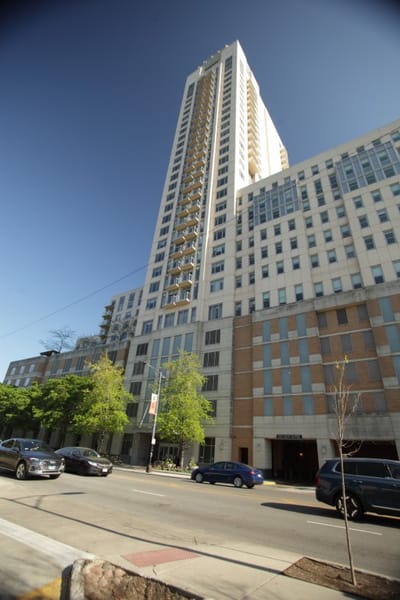

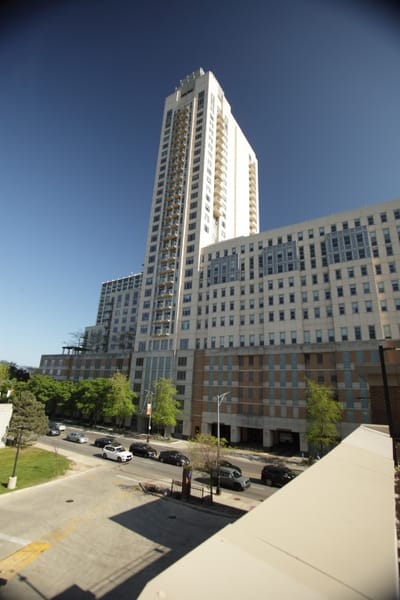
Admiral at the Lake
Nursing Home, Independent Living, Assisted Living, Memory Care & Skilled Nursing · Chicago, IL
CMS overall rating Info The Overall CMS Rating is scored from 1 to 5 stars and combines results from health inspections, staffing levels, and quality measures. Health inspections carry the most weight. Staffing and quality scores can increase or decrease the final rating based on performance compared to state and national standards.

Admiral at the Lake

Nursing Home, Independent Living, Assisted Living, Memory Care & Skilled Nursing · Chicago, IL
CMS overall rating Info The Overall CMS Rating is scored from 1 to 5 stars and combines results from health inspections, staffing levels, and quality measures. Health inspections carry the most weight. Staffing and quality scores can increase or decrease the final rating based on performance compared to state and national standards.
Calculator: See prices in your area
Admiral at the Lake accepts Medicare and private pay.

Overview of Admiral at the Lake

Overlooking the beautiful Lake Michigan, Admiral at the Lake is a serene and inviting senior living community in the vibrant neighborhood of Chicago, IL, offering luxury independent living. Ensuring residents enjoy a comfortable and convenient lifestyle even as their needs change, the community also offers residents access to assisted living, memory care, long-term care, and skilled nursing services through its Lifecare policy. Residents are provided with spacious, maintenance-free apartments, just steps away from the city’s vibrant neighborhood, natural wonders, and cultural opportunities for a dynamic city life experience.

With its robust programming, including wellness and fitness programs, classes, arts & crafts programs, and more, the community ensures residents are provided with the opportunities they need to live a full, enriching life. Exceptional dining, featuring varied menus and an in-house dietitian that works with the Executive Chef to create healthy and delicious meals, further enhances residents’ lifestyle and health. A fitness & wellness center, swimming pool & jacuzzi, a movie theater, green spaces and other amenities are offered to further enhance residents’ living experience.

(773) 433-1800

Quality ratings

Measured by Centers for Medicare & Medicaid Services (CMS)

Overall rating Info The Overall CMS Rating combines results from health inspections, staffing levels and quality measures. Health inspections carry the most weight. Staffing and quality scores can increase or decrease the final rating based on performance compared to state and national standards.
▼ 36.5% Below IL avg. ▼ 36.5% Below IL avg.Click the badge to see the full State ranking.Click here to see the full State ranking.
Health Inspection Info Based on the results of the facility's three most recent standard inspections and any complaint investigations. CMS reviews the number, scope, and severity of deficiencies, with more recent findings weighted more heavily.
At IL avg. At IL avg.Click the badge to see the full State ranking.Click here to see the full State ranking.
Staffing Info Measures average nursing staff hours per resident per day, including Registered Nurses (RNs) and total nursing staff. Ratings are adjusted based on the level of care residents require and are compared to state and national benchmarks.
▼ 70.0% Below IL avg. ▼ 70.0% Below IL avg.Click the badge to see the full State ranking.Click here to see the full State ranking.
Quality Measures Info Based on clinical and physical health indicators reported to CMS, such as hospital readmissions, falls, pressure ulcers, and improvements in mobility. These measures reflect how well residents' health needs are being managed.
▲ 25.4% Above IL avg. ▲ 25.4% Above IL avg.Click the badge to see the full State ranking.Click here to see the full State ranking.

Staffing hours breakdown

Info Daily nursing hours per resident by staff type, reported to CMS. Higher is generally better — compare this facility to state and national averages to see where staffing stands.

Hours per resident per day — compared to Illinois state averages

Total nursing care / resident Info This home is ranked 19th out of 167 homes in Illinois. Total adjusted nursing hours per resident per day, combining RN, LPN, and aide time. CMS adjusts this for case-mix so facilities can be fairly compared.
4h 56m per day
Rank #19 / 167Nurse hours — State benchmarkedThis home is ranked 19th out of 167 homes in Illinois. Shows adjusted nurse hours per resident per day benchmarked to the Illinois average, with a ranking across 167 Illinois SNFs. More hours mean more direct care. The national average is about 3.5 hrs; below 3.0 is a red flag.Click the rank badge to see the full State ranking.Click here to see the full State ranking.
This facility Illinois avg (3h 57m per day)
vs Illinois avg
+25%

0 of 1 metrics below state avg

Standout metric Weekend Total Nursing is +37% above state avg
Staff typeHours / Day / Residentvs state avg
Weekend Total Nursing Info Combined nursing hours (RN + LPN + Nurse Aide) per resident per day on weekends. Staffing often drops on weekends — this figure reveals whether the facility maintains adequate coverage outside of weekday hours. 4h 14m per day ▲ 37% State avg: 3h 5m per day · National avg: 3h 25m per day

Types of Care at Admiral at the Lake

Independent Living Assisted Living Memory Care Skilled Nursing

Capacity and availability

Avg. Length of Stay
137 days
Bed community size
56-bed community Rank #278 / 425Bed count — State benchmarkedThis home is ranked 278th out of 425 homes in Illinois. Shows this facility's certified or reported bed count compared to other Illinois SNFs. Larger communities may offer more amenities, programs, and on-site services for residents and families.Click the rank badge to see the full State ranking.Click here to see the full State ranking.
A moderately sized community that may balance personal attention with shared amenities and social activities.
Walk Score
Walk Score: 90 / 100 Rank #40 / 648Walk Score — State benchmarkedThis home is ranked 40th out of 648 homes in Illinois. Shows how walkable this facility's neighborhood is compared to the average Walk Score across Illinois SNFs. Higher scores benefit residents, families, and staff.Click the rank badge to see the full State ranking.Click here to see the full State ranking.
Walker's paradise. Daily errands do not require a car, with many shops and services nearby.
BBB Rating
BBB Rating: A+ (Not Accredited)
An independent rating from the Better Business Bureau based on factors such as complaint history, transparency, and business practices.
How BBB ratings work

About this community

Occupancy

Occupancy rate
89%
Rank #40 / 199Occupancy rate — State benchmarkedThis home is ranked 40th out of 199 homes in Illinois. Shows this facility's occupancy rate versus the Illinois average, with its Statewide rank out of 199. Higher occupancy signals strong local demand and financial stability.Click the rank badge to see the full State ranking.Click here to see the full State ranking.
Higher than the Illinois average: 69.3%
Occupied beds
50 / 56
Average occupied beds in Illinois homes 93 beds

License Details

Facility TypeAssisted Living/shared Housing Establishment
StatusActive
IssuanceMay 5, 2025
ExpirationMay 5, 2026
CountyCook
CMS Certification Number146165

Ownership & Operating Entity

Admiral at the Lake is legally operated by The Admiral At The Lake.

Type Of Units

Permanent Units
39 units
Alzheimer's Units
17 units
Total beds
56 units

Staffing

Key information about the people who lead and staff this community.

Leadership

ContactMs. Nadia Geigler, Executive Director

Therapy & Rehabilitation

2 services
Rehabilitation Services
Short-Term Rehab

Memory & Specialized Care

1 service
Offers Alzheimer's Care

Additional Services

1 service
Memory Support

Contact Information

Contact Admiral at the Lake

Inspection History

In Illinois, the Department of Public Health, Office of Health Care Regulation conducts annual unannounced surveys to assess compliance with state and federal healthcare facility standards.

Since 2015 · 11 years of data 12 deficiencies 4 inspections

Inspection Scorecard Info This scorecard compares key inspection, citation, and complaint metrics at this facility against the Illinois state average. Metrics rated ≥15% worse than average are highlighted in red; those ≥15% better are highlighted in green.

Since 2015 vs. Illinois state average
Overall vs. IL average 3 Worse Metrics worse than Illinois average:
• Total deficiencies (71% above)
• Deficiencies per year (83% above)
• Deficiencies per inspection (233% above)
1 Better Metrics better than Illinois average:
• Total inspections (50% below)
Latest Inspection July 14, 2025

Deficiencies Info Deficiencies are formal regulatory issues recorded during state inspections.

This FacilityIL Averagevs. IL Avg
Total deficiencies Info Formal regulatory issues recorded by inspectors across all inspection types. 127 This facility has 71% more total deficiencies than a typical Illinois nursing home (12 vs. IL avg 7).↑ 71% worse
Deficiencies per year Info Average deficiencies per year since 2015. 1.10.6 This facility has 83% more deficiencies per year than a typical Illinois nursing home (1.1 vs. IL avg 0.6).↑ 83% worse
Deficiencies per inspection Info Average deficiencies per inspection. 30.9 This facility has 233% more deficiencies per inspection than a typical Illinois nursing home (3 vs. IL avg 0.9).↑ 233% worse

Inspections Info State inspections evaluate whether the facility meets health and safety standards.

This FacilityIL Averagevs. IL Avg
Total inspections Info Combined count of all routine and focused inspections. Excludes complaint investigations. 48 This facility has 50% fewer total inspections than a typical Illinois nursing home (4 vs. IL avg 8).↓ 50% better

Inspection Reports Summary Info An editor-reviewed summary of the themes and findings across this facility's recent inspection reports.

The most recent inspection on July 14, 2025, identified deficiencies related to residency requirements, disaster preparedness drills, employee record updates, tuberculosis risk assessments, and dementia-specific training. Earlier inspections showed similar issues with residency compliance, disaster preparedness, employee background checks, and training programs. Prior reports from August 23, 2024, cited deficiencies in securing hazardous compounds in the memory care unit, which were addressed with corrective actions and staff training. No fines, immediate jeopardy findings, or enforcement actions were listed in the available reports, and no complaint investigations were noted. The pattern of findings suggests ongoing challenges in regulatory compliance, particularly in resident care documentation and safety training, with some corrective measures taken but recurring issues remaining.

Read the full inspection reports for this facility, including detailed findings and corrective actions.

Show Inspection Reports

Health Inspection History

Inspections since 2022
Total health inspections 5

Illinois average 10.4


Last Health inspection on Jun 2025

Total health citations
26 Rank #62 / 167Health citations — State benchmarkedThis home is ranked 62nd out of 167 homes in Illinois. Shows this facility's total health deficiency citations benchmarked to the Illinois State average, with a ranking across all 167 IL SNFs. Lower citation counts earn a better rank.Click the rank badge to see the full State ranking.Click here to see the full State ranking.

Illinois average 36.8

Citations per inspection
5.2 Rank #146 / 167Citations per inspection — State benchmarkedThis home is ranked 146th out of 167 homes in Illinois. Shows average deficiency citations per CMS inspection for this facility versus the Illinois mean across 167 SNFs with citation data. Lower is better.Click the rank badge to see the full State ranking.Click here to see the full State ranking.

Illinois average 3.68


Health citations are formal notices following inspections when they fail to comply with safety and care standards.

23 of 26 citations resulted from standard inspections; and 3 of 26 resulted from complaint investigations.

Breakdown of citation severity (last 4 years)
Critical health citations
0
100% better than Illinois average

Illinois average: 0.7


Serious health citations
1
72% better than Illinois average

Illinois average: 3.6

0 critical citations Illinois average: 0.7

1 serious citation Illinois average: 3.6

25 moderate citations Illinois average: 32

0 minor citations Illinois average: 0.5
Citations history (last 4 years)
Quality of Care serious citation Jun 06, 2025
Corrected

Care Planning moderate citation Jun 06, 2025
Corrected

Infection Control moderate citation Jan 24, 2025
Corrected

Nutrition moderate citation Jan 24, 2025
Corrected

Staffing Data

Reporting period: October 1 – December 31, 2025 (Q4 2025). Source: CMS Payroll-Based Journal report.

Total staff 63
Employees 49
Contractors 14
Staff to resident ratio 2.17:1
21% better than Illinois average
Illinois average ratio: 1.80:1 Illinois average ratio: 1.80:1See full Illinois ranking
Avg staff/day 24
Average shift 6.5 hours
14% worse than Illinois average
Illinois average: 7.6 hours Illinois average shift: 7.6 hoursSee full Illinois ranking
Total staff hours (quarter) 14,275

Nursing staff breakdown

Q4 2025 · Oct 1 – Dec 31 More info This data comes from the CMS Payroll-Based Journal report covering October 1 – December 31, 2025.
Registered Nurse

Manages medical care and health needs.

RN Staff 7
Average shift length Info Average shift length. Calculated as total hours divided by days worked and average staff per day. 8 hours

No contractors work on this role.

Licensed Practical Nurse

Assists with medical care and medications.

LPN Staff 8
Average shift length Info Average shift length. Calculated as total hours divided by days worked and average staff per day. 9 hours

No contractors work on this role.

Certified Nursing Assistant

Helps with daily care and mobility.

CNA Staff 28
Average shift length Info Average shift length. Calculated as total hours divided by days worked and average staff per day. 6.8 hours

No contractors work on this role.

Contractor staffing

Q4 2025 · Oct 1 – Dec 31 More info This data comes from the CMS Payroll-Based Journal report covering October 1 – December 31, 2025.

Total hours from contractors

11.1%

1,583 contractor hours this quarter

Respiratory Therapy Technician: 3 Physical Therapy Assistant: 2 Speech Language Pathologist: 2 Qualified Social Worker: 2 Medical Director: 1 Respiratory Therapist: 1 Occupational Therapy Aide: 1 Occupational Therapy Assistant: 1 Physical Therapy Aide: 1

Staff by category

Q4 2025 · Oct 1 – Dec 31 More info This data comes from the CMS Payroll-Based Journal report covering October 1 – December 31, 2025.
Certified Nursing Assistant280287,25592100%6.8
Licensed Practical Nurse8082,1379199%9
Registered Nurse7071,99592100%8
Mental Health Service Worker1014786672%7.2
Respiratory Therapy Technician0334154650%7
Nurse Practitioner1013444347%8
Physical Therapy Assistant0223366166%3.4
Clinical Nurse Specialist3033265661%5.2
Respiratory Therapist0112546267%4.1
Speech Language Pathologist0221825459%3.4
Administrator1011586672%2.4
Qualified Social Worker0221264246%2.6
Medical Director0111121415%8
Occupational Therapy Aide011781314%6
Occupational Therapy Assistant011521314%4
Physical Therapy Aide011291516%1.9
28 Certified Nursing Assistant
% of Days 100%
8 Licensed Practical Nurse
% of Days 99%
7 Registered Nurse
% of Days 100%
1 Mental Health Service Worker
% of Days 72%
3 Respiratory Therapy Technician
% of Days 50%
1 Nurse Practitioner
% of Days 47%
2 Physical Therapy Assistant
% of Days 66%
3 Clinical Nurse Specialist
% of Days 61%
1 Respiratory Therapist
% of Days 67%
2 Speech Language Pathologist
% of Days 59%
1 Administrator
% of Days 72%
2 Qualified Social Worker
% of Days 46%
1 Medical Director
% of Days 15%
1 Occupational Therapy Aide
% of Days 14%
1 Occupational Therapy Assistant
% of Days 14%
1 Physical Therapy Aide
% of Days 16%

Penalties and fines

Federal penalties imposed by CMS for regulatory violations, including civil money penalties (fines) and denials of payment for new Medicare/Medicaid admissions.

Source: CMS Penalties Database

No penalties in the past 3 years

No civil money penalties or payment denials were reported in the last 3 years.

Quality of care over time

These measures show how residents usually do over time at this home, based on health outcomes and preventive care.

High-risk clinical events score Info A composite score based on pressure ulcers, falls with injury, weight loss, walking ability decline, and activities of daily living decline. 15.7
62% worse than Illinois average

Illinois average: 9.7

Functional decline score Info A composite score based on activities of daily living decline, walking ability decline, and incontinence. 18.4
In line with Illinois average

Illinois average: 18.6

Long-stay resident measures
Need for Help with Daily Activities Increased Info Percent of long-stay residents whose need for help with daily activities has increased 16.3%
5% worse than Illinois average

Illinois average: 15.5%

Walking Ability Worsened Info Percent of long-stay residents whose ability to move independently worsened 22.2%
21% worse than Illinois average

Illinois average: 18.4%

Low Risk Residents with Bowel/Bladder Incontinence Info Percent of low risk long-stay residents who lose control of their bowels or bladder 16.6%
23% better than Illinois average

Illinois average: 21.6%

Falls with Major Injury Info Percent of long-stay residents experiencing one or more falls with major injury 7.9%
136% worse than Illinois average

Illinois average: 3.4%

High Risk Residents with Pressure Ulcers Info Percent of long-stay high risk residents with pressure ulcers 17.3%
229% worse than Illinois average

Illinois average: 5.3%

Urinary Tract Infection Info Percent of long-stay residents with a urinary tract infection 0.0%
100% better than Illinois average

Illinois average: 1.8%

Lost Too Much Weight Info Percent of long-stay residents who lose too much weight 14.6%
124% worse than Illinois average

Illinois average: 6.5%

Depressive Symptoms Info Percent of long-stay residents who have depressive symptoms 0.0%
100% better than Illinois average

Illinois average: 48.1%

Antipsychotic Use Info Percent of long-stay residents who received an antipsychotic medication 13.9%
31% better than Illinois average

Illinois average: 20.2%

Pneumococcal Vaccine Info Percent of long-stay residents assessed and appropriately given the pneumococcal vaccine 100.0%
12% better than Illinois average

Illinois average: 89.2%

Influenza Vaccine Info Percent of long-stay residents assessed and appropriately given the seasonal influenza vaccine 100.0%
9% better than Illinois average

Illinois average: 91.6%

Short-stay resident measures
Pneumococcal Vaccine Info Percent of short-stay residents assessed and appropriately given the pneumococcal vaccine 99.2%
45% better than Illinois average

Illinois average: 68.3%

Antipsychotic medication increase Info Percent of short-stay residents who newly received an antipsychotic medication 4.2%
79% worse than Illinois average

Illinois average: 2.3%

Influenza Vaccine Info Percent of short-stay residents assessed and appropriately given the seasonal influenza vaccine 90.3%
43% better than Illinois average

Illinois average: 63.0%

Breakdown by payment type

Medicare

75% of new residents, usually for short-term rehab.

Typical stay 29 days

Private pay

25% of new residents, often for short stays.

Typical stay 1 years

Facility Characteristics

Source: CMS Long-Term Care Facility Characteristics (Data as of Jan 2026)

Total residents 29
Medicare
8
27.6% of residents
Private pay or other
21
72.4% of residents
Programs & Services
Residents Group

Residents meet regularly to discuss policies, care quality, and activities

CCRC

Part of a Continuing Care Retirement Community offering multiple care levels

Active Resident Council

Organized group of residents that meets regularly to discuss facility policies, quality of life, and activities.

Finances and operations

Voluntary non-profit community
Home revenue
$25.6M
Operating deficit
-$5.4M
Voluntary non-profit community
Home revenue
$25.6M Rank #39 / 166Revenue — State benchmarkedThis home is ranked 39th out of 166 homes in Illinois. Shows this facility's annual revenue compared to the Illinois SNF average. Higher revenue generally means more resources for staffing and capital — read alongside Payroll %.Click the rank badge to see the full State ranking.Click here to see the full State ranking.
Operating deficit
-$5.4M
Payroll costs Info The portion of the home's budget spent on staff, including nurses, caregivers, and other employees who support care and operations. Rank #35 / 166Payroll — State benchmarkedThis home is ranked 35th out of 166 homes in Illinois. Shows total annual staff payroll benchmarked to the Illinois average. Higher payroll investment relative to peers often signals better staffing and less reliance on cheaper contract labor.Click the rank badge to see the full State ranking.Click here to see the full State ranking.
$11.0M
42.8% of revenue Rank #110 / 166Payroll % — State benchmarkedThis home is ranked 110th out of 166 homes in Illinois. Shows payroll as a percentage of revenue versus the Illinois average. Well-run Illinois SNFs typically land around 54–67% — the top third Statewide. Below 25% may signal understaffing or heavy agency use — read with Staffing ratings.Click the rank badge to see the full State ranking.Click here to see the full State ranking.
Other operating costs Info All remaining costs needed to run the home, such as food, utilities, building maintenance, supplies and administrative expenses.
$19.9M
Total costs $30.9M

What does this home offer?

Room sizes icon
Room sizes icon

Room Sizes: 745 / 825 / 848 / 1014 / 1024 / 1077 / 1106 / 1217 / 1546

Housing options icon

Housing Options: 1 Bed / 2 Bed

Building type icon
Building type icon

Building Type: High-rise

Dining services icon

Dining Services

Housekeeping icon
Housekeeping icon

Housekeeping Services

Social and recreational activities icon

Social and Recreational Activities

Exercise program icon

Exercise Programs

Wellness Programs icon

Wellness Programs

Who this home usually serves

TYPE OF STAY

Mostly short-term rehab stays

Most residents typically stay for a few weeks or months before returning home or moving on.

Places of interest near Admiral at the Lake

Address 8.2 miles from city center Info Estimated distance in miles from Chicago's city center to Admiral at the Lake's address, calculated via Google Maps. — 3.03 miles to nearest hospital (Ascension Saint Joseph - Chicago)

Calculate Travel Distance to Admiral at the Lake

Add your location

Address

Financial Assistance for
Nursing Home in Illinois

Admiral at the Lake is located in Chicago, Illinois.
Here are the financial assistance programs available to residents in Illinois.

Get Financial aid guidance

Community Care Program

Illinois CCP

Age 60+
General Illinois resident, at risk of nursing home placement.
Income Limits (2025) ~$1,215/month individual
Asset Limits $17,500 individual, excludes home, car
IL

High demand in urban areas; waitlists possible.

Benefits
In-home care (3-5 hours/day) Adult day services ($65/day) Emergency home response systems ($30/month)

Illinois Respite Program

IL Respite (via NFCSP)

Age Caregiver of someone 60+ (or with dementia)
General Illinois resident.
Income Limits No strict limit; prioritizes low-income.
Asset Limits Not applicable.
IL

Limited slots; urban/rural balance.

Benefits
In-home respite (4-6 hours/day) Adult day care (~$65/day) Short-term facility care (up to 5 days)

Supportive Living Program (SLP)

Illinois Medicaid Supportive Living Program

Age 65+ or 22-64 with disability
General Illinois resident, Medicaid-eligible, needs moderate assistance (not nursing home-level).
Income Limits (2025) ~$2,829/month (300% FBR, individual); QIT allowed.
Asset Limits $2,000 (individual), $3,000 (couple) (excludes home, car).
IL

~200 SLP sites statewide; room/board not covered.

Benefits
Personal care (5-7 hours/day, e.g., bathing, mobility) Meals Housekeeping Medication management Respite (~240 hours/year)

Persons Who Are Elderly Waiver

Illinois Medicaid Elderly Waiver

Age 65+
General Illinois resident, Medicaid-eligible, nursing home-level care need.
Income Limits (2025) ~$2,829/month 300% FBR, individual
Asset Limits $2,000 (individual), $3,000 (couple).
IL

Part of HealthChoice Illinois; consumer-directed options available.

Benefits
Personal care (5-7 hours/day, e.g., dressing, eating) Homemaker Adult day care (~$60/day) Respite (240 hours/year) Home mods ($1,000 avg.)

Medicare Savings Program (MSP)

Illinois Medicare Savings Program

Age 65+ or disabled
General Illinois resident, Medicare Part A/B.
Income Limits (2025) ~$2,510/month (QMB), ~$3,380/month (SLMB), ~$3,598/month (QI)—individual.
Asset Limits $9,430 (individual), $14,130 (couple).
IL

Three tiers; no waitlist.

Benefits
Covers Part B premiums ($174.70/month) Deductibles ($240/year) Copays (~20%)

Optional State Supplementation (OSS)

Illinois Optional State Supplementation

Age 65+ or disabled
General Illinois resident, in approved facility, SSI recipient or low-income.
Income Limits (2025) ~$1,004/month including SSI
Asset Limits $2,000 (individual), $3,000 (couple).
IL

~$50-$500/month based on facility type.

Benefits
Cash (~$50-$500/month) for room/board in personal care homes or SLFs

VA Aid and Attendance (A&A) and Housebound Benefits

Illinois VA Aid and Attendance/Housebound

Age 65+ or disabled veteran/spouse
General Illinois resident, wartime service, need for ADL help (A&A) or homebound.
Income Limits (2025) Net income < ~$1,984/month (veteran with dependent, A&A); pension offsets income.
Asset Limits ~$155,356 net worth limit
IL

High veteran demand in urban/rural areas.

Benefits
Cash (~$1,433-$2,642/month veteran, ~$951-$1,318 spouse) for care costs (e.g., in-home, assisted living)

Compare Nursing Home around Chicago

The information below is reported by the Illinois Department of Public Health, Office of Health Care Regulation.

5 facilities compared · CMS & IL Dept. of Health data

Filter by care type
The Selfhelp Home Senior Living Community
NH

Nursing Home Licensed facility providing 24/7 skilled nursing care for residents with complex, ongoing medical needs. Staffed by RNs, LPNs, and CNAs. Inspected and star-rated annually by CMS. Accepts Medicare (short-term rehab) and Medicaid (long-term care).

AL

Assisted Living A licensed, long-term care setting for seniors or individuals with disabilities who need help with daily activities — like bathing, dressing, and medication management — but not 24-hour skilled nursing. Offers housing, meals, and around-the-clock support while aiming to maximize resident independence.

IL

Independent Living Lifestyle-focused communities for older adults offering dining, activities, and transportation with minimal personal care. Best for active, independent seniors who want community without medical support.

RC

Respite Care Short-term temporary care — days to weeks — to give family caregivers a break. Full care provided during the stay. Often used after hospitalization or to trial a facility before a permanent placement decision.

Chicago (Uptown)72 81.9% +18%5.56 +44%+79%$0215.3159A+ 92 Marvin Rubin$15.5M$8.0M51.5%146009
Asbury Gardens
NH

Nursing Home Licensed facility providing 24/7 skilled nursing care for residents with complex, ongoing medical needs. Staffed by RNs, LPNs, and CNAs. Inspected and star-rated annually by CMS. Accepts Medicare (short-term rehab) and Medicaid (long-term care).

AL

Assisted Living A licensed, long-term care setting for seniors or individuals with disabilities who need help with daily activities — like bathing, dressing, and medication management — but not 24-hour skilled nursing. Offers housing, meals, and around-the-clock support while aiming to maximize resident independence.

IL

Independent Living Lifestyle-focused communities for older adults offering dining, activities, and transportation with minimal personal care. Best for active, independent seniors who want community without medical support.

MC

Memory Care Secured, specialized care for people living with Alzheimer's or dementia. Staff trained in cognitive impairment, with higher staff-to-resident ratios and an environment designed to reduce confusion and wandering risk.

North Aurora (Airport Road)75 80.8% +17%4.00 +6%+29%$6.4k213.5-59A+ 38 Abraham Diamond$8.6M$5.1M59.8%146170
Norwood Crossing
NH

Nursing Home Licensed facility providing 24/7 skilled nursing care for residents with complex, ongoing medical needs. Staffed by RNs, LPNs, and CNAs. Inspected and star-rated annually by CMS. Accepts Medicare (short-term rehab) and Medicaid (long-term care).

AL

Assisted Living A licensed, long-term care setting for seniors or individuals with disabilities who need help with daily activities — like bathing, dressing, and medication management — but not 24-hour skilled nursing. Offers housing, meals, and around-the-clock support while aiming to maximize resident independence.

MC

Memory Care Secured, specialized care for people living with Alzheimer's or dementia. Staff trained in cognitive impairment, with higher staff-to-resident ratios and an environment designed to reduce confusion and wandering risk.

RC

Respite Care Short-term temporary care — days to weeks — to give family caregivers a break. Full care provided during the stay. Often used after hospitalization or to trial a facility before a permanent placement decision.

Chicago (Norwood Park)55 89.1% +29%3.86 +74%+24%$78.4k294.82113- 83 Norwood Crossing Association$26.5M$13.8M52%145974
Admiral at the Lake
NH

Nursing Home Licensed facility providing 24/7 skilled nursing care for residents with complex, ongoing medical needs. Staffed by RNs, LPNs, and CNAs. Inspected and star-rated annually by CMS. Accepts Medicare (short-term rehab) and Medicaid (long-term care).

AL

Assisted Living A licensed, long-term care setting for seniors or individuals with disabilities who need help with daily activities — like bathing, dressing, and medication management — but not 24-hour skilled nursing. Offers housing, meals, and around-the-clock support while aiming to maximize resident independence.

IL

Independent Living Lifestyle-focused communities for older adults offering dining, activities, and transportation with minimal personal care. Best for active, independent seniors who want community without medical support.

MC

Memory Care Secured, specialized care for people living with Alzheimer's or dementia. Staff trained in cognitive impairment, with higher staff-to-resident ratios and an environment designed to reduce confusion and wandering risk.

Chicago (Uptown)56 88.6% +28%4.93 -22%+59%$0265.2127A+ 90 Nadia Geigler$25.6M$11.0M42.8%146165
Encore Village of Schaumburg
NH

Nursing Home Licensed facility providing 24/7 skilled nursing care for residents with complex, ongoing medical needs. Staffed by RNs, LPNs, and CNAs. Inspected and star-rated annually by CMS. Accepts Medicare (short-term rehab) and Medicaid (long-term care).

AL

Assisted Living A licensed, long-term care setting for seniors or individuals with disabilities who need help with daily activities — like bathing, dressing, and medication management — but not 24-hour skilled nursing. Offers housing, meals, and around-the-clock support while aiming to maximize resident independence.

IL

Independent Living Lifestyle-focused communities for older adults offering dining, activities, and transportation with minimal personal care. Best for active, independent seniors who want community without medical support.

MC

Memory Care Secured, specialized care for people living with Alzheimer's or dementia. Staff trained in cognitive impairment, with higher staff-to-resident ratios and an environment designed to reduce confusion and wandering risk.

Schaumburg109 55.4% -20%3.46 +8%+12%$25.5k282.62114A+ 58 Il Ccrc, LLC$96.9M$18.2M18.8%145341

Frequently Asked Questions about Admiral at the Lake

What neighborhood is Admiral at the Lake in?

Admiral at the Lake is in the Uptown neighborhood of Chicago.

Is Admiral at the Lake in a walkable area?

Admiral at the Lake has a walk score of 90. Walker's paradise. Daily errands do not require a car, with many shops and services nearby.

When does Admiral at the Lake's license expire?

According to IL state health department records, Admiral at the Lake's license expires on May 5, 2026.

What is the occupancy rate at Admiral at the Lake?

Admiral at the Lake's occupancy is 89%.

What is the best email address for Admiral at the Lake?

The team at Admiral at the Lake can be reached at [email protected].

How many beds does Admiral at the Lake have?

Admiral at the Lake has 56 beds.

What is the address of Admiral at the Lake?

Admiral at the Lake is located at 929 W Foster Ave, Chicago, IL 60640, United States.

Guides for Better Senior Living

Care Cost Calculator: See Prices in Your Area

Nursing Home Data Explorer

Don’t Wait Too Long: 7 Red Flag Signs Your Parent Needs Assisted Living Now

The True Cost of Assisted Living in 2025 – And How Families Are Paying For It

Understanding Senior Living Costs: Pricing Models, Discounts & Financial Assistance

Explore Open Rooms
1 Contact details
2 What type of senior care service are you looking for?
3 What budget do you have in mind for senior care?
4 How soon do you need to find care?
5 Additional details

Thank you for your interest!

Our team will be in touch shortly to help with next steps.


