Northern Riverview Assisted Living
Nursing Home, Assisted Living & Memory Care · Westchester County, NY
CMS overall rating Info CMS (the Centers for Medicare & Medicaid Services) is the federal agency that rates nursing home quality. Its Overall Rating runs from 1 to 5 stars, combining health inspections, staffing, and quality measures, with inspections weighted most heavily.

Northern Riverview Assisted Living

Nursing Home, Assisted Living & Memory Care · Westchester County, NY
CMS overall rating Info CMS (the Centers for Medicare & Medicaid Services) is the federal agency that rates nursing home quality. Its Overall Rating runs from 1 to 5 stars, combining health inspections, staffing, and quality measures, with inspections weighted most heavily.
Calculator: See prices in your area
Northern Riverview Assisted Living accepts Medicare, Medicaid, and private pay.

Overview of Northern Riverview Assisted Living

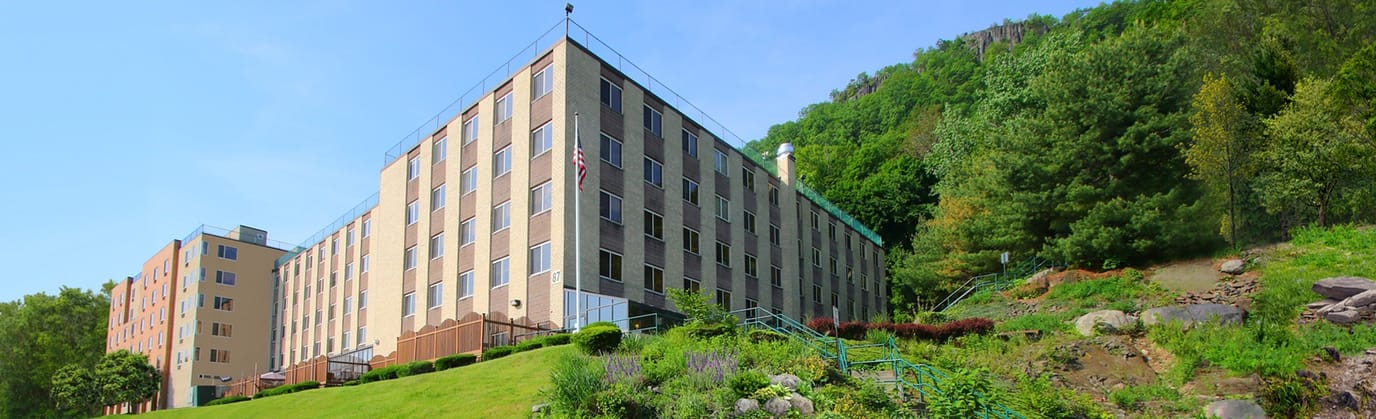
Northern Riverview Assisted Living is a blissful retreat surrounded by convenient local amenities in West Haverstraw, NY, that offers assisted living. With its commitment to improving residents’ well-being, the community provides top-tier care and assistance from a respectful and well-trained team available around the clock. Here, residents enjoy a maintenance-free lifestyle with the community handling the housekeeping and other day-to-day activities.

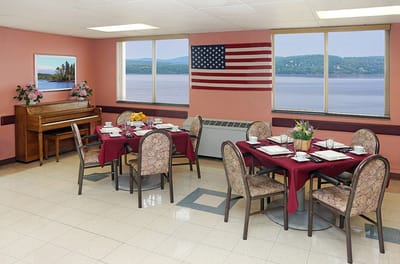
Fun activities and engaging programs are also conducted for residents to remain active and socially connected. To keep residents healthy, meals are carefully curated to meet their dietary needs and preferences. Incontinence care and medication assistance are also available for residents’ healthcare needs. Live a blissful retirement with the community’s dedicated care and purposely designed amenities.

(845) 429-4300

Quality ratings

Measured by Centers for Medicare & Medicaid Services (CMS)

Overall rating Info The Overall CMS Rating combines results from health inspections, staffing levels and quality measures. Health inspections carry the most weight. Staffing and quality scores can increase or decrease the final rating based on performance compared to state and national standards.
▼ 67.5% Below NY avg. ▼ 67.5% Below NY avg.NY average: 3.1Click the badge to see the full State ranking.Click here to see the full State ranking.
Health Inspection Info Based on the results of the facility's three most recent standard inspections and any complaint investigations. CMS reviews the number, scope, and severity of deficiencies, with more recent findings weighted more heavily.
▼ 64.7% Below NY avg. ▼ 64.7% Below NY avg.NY average: 2.8Click the badge to see the full State ranking.Click here to see the full State ranking.
Staffing Info Measures average nursing staff hours per resident per day, including Registered Nurses (RNs) and total nursing staff. Ratings are adjusted based on the level of care residents require and are compared to state and national benchmarks.
▼ 63.2% Below NY avg. ▼ 63.2% Below NY avg.NY average: 2.7Click the badge to see the full State ranking.Click here to see the full State ranking.
Quality Measures Info Based on clinical and physical health indicators reported to CMS, such as hospital readmissions, falls, pressure ulcers, and improvements in mobility. These measures reflect how well residents' health needs are being managed.
▲ 4.8% Above NY avg. ▲ 4.8% Above NY avg.NY average: 3.8Click the badge to see the full State ranking.Click here to see the full State ranking.

Staffing hours breakdown

Info Daily nursing hours per resident by staff type, reported to CMS. Higher is generally better — compare this facility to state and national averages to see where staffing stands.

Hours per resident per day — compared to New York state averages

Total nursing care / resident Info This home is ranked 322nd out of 407 homes in New York for nurse hours. Total adjusted nursing hours per resident per day, combining RN, LPN, and aide time. CMS adjusts this for case-mix so facilities can be fairly compared.
2h 46m per day
Rank #322 / 407Nurse hours — State benchmarkedThis home is ranked 322nd out of 407 homes in New York. Shows adjusted nurse hours per resident per day benchmarked to the New York average, with a ranking across 407 New York facilities. More hours mean more direct care. The national average is about 3.5 hrs; below 3.0 is a red flag.Rankings are based only on facilities in New York that report data for that category. Facilities without available data are excluded from the ranking.Click the rank badge to see the full State ranking.Click here to see the full State ranking.
This facility New York avg (3h 35m per day)
vs New York avg
-23%

5 of 6 metrics below state avg

Standout metric LPN / LVN is +8% above state avg
Staff typeHours / Day / Residentvs state avg
Registered Nurse (RN) Info RNs hold the highest nursing license and can assess residents, interpret test results, and direct care plans. More RN hours per day often signals stronger clinical oversight and faster response to health changes. 21m per day ▼ 51% State avg: 42m per day · National avg: 41m per day
LPN / LVN Info Licensed Practical Nurses (LPNs) or Licensed Vocational Nurses (LVNs) deliver routine hands-on care — medication administration, wound dressing, and monitoring vital signs. They work under RN supervision and make up a large share of daily bedside care. 50m per day ▲ 8% State avg: 47m per day · National avg: 52m per day
Nurse Aide Info Certified Nurse Aides (CNAs) provide the most direct day-to-day assistance: bathing, dressing, feeding, and mobility. Nurse aide hours are typically the largest staffing category and directly affect residents' quality of life. 1h 51m per day ▼ 16% State avg: 2h 11m per day · National avg: 2h 20m per day
Weekend Total Nursing Info Combined nursing hours (RN + LPN + Nurse Aide) per resident per day on weekends. Staffing often drops on weekends — this figure reveals whether the facility maintains adequate coverage outside of weekday hours. 2h 41m per day ▼ 17% State avg: 3h 14m per day · National avg: 3h 27m per day
Physical Therapist Info Hours per resident per day provided by licensed Physical Therapists (PTs) or PT Assistants. PT services help residents recover mobility after injury or illness and are especially important for post-acute (short-stay) rehabilitation. 6m per day ▼ 11% State avg: 7m per day · National avg: 4m per day
Weekend RN Info Registered nurse hours specifically on weekends. Facilities sometimes reduce RN presence on Saturdays and Sundays — a low weekend RN figure compared to weekday hours can indicate reduced clinical oversight when most administrative staff are absent. 11m per day ▼ 60% State avg: 29m per day · National avg: 29m per day

Capacity and availability

This home is often near full

Higher occupancy than the New York average: 88.3%
Occupancy rate
97.4% Rank #39 / 436Occupancy rate — State benchmarkedThis home is ranked 39th out of 436 homes in New York. Shows this facility's occupancy rate versus the New York average, with its Statewide rank out of 436. Higher occupancy signals strong local demand and financial stability.Rankings are based only on facilities in New York that report data for that category. Facilities without available data are excluded from the ranking.Click the rank badge to see the full State ranking.Click here to see the full State ranking.
Avg. Length of Stay
251 days
Bed community size
182-bed community Rank #262 / 748Bed count — State benchmarkedThis home is ranked 262nd out of 748 homes in New York. Shows this facility's certified or reported bed count compared to other New York facilities. Larger communities may offer more amenities, programs, and on-site services for residents and families.Rankings are based only on facilities in New York that report data for that category. Facilities without available data are excluded from the ranking.Click the rank badge to see the full State ranking.Click here to see the full State ranking.
A large-scale community that may provide a wide range of amenities, services, and structured programs.
Walk Score
Walk Score: 31 / 100 Rank #958 / 1173Walk Score — State benchmarkedThis home is ranked 958th out of 1173 homes in New York. Shows how walkable this facility's neighborhood is compared to the average Walk Score across New York facilities. Higher scores benefit residents, families, and staff.Rankings are based only on facilities in New York that report data for that category. Facilities without available data are excluded from the ranking.Click the rank badge to see the full State ranking.Click here to see the full State ranking.
Somewhat walkable. A few nearby services may be reachable on foot, but most trips require transportation.

Contact Northern Riverview Assisted Living

Staffing Data

Reporting period: October 1 – December 31, 2025 (Q4 2025). Source: CMS Payroll-Based Journal report.

Total staff 151
Employees 121
Contractors 30
Staff to resident ratio 0.86 : 1
390% more staff per resident than New York average
New York average ratio: 0.18 : 1 New York average ratio: 0.18 : 1See full New York ranking
Avg staff/day 72
Average shift 8.6 hours
12% better than New York average
New York average: 7.7 hours New York average shift: 7.7 hoursSee full New York ranking
Total staff hours (quarter) 56,733

Nursing staff breakdown

Q4 2025 · Oct 1 – Dec 31 More info This data comes from the CMS Payroll-Based Journal report covering October 1 – December 31, 2025.
Registered Nurse

Manages medical care and health needs.

RN Staff Info All 21 RN Staff are full-time employees. No contractors work on this role. 21
Average shift length Info Average shift length. Calculated as total hours divided by days worked and average staff per day. 7.8 hours
Licensed Practical Nurse

Assists with medical care and medications.

LPN Staff Info 28 total: 27 full-time employees and 1 contractor. 28
Average shift length Info Average shift length. Calculated as total hours divided by days worked and average staff per day. 9.4 hours
Certified Nursing Assistant

Helps with daily care and mobility.

CNA Staff Info 55 total: 53 full-time employees and 2 contractors. 55
Average shift length Info Average shift length. Calculated as total hours divided by days worked and average staff per day. 8.8 hours

Contractor staffing

Q4 2025 · Oct 1 – Dec 31 More info This data comes from the CMS Payroll-Based Journal report covering October 1 – December 31, 2025.

Total hours from contractors

11.4%

6,447 contractor hours this quarter

Respiratory Therapy Technician: 7 Other Dietary Services Staff: 6 Qualified Social Worker: 5 Physical Therapy Aide: 4 Physical Therapy Assistant: 3 Speech Language Pathologist: 2 Certified Nursing Assistant: 2 Licensed Practical Nurse: 1

Staff by category

Q4 2025 · Oct 1 – Dec 31 More info This data comes from the CMS Payroll-Based Journal report covering October 1 – December 31, 2025.
Certified Nursing Assistant5325530,07792100%8.8
Licensed Practical Nurse2712813,59192100%9.4
Registered Nurse210213,23192100%7.8
Respiratory Therapy Technician0771,6157784%7.6
Other Dietary Services Staff0661,4388997%7.3
Clinical Nurse Specialist7071,3617076%7.5
Nurse Practitioner4041,0346975%7.9
Physical Therapy Aide0441,0067076%7.2
Speech Language Pathologist0228896368%7.8
Physical Therapy Assistant0335457177%7.6
Other Social Services Staff1014656267%7.5
Administrator1014645863%8
Qualified Social Worker0553395459%6.2
Dental Services Staff2023254043%8
Mental Health Service Worker2022893841%7.6
Medical Director101521314%4
Occupational Therapy Aide2021422%7
55 Certified Nursing Assistant
% of Days 100%
28 Licensed Practical Nurse
% of Days 100%
21 Registered Nurse
% of Days 100%
7 Respiratory Therapy Technician
% of Days 84%
6 Other Dietary Services Staff
% of Days 97%
7 Clinical Nurse Specialist
% of Days 76%
4 Nurse Practitioner
% of Days 75%
4 Physical Therapy Aide
% of Days 76%
2 Speech Language Pathologist
% of Days 68%
3 Physical Therapy Assistant
% of Days 77%
1 Other Social Services Staff
% of Days 67%
1 Administrator
% of Days 63%
5 Qualified Social Worker
% of Days 59%
2 Dental Services Staff
% of Days 43%
2 Mental Health Service Worker
% of Days 41%
1 Medical Director
% of Days 14%
2 Occupational Therapy Aide
% of Days 2%

Penalties and fines

Federal penalties imposed by CMS for regulatory violations, including civil money penalties (fines) and denials of payment for new Medicare/Medicaid admissions.

Source: CMS Penalties Database

No penalties in the past 3 years

No civil money penalties or payment denials were reported in the last 3 years.

Quality of care over time

These measures show how residents usually do over time at this home, based on health outcomes and preventive care.

High-risk clinical events score Info A composite score based on pressure ulcers, falls with injury, weight loss, walking ability decline, and activities of daily living decline. 8.7
12% better than New York average

New York average: 9.8

Functional decline score Info A composite score based on activities of daily living decline, walking ability decline, and incontinence. 16.9
7% better than New York average

New York average: 18.1

Long-stay resident measures
Need for Help with Daily Activities Increased Info Percent of long-stay residents whose need for help with daily activities has increased 14.3%
13% better than New York average

New York average: 16.4%

Walking Ability Worsened Info Percent of long-stay residents whose ability to move independently worsened 15.4%
7% better than New York average

New York average: 16.6%

Low Risk Residents with Bowel/Bladder Incontinence Info Percent of low risk long-stay residents who lose control of their bowels or bladder 20.9%
In line with New York average

New York average: 21.4%

Falls with Major Injury Info Percent of long-stay residents experiencing one or more falls with major injury 0.5%
85% better than New York average

New York average: 3.0%

High Risk Residents with Pressure Ulcers Info Percent of long-stay high risk residents with pressure ulcers 7.8%
9% worse than New York average

New York average: 7.2%

Urinary Tract Infection Info Percent of long-stay residents with a urinary tract infection 0.6%
56% better than New York average

New York average: 1.4%

Lost Too Much Weight Info Percent of long-stay residents who lose too much weight 5.5%
10% better than New York average

New York average: 6.1%

Depressive Symptoms Info Percent of long-stay residents who have depressive symptoms 26.1%
44% worse than New York average

New York average: 18.1%

Antipsychotic Use Info Percent of long-stay residents who received an antipsychotic medication 14.3%
14% worse than New York average

New York average: 12.6%

Pneumococcal Vaccine Info Percent of long-stay residents assessed and appropriately given the pneumococcal vaccine 100.0%
9% better than New York average

New York average: 91.4%

Influenza Vaccine Info Percent of long-stay residents assessed and appropriately given the seasonal influenza vaccine 100.0%
5% better than New York average

New York average: 95.2%

Short-stay resident measures
Pneumococcal Vaccine Info Percent of short-stay residents assessed and appropriately given the pneumococcal vaccine 98.9%
29% better than New York average

New York average: 76.6%

Antipsychotic medication increase Info Percent of short-stay residents who newly received an antipsychotic medication 2.4%
87% worse than New York average

New York average: 1.3%

Influenza Vaccine Info Percent of short-stay residents assessed and appropriately given the seasonal influenza vaccine 97.9%
24% better than New York average

New York average: 78.8%

Breakdown by payment type

Medicare

30% of new residents, usually for short-term rehab.

Typical stay 3 - 4 months

Private pay

43% of new residents, often for short stays.

Typical stay 3 months

Medicaid

26% of new residents, often for long-term daily care.

Typical stay 2 years

Facility Characteristics

Source: CMS Long-Term Care Facility Characteristics (Data as of Jan 2026)

Total residents 176
Medicare
10
5.7% of residents
Medicaid
131
74.4% of residents
Private pay or other
35
19.9% of residents
Programs & Services
Residents Group

Residents meet regularly to discuss policies, care quality, and activities

Active Resident Council

Organized group of residents that meets regularly to discuss facility policies, quality of life, and activities.

Finances and operations

Based on CMS SNF Cost Report for fiscal year ending in 12/2023.

Governmental community
Operated by a subsidized facility district.
Net patient revenue Info Net patient revenue — what the home actually collects for resident care, after contractual allowances, bad debt and discounts are subtracted from its gross charges (CMS cost report, Worksheet G-3). It covers resident care only; money the home earns from other sources is shown separately as "Other income."
$25.1M
Net patient income Info Net patient income: net patient revenue minus the home's total operating expenses. A positive figure means it earns more from resident care than it spends to deliver it; a negative figure means the opposite. It excludes non-operating "other income."
$2.1M
Governmental community Operated by a subsidized facility district.
Net patient revenue Info Net patient revenue — what the home actually collects for resident care, after contractual allowances, bad debt and discounts are subtracted from its gross charges (CMS cost report, Worksheet G-3). It covers resident care only; money the home earns from other sources is shown separately as "Other income."
$25.1M Rank #219 / 403Revenue — State benchmarkedThis home is ranked 219th out of 403 homes in New York. Shows this facility's annual revenue compared to the New York average. Higher revenue generally means more resources for staffing and capital — read alongside Payroll %.Rankings are based only on facilities in New York that report data for that category. Facilities without available data are excluded from the ranking.Click the rank badge to see the full State ranking.Click here to see the full State ranking.
Net patient income Info Net patient income: net patient revenue minus the home's total operating expenses. A positive figure means it earns more from resident care than it spends to deliver it; a negative figure means the opposite. It excludes non-operating "other income."
$2.1M
Other income Info Money the home earns outside of resident care — such as investments, grants, rentals and other non-operating sources (CMS cost report, Worksheet G-3). It is tracked separately from net patient revenue: it is not part of that figure, and it is not included in net patient income.
$443.5K
Payroll costs Info Staff salaries plus wage-related costs — benefits such as payroll taxes, health insurance and retirement — from the home's own accounting records (CMS cost report, Worksheet A). Contract or agency labor is counted separately, under other operating costs. Rank #213 / 403Payroll — State benchmarkedThis home is ranked 213th out of 403 homes in New York. Shows total annual staff payroll benchmarked to the New York average. Higher payroll investment relative to peers often signals better staffing and less reliance on cheaper contract labor.Rankings are based only on facilities in New York that report data for that category. Facilities without available data are excluded from the ranking.Click the rank badge to see the full State ranking.Click here to see the full State ranking.
$10.4M 41.3% of net patient revenue Info Payroll as a share of revenue: staff salaries and wage-related benefits divided by net patient revenue. A higher figure means more of each revenue dollar goes to staff pay. Rank #215 / 403Payroll % — State benchmarkedThis home is ranked 215th out of 403 homes in New York. Shows payroll as a percentage of revenue versus the New York average. Well-run New York facilities typically land around 53–65% — the top third Statewide. Below 25% may signal understaffing or heavy agency use — read with Staffing ratings.Rankings are based only on facilities in New York that report data for that category. Facilities without available data are excluded from the ranking.Click the rank badge to see the full State ranking.Click here to see the full State ranking.
Other operating costs Info Everything it costs to run the home apart from payroll — food, utilities, supplies, maintenance, contract labor and administration. Calculated as total operating expense minus payroll (staff salaries and wage-related benefits).
$12.6M
Total costs Info The home's total operating expense for the year — all the costs of running it, salaries included (CMS cost report, Worksheet G-3).
$23.0M

What does this home offer?

Housing options icon

Housing Options: Studio / Semi-Private Rooms

Building type icon
Building type icon

Building Type: Mid-rise

Recreational activities icon

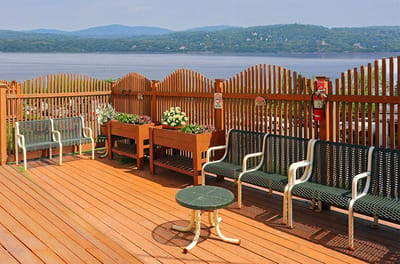
Recreational Activities

Who this home usually serves

TYPE OF STAY

Mostly long-term care residents

Most residents stay for extended periods and receive ongoing daily care.

New residents most often arrive under private pay (43% of admissions), and a typical private pay stay runs around 3 months.

Admissions
257 total

Coverage residents most often arrive under.

Medicare 30%
Private pay 43%
Medicaid 26%
Discharges
255 total

Coverage residents most often leave under.

Medicare 20%
Private pay 30%
Medicaid 50%

Places of interest near Northern Riverview Assisted Living

Address 0.9 miles from city center Info Estimated distance in miles from Haverstraw's city center to Northern Riverview Assisted Living's address, calculated via Google Maps.

Calculate Travel Distance to Northern Riverview Assisted Living

Add your location

Address

Compare Nursing Homes around Westchester County

The information below is reported by the New York State Department of Health.

5 facilities compared · CMS & NY Dept. of Health data

United Hebrew of New Rochelle
NH
AL
IL
MC
New Rochelle
294
Facility 294
NY AVG 160
Rank #74 / 748
57.1%
Facility 57.1%
NY AVG 88.3%
Rank #397 / 436
-35%
3.72
Facility 3.72
NY AVG 3.58
Rank #123 / 407
+31%+4%
$0
Facility $0
NY AVG $67.6k
Rank #1 / 415
96
Facility 96
NY AVG 83
Rank #42 / 593
7
Facility 7
NY AVG 18.5
Rank #31 / 414
2.3
Facility 2.3
NY AVG 5.1
Rank #31 / 414
-165-
80
Facility 80
NY AVG 63
Rank #457 / 1173
Rita Mabli
$31.9M
Facility $31.9M
NY AVG $32.0M
Rank #133 / 403
$27.5M
Facility $27.5M
NY AVG $10.7M
Rank #56 / 403
86%
Facility 86%
NY AVG 37%
Rank #8 / 403
335621
The Wartburg Home
NH
ADC
AL
HC
IL
MC
PC
RC
Mount Vernon (North Side)
210
Facility 210
NY AVG 160
Rank #155 / 748
22.9%
Facility 22.9%
NY AVG 88.3%
Rank #410 / 436
-74%
4.66
Facility 4.66
NY AVG 3.58
Rank #25 / 407
0%+30%
$0
Facility $0
NY AVG $67.6k
Rank #1 / 415
88
Facility 88
NY AVG 83
Rank #214 / 593
14
Facility 14
NY AVG 18.5
Rank #153 / 414
3.5
Facility 3.5
NY AVG 5.1
Rank #102 / 414
-46-
31
Facility 31
NY AVG 63
Rank #958 / 1173
Wartburg Home Of The Evangelical Lutheran Church
$19.5M
Facility $19.5M
NY AVG $32.0M
Rank #246 / 403
$18.8M
Facility $18.8M
NY AVG $10.7M
Rank #136 / 403
96.4%
Facility 96.4%
NY AVG 37%
Rank #9 / 403
335269
North Westchester Restorative Therapy and Nursing Center
NH
Mohegan Lake (Town Of Cortlandt)
120
Facility 120
NY AVG 160
Rank #412 / 748
28.3%
Facility 28.3%
NY AVG 88.3%
Rank #419 / 436
-68%
3.36
Facility 3.36
NY AVG 3.58
Rank #176 / 407
+7%-6%
$0
Facility $0
NY AVG $67.6k
Rank #1 / 415
92
Facility 92
NY AVG 83
Rank #121 / 593
20
Facility 20
NY AVG 18.5
Rank #257 / 414
5.0
Facility 5.0
NY AVG 5.1
Rank #219 / 414
-34-
43
Facility 43
NY AVG 63
Rank #851 / 1173
Moshe Braver
$23.5M
Facility $23.5M
NY AVG $32.0M
Rank #244 / 403
$15.8M
Facility $15.8M
NY AVG $10.7M
Rank #177 / 403
67.1%
Facility 67.1%
NY AVG 37%
Rank #47 / 403
335342
Tarrytown Rehabilitation and Nursing Center
NH
CH
Tarrytown (Village Of Tarrytown)
120
Facility 120
NY AVG 160
Rank #412 / 748
94.2%
Facility 94.2%
NY AVG 88.3%
Rank #235 / 436
+7%
3.57
Facility 3.57
NY AVG 3.58
Rank #139 / 407
+20%0%
$0
Facility $0
NY AVG $67.6k
Rank #1 / 415
94
Facility 94
NY AVG 83
Rank #82 / 593
9
Facility 9
NY AVG 18.5
Rank #57 / 414
4.5
Facility 4.5
NY AVG 5.1
Rank #184 / 414
-114-
90
Facility 90
NY AVG 63
Rank #261 / 1173
Avrohom Orzel
$17.7M
Facility $17.7M
NY AVG $32.0M
Rank #216 / 403
$9.5M
Facility $9.5M
NY AVG $10.7M
Rank #287 / 403
53.6%
Facility 53.6%
NY AVG 37%
Rank #373 / 403
335421
Northern Riverview Assisted Living
NH
AL
MC
Haverstraw
182
Facility 182
NY AVG 160
Rank #262 / 748
97.4%
Facility 97.4%
NY AVG 88.3%
Rank #39 / 436
+10%
2.77
Facility 2.77
NY AVG 3.58
Rank #322 / 407
+10%-23%
$0
Facility $0
NY AVG $67.6k
Rank #1 / 415
-
40
Facility 40
NY AVG 18.5
Rank #395 / 414
8.0
Facility 8.0
NY AVG 5.1
Rank #363 / 414
-177-
31
Facility 31
NY AVG 63
Rank #958 / 1173
Ari Steinberg
$25.1M
Facility $25.1M
NY AVG $32.0M
Rank #219 / 403
$10.4M
Facility $10.4M
NY AVG $10.7M
Rank #213 / 403
41.3%
Facility 41.3%
NY AVG 37%
Rank #215 / 403
335418

Financial Assistance for
Nursing Home in New York

Northern Riverview Assisted Living is located in Haverstraw, New York.
Here are the financial assistance programs available to residents in New York.

Get Financial aid guidance

Community First Choice Option

NY Medicaid CFCO

Age 65+ or disabled
General New York resident, Medicaid- eligible, care need (not necessarily nursing home level).
Income Limits (2025) ~$2,829/month 300% FBR, individual
Asset Limits $30,182 individual, higher due to NY Medicaid expansion
NY

Higher asset limit; urban density increases demand.

Benefits
Personal care (5-7 hours/day) Respite care (240 hours/year) Home modifications ($1,500 avg.) Assistive technology ($500 avg.)

Expanded In-Home Services for the Elderly Program (EISEP)

NY EISEP

Age 60+
General New York resident, at risk of decline but not nursing home level.
Income Limits ~$2,500/month individual, varies
Asset Limits $15,000 individual
NY

Cost-sharing required above certain income; urban/rural balance.

Benefits
In-home care (3-5 hours/week) Respite (up to 10 days/year) Case management Transportation (~5 trips/month)

Senior Citizen Rent Increase Exemption (SCRIE)

NY SCRIE

Age 62+
General NYC resident, live in rent-controlled/stabilized apartment, spend >1/3 of income on rent.
Income Limits (2025) $50,000/year household
Asset Limits No strict asset cap, but income-focused eligibility.
NY

Limited to NYC’s rent-regulated units; high demand in urban areas.

Benefits
Rent freeze (e.g., covers increases of $50-$200+/month); tax credit for landlord

Senior Citizen Homeowners’ Exemption (SCHE)

NY SCHE

Age 65+
General NYC resident, own and live in a 1-3 family home, co-op, or condo.
Income Limits (2025) $58,399/year household
Asset Limits No strict asset cap, income-driven eligibility.
NY

Applies only in NYC; excludes large apartment buildings.

Benefits
Property tax reduction (5-50%, e.g., $500-$5,000/year based on income and property value)

New York Foundation for Senior Citizens (NYFSC) Home Sharing Program

NYFSC Home Sharing

Age One participant must be 60+ (host or guest)
General NYC resident, able to share living space.
Income Limits No strict limit, but targets those needing cost relief.
Asset Limits Not applicable; focus on housing need.
NY

Primarily NYC-focused; limited slots due to demand.

Benefits
Shared housing (reduces rent/living costs by 30-50%, e.g., $500-$1,000/month savings); optional light assistance between housemates

Frequently Asked Questions about Northern Riverview Assisted Living

What neighborhood is Northern Riverview Assisted Living in?

Northern Riverview Assisted Living is in the Haverstraw neighborhood.

Is Northern Riverview Assisted Living in a walkable area?

Northern Riverview Assisted Living has a walk score of 31. Somewhat walkable. A few nearby services may be reachable on foot, but most trips require transportation.

What is the occupancy rate at Northern Riverview Assisted Living?

Northern Riverview Assisted Living's occupancy is 97.4%.

Are there photos of Northern Riverview Assisted Living?

Yes — there are 3 photos of Northern Riverview Assisted Living in the photo gallery on this page.

What is the address of Northern Riverview Assisted Living?

Northern Riverview Assisted Living is located at 89 Rte 9W, Haverstraw, NY 10927.

What is the phone number of Northern Riverview Assisted Living?

(845) 429-4300 will put you in contact with the team at Northern Riverview Assisted Living.

Is Northern Riverview Assisted Living Medicare or Medicaid certified?

Yes — Northern Riverview Assisted Living is a CMS-certified provider of Medicare and Medicaid.

Guides for Better Senior Living

Care Cost Calculator: See Prices in Your Area

Nursing Home Data Explorer

Don’t Wait Too Long: 7 Red Flag Signs Your Parent Needs Assisted Living Now

The True Cost of Assisted Living in 2025 – And How Families Are Paying For It

Understanding Senior Living Costs: Pricing Models, Discounts & Financial Assistance